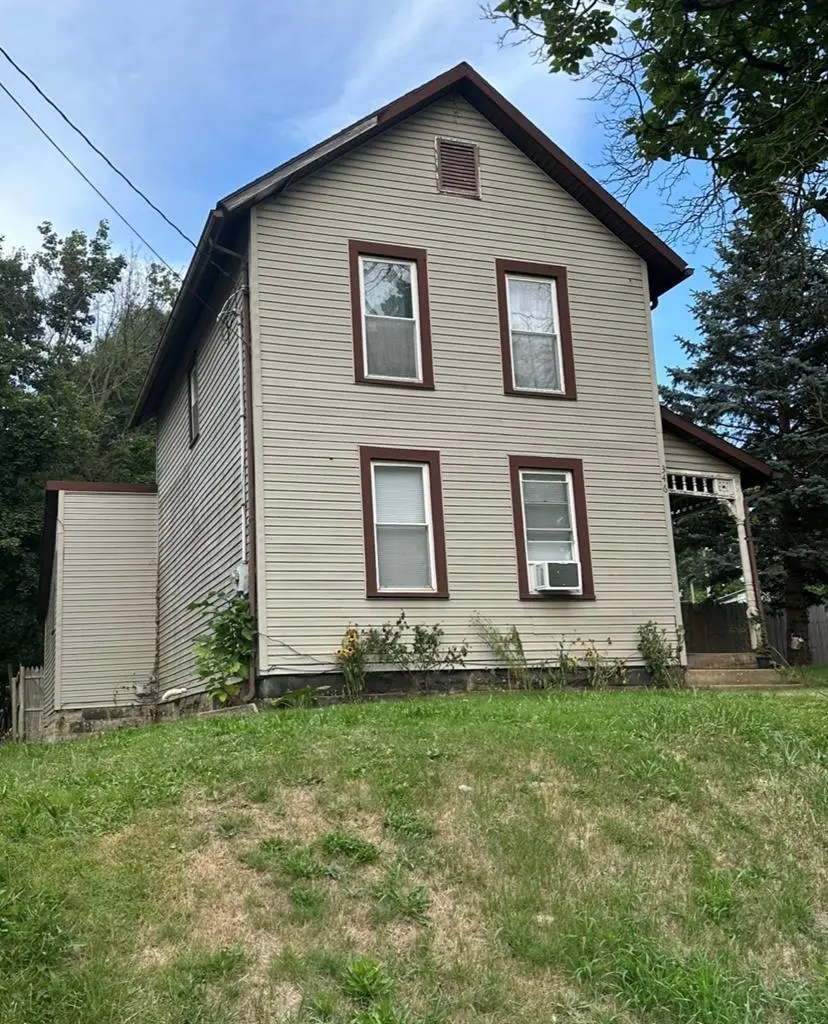
346 Newman St · Mansfield, OH
Flood risk 1/10 · Minimal
- FEMA flood zone
- X (unshaded)
- Chance of flooding over 30 yrs
- 0.0%
- Est. flood insurance / yr
- $473 – $860
Fire risk 1/10 · Minimal
- Est. fire insurance / yr
- $713 – $1,323
Heat risk 3/10 · Minor
- Hot days now (above 96°F)
- 7 days/yr
- Hot days in 30 yrs
- 17 days/yr
Wind risk 2/10 · Minimal
- Chance of severe wind over 30 yrs
- —
Air-quality risk 2/10 · Minimal
- Unhealthy air days now
- 1 days/yr
- Unhealthy air days in 30 yrs
- 1 days/yr
Risk factors via First Street. Map © Google.
Why this score? — see what drove the D grade
The composite is a weighted blend of 9 inputs, each scored 0–100. Each bar is that input's sub-score; the figure is the points it added to the 100-point composite (weight × sub-score).
- Cash flow +20.6/30.0
- DSCR +6.5/10.0
- 1% rule +4.4/10.0
- Livability +3.8/5.0
- Rent growth +2.5/5.0
- Condition / age +2.5/5.0
- Schools +2.3/10.0
- ARV discount +0.0/15.0
- Appreciation +0.0/10.0
$99,900
🖨 Deal sheet (PDF) 📄 Offer letter ✓ Due diligence
Listing remarks MLS
Very Nicely updated home sitting up on a Hill. 3 spacious bedrooms upstairs. Large living room, Dining Room (Which is being used as a very nice 4th bedroom currently) and applienced kitchen on the main floor. Home has a large covered front porch as well as a rear covered porch. Full basement. Seller will provide 1 year home warranty. Seller will also will be agreeable to make some FHA repairs (Must be negotiated)
Key facts
- Rear covered porch
- Large living room
- Full basement
Tags
Neighborhood map
What this means for you Summary
Snapshot
- This is a 4-bed/1.0-bath single-family listed at $100k.
Deal economics
- At list price, monthly cash flow is $133 ($2k/yr) — positive.
- The deal already cash-flows at list — no discount required.
- To meet the 1% rule (rent ≥ 1% of price), the offer needs to be $94k (5.8% below list).
- Recommended offer: $94k (6.0% below list) — sets the bar for market timing.
- Cap rate 7.9% vs local median 4.3% in Mansfield — top-decile yield for the area; either an underpriced asset or a hidden risk that comps aren't pricing in. Stress-test before assuming the spread holds.
Location & tenants
- Location reads 76/100 on livability (#224 in OH, #3,525 nationally) — a middle-class / working-renter tenant base. Strengths: commute A+, cost of living A+, housing A+; Watch: crime D-, amenities D-, employment F.
- Mansfield City (urban): math 24% / reading 33% proficiency, ranked #590 of 656 in OH (top 90%) — low school quality limits family demand, transient renter base, plan for 1-2y turnover; 80% free/reduced lunch — lower-income household profile, screen leases tightly.
- Zoned schools: Malabar Intermediate School (math 17% / reading 29%, grade F, #1,233 of 1,584 statewide, top 78%, 762 students, 0% FRL); Mansfield Middle School (math 18% / reading 30%, grade F, #593 of 654 statewide, top 91%, 427 students, 0% FRL); Mansfield Senior High School (math 22% / reading 32%, grade F, #632 of 781 statewide, top 81%, 815 students, 0% FRL) — zoned schools average 0% FRL vs 80% district-wide (80 pts lower); this property's tenant base skews higher-income than the district average.
- Market conditions: 123 active listings in the ZIP; 4 comparable units currently listed for rent nearby; rentals lingering (median 46d on market — plan ~5-8 weeks vacancy on turnover, expect pricing pressure); 100% of comp listings sitting > 30 days — soft ceiling on asking rent; 145 units permitted in Richland County in 2024 (0 in 5+ unit buildings).
- This rent is only 17% of the median local income ($65k/yr) — well below the 30% rent-burden line; pricing power to push rent on renewal without tenant pushback.
Forward outlook
- Local home prices are declining (-3.0%/yr); year-one equity from $691 of loan paydown is wiped out by about $3k of value loss. Plan a longer hold.
- Richland County population projected at -18% by 2050 — secular population decline; favor cash flow + early exit over multi-decade hold.
Negotiation context
- It's been on market 83 days — a 6% lower offer ($94k) is reasonable based on typical stale-listing flexibility.
- 2 sale attempts with the ask held roughly flat each time — persistent listings suggest the price (not the market) is what's stuck; bring a comps-based counter.
- Current owner paid $16k; list at $100k implies a 520% gain — meaningful room to come down on a strong offer.
Risks & watch-outs
- Watch-outs: built in 1900 — expect roof / HVAC / electrical / plumbing capex.
Questions for the listing agent
- It's been on market 83 days. Have you received any prior offers? Is the seller open to a 6% concession, seller financing, or rate buy-down credit?
- Built in 1900 — when were the roof, HVAC, electrical panel, plumbing, and water heater last replaced?
- Why hasn't it sold? Are there any deal-killer items the seller is aware of (foundation, flood, title, zoning, code violations)?
- Is there a deadline driving the sale (1031 exchange, divorce, estate, relocation)? That informs how much negotiation room exists.
- Crime grade is D in this area — have there been break-ins, vandalism, or insurance claims at this property in the last 3 years? What carrier currently insures it and at what premium?
- The area grade is low — what's the realistic commute time and amenity access for the typical tenant pool here? Any planned neighborhood developments (good or bad) we should know about?
- What's the average days-on-market for RENTAL listings here right now (not sales)? A rising rental-DOM trend means longer vacancies and softer asking-rent achievability than the comps imply.
- What's the recent tenant-quality profile in this submarket — average credit score on applications, eviction rate, late-payment / NSF rate, and stable-employment percentage? A property-management company in the area should have these aggregated.
- How much new for-sale + rental construction is in the pipeline within 1–3 miles? Heavy new supply typically softens prices + rents 12–24 months out; constrained supply supports both.
Investment metrics
- 1% rule
- 0.94% ✗
- Cap rate
- 7.89%
- Cash-on-cash
- 5.70%
- DSCR
- 1.25
- GRM
- 8.8
CMA / ARV
- ARV (median comp)
- $82,629
- List price
- $99,900
- Delta
- 20.90%
- Verdict
- OVERPRICED
- Comps
- 20 within 1.0 mi
Show comp detail 12 sales within ~0.75 mi
| Address | Dist | Beds/Ba | Sqft | Sold | Price | $/sf | Match |
|---|---|---|---|---|---|---|---|
| 311 Auburn St | 0.24mi | 3/3.0 (-1) | 1,310 (+2%) | 5mo | $85,000 | $65 | 67 |
| 328 Second Ave | 0.32mi | 3/1.0 (-1) | 1,219 (-5%) | 6mo | $86,000 | $71 | 67 |
| 296 Newman St | 0.10mi | 4/1.0 | 1,126 (-12%) | 12mo | $58,000 | $52 | 65 |
| 484 Van Buren Ave | 0.55mi | 3/1.0 (-1) | 1,312 (+2%) | 1mo | $130,000 | $99 | 65 |
| 382 Fourth Ave | 0.51mi | 3/1.0 (-1) | 1,352 (+6%) | 0mo | $87,000 | $64 | 62 |
| 408 Grace St | 0.42mi | 3/1.0 (-1) | 1,248 (-2%) | 12mo | $150,350 | $120 | 61 |
| 411 Grace St | 0.44mi | 4/1.5 | 1,420 (+11%) | 3mo | $123,000 | $87 | 57 |
| 395 Auburn St | 0.40mi | 4/2.0 | 1,152 (-10%) | 7mo | $124,000 | $108 | 55 |
| 360 Central Ave | 0.43mi | 3/1.0 (-1) | 1,136 (-11%) | 4mo | $120,000 | $106 | 53 |
| 450 Vine St | 0.61mi | 3/1.0 (-1) | 1,374 (+7%) | 4mo | $139,900 | $102 | 51 |
| 315 5th Ave | 0.56mi | 3/1.0 (-1) | 1,380 (+8%) | 12mo | $120,000 | $87 | 46 |
| 156 Buckingham Ave | 0.70mi | 4/2.0 | 1,430 (+12%) | 8mo | $156,000 | $109 | 38 |
Match score weights: distance 35% · size 25% · config 20% · recency 20%. Top-matched comps best support the ARV.
Projected returns pro-forma
-3.0% appreciation · 3.0% rent growth · sell at horizon
- IRR
- -7.5%
- Equity multiple
- 0.72×
- Total profit
- $-7,762
- Equity at exit
- $14,895
- IRR
- 2.0%
- Equity multiple
- 1.14×
- Total profit
- $3,995
- Equity at exit
- $8,638
Cash invested: $27,972 (down + closing). Projections, not guarantees.
Landlord ↔ Tenant lean methodology
- Overall (STATE)
- 73 Landlord-Friendly
- State Ohio
- 73 Landlord-Friendly · R+6
- County
- — inherits STATE
- City
- — inherits STATE
ZIP-level market 44903
- Home prices YoY
- -27.7%
- Active inventory
- 123
- Price-to-rent
- 8.8×
Monthly cashflow live
- Estimated rent
- $941 medium interval (Pro) →
- Mortgage (P&I)
- −$524
- Tax from tax record
- −$45 /mo · $545/yr
- Insurance
- −$42
- HOA
- −$0
- Lot rent
- −$0
- Vacancy / Maint / Mgmt
- −$198
- Net cashflow
- $133
Break-even live
Sensitivity live
| Price | -10% $189 | -5% $161 | +0% $133 | +5% $105 | +10% $76 |
|---|---|---|---|---|---|
| Rent | -10% $58 | -5% $96 | +0% $133 | +5% $170 | +10% $207 |
| Rate | -1.0pp $183 | -0.5pp $158 | base $133 | +0.5pp $107 | +1.0pp $81 |
UW: 25.0% down · 7.5% · 30yr · 1.5% tax · 5.0% vac · 8.0% maint · 8.0% mgmt
Financing live
Cash to close
- Down payment
- $24,975
- Closing costs
- $2,997
- Reserves months
- —
- Total cash needed
- —
Loan-product check · same deal, 3 products live
Conventional
25% down · 7.5% · 30yr
- Down + closing
- —
- Monthly P&I
- —
- Monthly cashflow
- —
- DSCR
- —
- Eligible?
- —
Personal DTI + credit; lowest rate.
DSCR
20% down · 8.5% · 30yr
- Down + closing
- —
- Monthly P&I
- —
- Monthly cashflow
- —
- DSCR
- —
- Eligible?
- —
No personal income docs; deal must DSCR.
Hard money
10% down · 12.0% · 12mo
- Down + closing
- —
- Monthly P&I
- —
- Monthly cashflow
- —
- DSCR
- —
- Eligible?
- —
Short-term bridge; refi at stabilization.
Rent comps 4 comps
| Address | Beds | Baths | Sqft | Rent | $/sqft | DOM | Units | Dist |
|---|---|---|---|---|---|---|---|---|
| 520 Lida St Mansfield, OH | 3.0 | 1.0 | 1300 | $850 | $0.65 | 46d | 1 | 0.73mi |
| 243 W 1st St Mansfield, OH | 4.0 | 1.0 | 1470 | $1,195 | $0.81 | 46d | 1 | 1.19mi |
| 39 Florence Ave #41 Mansfield, OH | 5.0 | 1.0 | 1236 | $800 | $0.65 | 46d | 1 | 1.34mi |
| 147 Ford St Mansfield, OH | 3.0 | 1.5 | 1286 | $995 | $0.77 | 46d | 1 | 1.35mi |
Listing history 24 events
-
2026-06-22days on market $99,900 Active 83 DOM
-
2026-06-21days on market $99,900 Active 82 DOM
-
2026-06-19days on market $99,900 Active 80 DOM
-
2026-06-18days on market $99,900 Active 79 DOM
-
2026-06-17days on market $99,900 Active 78 DOM
-
2026-06-16days on market $99,900 Active 77 DOM
-
2026-06-15days on market $99,900 Active 76 DOM
-
2026-06-14days on market $99,900 Active 74 DOM
-
2026-06-12remarks 635-char remark
-
2026-06-12days on market $99,900 Active 73 DOM
-
2026-06-09days on market $99,900 Active 70 DOM
-
2026-06-08days on market $99,900 Active 69 DOM
-
2026-06-07days on market $99,900 Active 68 DOM
-
2026-06-05days on market $99,900 Active 65 DOM
-
2026-06-03days on market $99,900 Active 64 DOM
-
2026-06-02days on market $99,900 Active 63 DOM
-
2026-06-01days on market $99,900 Active 62 DOM
-
2026-05-31days on market $99,900 Active 61 DOM
-
2026-05-30days on market $99,900 Active 60 DOM
-
2026-04-01$99,900 Active 416-char remark
Show marketing remark (416 chars)
Very Nicely updated home sitting up on a Hill. 3 spacious bedrooms upstairs. Large living room, Dining Room (Which is being used as a very nice 4th bedroom currently) and applienced kitchen on the main floor. Home has a large covered front porch as well as a rear covered porch. Full basement. Seller will provide 1 year home warranty. Seller will also will be agreeable to make some FHA repairs (Must be negotiated)
-
2025-12-15price $99,000
-
2025-10-16price $118,000
-
2025-08-18$129,900 Active
-
2020-10-15soldstatus $16,100
ⓘ Source: listings_history table (triggers on properties + properties_extension) + one-shot
backfill from property_details.listing_events for pre-trigger history.
Tax reassessment forecast OH · Partial reset (capped growth)
- Current annual tax
- $545 · $45/mo
- Projected year-2 tax
- $1,051 · $88/mo
- Expected delta
- +$507/yr (+$42/mo · 93.1%)
ⓘ Screening estimate from a state-policy table — verify with the county assessor before closing.
Climate risk First Street
- Flood 1/10 Low FEMA zone X (unshaded) · 0% chance over 30 yrs
- Wildfire 1/10 Low
- Heat 3/10 Moderate 7 d/yr ≥96°F today · 17 d/yr by 30 yrs out
- Wind 2/10 Low
- Air quality 2/10 Low 1 unhealthy d/yr today · 1 by 30 yrs out
Nearby sold comps map
Loading sold comps map…
Walkable amenities ~0.75 mi
Loading nearby amenities…
Taxation est. · year 1
- Rental income
- $11,297
- − Mortgage interest
- −$5,596
- − Property taxes
- −$545
- − Insurance
- −$500
- − Repairs & maintenance
- −$904
- − Management
- −$904
- − Depreciation
- −$2,906
- Taxable loss
- −$57
- Est. tax savings @ 24.0%
- +$14
- After-tax cash flow
- $1,608/yr
For passive investors: Depreciation is non-cash, so a rental often shows a tax loss while cash-flowing — sheltering income. Rental losses are passive: they offset passive income freely, and up to $25,000/yr can offset ordinary (W-2) income if you actively participate and your MAGI is under $100k (phasing out to $0 by $150k); unused losses carry forward. On sale, claimed depreciation is recaptured at up to 25%, and gains may owe capital-gains tax (a 1031 exchange can defer both). Figures are a year-1 estimate at your 24.0% rate — not tax advice; consult a CPA.
Schools (NCES district)
- District
- Mansfield City
- NCES district ID
- 3904429
- Math proficiency
- 24% ▼ -19.00%
- Reading proficiency
- 33% ▼ -12.00%
- Median HH income
- $32,435
- Composite
- 23.25/100
- National rank
- #7934
- State rank
- #590 of 656 in OH
Livability — Mansfield
- Score
- 76/100
- State rank
- #224
- US rank
- #3525
Category grades
Schools grade is shown separately in the Schools card above.
Census & demographics
- Census place
- Mansfield, OH
- County
- Richland · 128,966 people
- City population
- 16,349
- Metro
- Mansfield, OH
- Population (ZIP)
- 26,804
- Household income
- $65,421
- Rent vs Own
- Severe rent burden
- 9.5
Population outlook (Richland County) Hauer SSP2
- Today (2025)
- 115,577 people
- By 2030
- 111,669 · -3.4%
- By 2040
- 103,323 · -10.6%
- By 2050
- 95,135 · -17.7%
- By 2075
- 76,719 · -33.6%
- By 2100
- 57,188 · -50.5%
Race, ethnicity, and origin ACS 2023
- Neighborhood character
- Predominantly White (80%)
- Race & ethnicity
- White 80% Two or more races 9% Black 9% Hispanic / Latino 2% Asian 1%
- Common ancestry
- Slovak 2% Iranian 1% Romanian 1%
- Foreign-born
- 1%
- Languages at home
- 97% English-only · Spanish 1% Other Indo-European 1%
Political lean MEDSL · Richland
- 2024 margin
- Solid R (+42.3) · D 28.4% · R 70.8%
- 2008→2024 swing
- -28.8pp toward R · 2008: -13.6pp · 2024: -42.3pp
- All cycles
- 2024: R+42.3 2020: R+39.7 2016: R+37.5 2012: R+20.1 2008: R+13.6
Not yet ingested
- Civics
- —
Market trends
- HPI YoY
- ▼ -92.50%
- Current HPI
- 241.9342
- Rent YoY
- —
- Metro
- —
- State GDP YoY
- ▲ 1.98%
- F500 in state
- 48
Industry mix (Fortune 500 HQ in OH)
| Industry | F500 HQs | Revenue |
|---|---|---|
| Insurance | 3 | $145B |
|
||
| Industrial Machinery | 3 | $49B |
|
||
| Financial Services | 3 | $24B |
|
||
| Consumer Goods | 2 | $93B |
|
||
| Aerospace / Defense | 2 | $47B |
|
||
| Utilities | 2 | $33B |
|
||
Price history
+520.5% since first listed5 events — show timeline
- 2026-04-01 Listed $99,900 MARMLS
- 2025-12-15 Price Changed $99,000 MARMLS
- 2025-10-16 Price Changed $118,000 MARMLS
- 2025-08-18 Listed $129,900 MARMLS
- 2020-10-15 Sold (Public Records) $16,100 Public Records
Property tax history
-0.7%/yrLatest (2025): $545 · -2.2% YoY. Source: county tax records.
Cash-flow waterfall
monthlySold comps — $/sqft
last 12 mo · ≤1 miLoading sold comps…