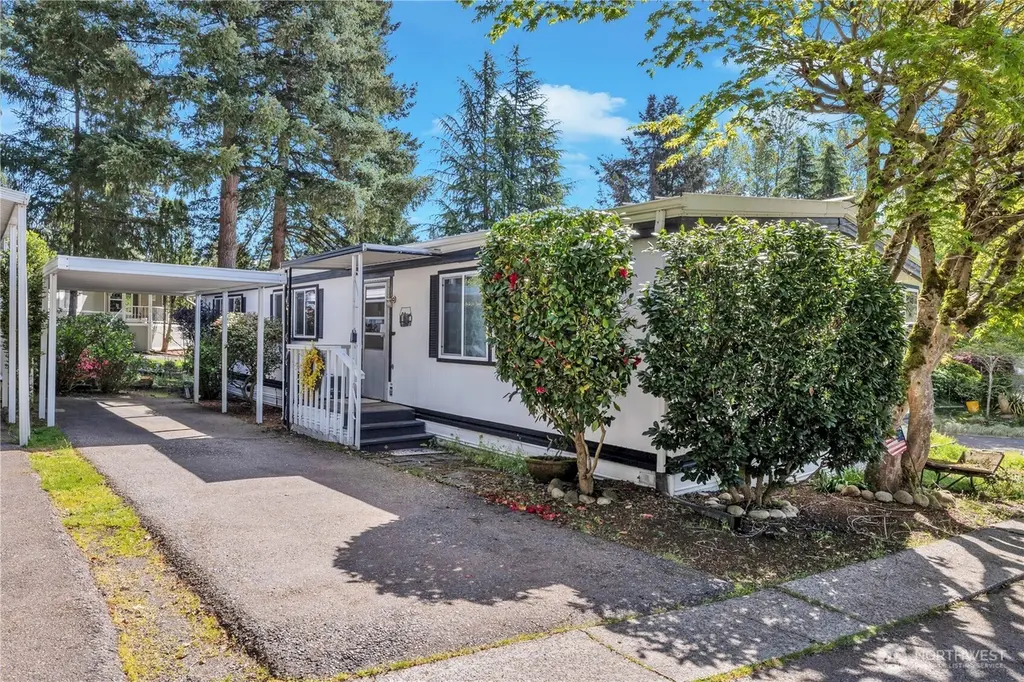
18425 NE 95th St #146 · Redmond, WA
Flood risk No data
- FEMA flood zone
- —
- Chance of flooding over 30 yrs
- —
- Est. flood insurance / yr
- —
Fire risk No data
- Est. fire insurance / yr
- —
Heat risk No data
- Hot days now (above threshold)
- —
- Hot days in 30 yrs
- —
Wind risk No data
- Chance of severe wind over 30 yrs
- —
Air-quality risk No data
- Unhealthy air days now
- —
- Unhealthy air days in 30 yrs
- —
Risk factors via First Street. Map © Google.
Why this score? — see what drove the B- grade
The composite is a weighted blend of 9 inputs, each scored 0–100. Each bar is that input's sub-score; the figure is the points it added to the 100-point composite (weight × sub-score).
- Cash flow +29.4/30.0
- DSCR +10.0/10.0
- 1% rule +8.2/10.0
- Schools +7.5/10.0
- ARV discount +4.9/15.0
- Livability +4.4/5.0
- Rent growth +2.7/5.0
- Condition / age +2.5/5.0
- Appreciation +0.0/10.0
$229,000
🖨 Deal sheet 📄 Offer letter ✓ Due diligence
Listing remarks
Great opportunity to be part of the terrific Friendly Village community of people 55 years old & older. This wonderful updated 2 bedroom mobile home has 1440 square feet. The convenient open floor plan offers a cheerful dining area, large family room, an updated kitchen and a spacious living room with plenty of windows that look out to the mature landscaping of trees, bushes & flowers. The back deck was redone into a larger one. The yard has some raised beds that will be great for growing vegetables or flowers. Friendly Village features a clubhouse with a large rec room, a library, exercise room, pool table & ping pong room & a kitchen. There's a seasonal heated pool
Key facts
- Open floor plan
- Raised beds
- Clubhouse
Tags
Property features AI
Finance
- Other: Calculated living area: 1,440 square feet; Structure type: Manufactured house; Listing status: Active; On market date: May 1, 2026
- Financial info: Listing terms: Cash
- HOA & community: Located in Friendly Village (senior community); 224 homes in the park; Park amenities: clubhouse, common area, community waterfront, exercise room, laundry, pool, recreational area, RV parking, trails; Land lease amount: $860
Exterior
- Parking: Carport
- Utilities: Electric energy source; Public water; City sewer; PSE power; Electric water heater
- Home design: Manufactured double-wide home; One level; Very good condition; Make: Sequa; Manufactured home park approved for sale
- Construction: Metal/vinyl construction materials; Metal roof; Double wide body type
- Exterior features: Metal/vinyl exterior; Patio / porch / deck; Cul-de-sac lot; Paved access
Interior
- Kitchen: Dishwasher; Garbage disposal; Microwave; Refrigerator; Stove / Range
- Bedrooms: 2 bedrooms
- Flooring: Vinyl plank; Carpet
- Bathrooms: 1 full bath; 1 three-quarter bath; 1 bathtub; 1 shower
- Heating & cooling: Forced air heating
- Interior features: Water heater (accessed from outside); Bath off primary; Double pane windows; Patio / porch / deck; Shed in backyard
- Laundry & utility: Washer; Dryer
Neighborhood map
What this means for you Summary
Snapshot
- This is a 2-bed/2.0-bath manufactured listed at $229k.
Deal economics
- At list price, monthly cash flow is $813 ($10k/yr) — positive.
- The deal already cash-flows at list — no discount required.
- Meets the 1% rule at list price ($3k rent vs $229k).
- Recommended offer: $222k (3.0% below list) — sets the bar for market timing.
- Cap rate 10.6% vs local median 1.4% in Redmond — top-decile yield for the area; either an underpriced asset or a hidden risk that comps aren't pricing in. Stress-test before assuming the spread holds.
Location & tenants
- Location reads 88/100 on livability (#10 in WA, #186 nationally) — a professional / high-income tenant draw. Strengths: schools A+, amenities A+, commute A+; Watch: cost of living F.
- Lake Washington School District (suburban): math 79% / reading 85% proficiency, ranked #3 of 291 in WA (top 1%) — strong family-tenant draw, lease renewals of 3-5y typical; only 10% free/reduced lunch — higher-income household profile.
- Market conditions: Rents flat; 333 active listings in the ZIP; 38 comparable units currently listed for rent nearby; rentals leasing fast (median 5d on market — plan ~1-2 weeks tenant-placement turnaround); high-income renter base; 10,555 units permitted in King County in 2024 (7,119 in 5+ unit buildings).
Forward outlook
- Local home prices are declining (-3.0%/yr); year-one equity from $2k of loan paydown is wiped out by about $7k of value loss. Plan a longer hold.
- King County population projected at +44% by 2050 — long-run rental-demand tailwind backs the buy-and-hold thesis.
Negotiation context
- It's been on market 48 days — a 3% lower offer ($222k) is reasonable based on typical stale-listing flexibility.
- 2 sale attempts since 9y ago with the ask held roughly flat each time — persistent listings suggest the price (not the market) is what's stuck; bring a comps-based counter.
- Current owner paid $56k; list at $229k implies a 309% gain — meaningful room to come down on a strong offer.
Questions for the listing agent
- It's been on market 48 days. Have you received any prior offers? Is the seller open to a 3% concession, seller financing, or rate buy-down credit?
- Built in 1974 — when were the roof, HVAC, electrical panel, plumbing, and water heater last replaced?
- Is there a deadline driving the sale (1031 exchange, divorce, estate, relocation)? That informs how much negotiation room exists.
- Schools are A-rated — typically a magnet for longer-tenancy family renters. What's the average tenant stay here, and is there a school-zone premium baked into asking?
- What's the average days-on-market for RENTAL listings here right now (not sales)? A rising rental-DOM trend means longer vacancies and softer asking-rent achievability than the comps imply.
- What's the recent tenant-quality profile in this submarket — average credit score on applications, eviction rate, late-payment / NSF rate, and stable-employment percentage? A property-management company in the area should have these aggregated.
- How much new for-sale + rental construction is in the pipeline within 1–3 miles? Heavy new supply typically softens prices + rents 12–24 months out; constrained supply supports both.
Investment metrics
- 1% rule
- 1.32% ✓
- Cap rate
- 10.55%
- Cash-on-cash
- 15.21%
- DSCR
- 1.68
- GRM
- 6.3
CMA / ARV
- ARV (median comp)
- $216,523
- List price
- $229,000
- Delta
- 5.76%
- Verdict
- FAIR
- Comps
- 6 within 1.0 mi
Show comp detail 8 sales within ~0.75 mi
| Address | Dist | Beds/Ba | Sqft | Sold | Price | $/sf | Match |
|---|---|---|---|---|---|---|---|
| 18425 NE 95th St #161 | 0.00mi | 2/2.0 | 1,440 (0%) | 13mo | $255,000 | $177 | 89 |
| 18425 NE 95th St #43 | 0.00mi | 3/2.0 (+1) | 1,334 (-7%) | 9mo | $257,000 | $193 | 76 |
| 18425 NE 95th St #148 | 0.00mi | 3/2.0 (+1) | 1,344 (-7%) | 11mo | $265,000 | $197 | 75 |
| 18425 NE 95th St #11 | 0.00mi | 3/2.0 (+1) | 1,536 (+7%) | 12mo | $115,000 | $75 | 74 |
| 18425 NE 95th St #76 | 0.08mi | 3/2.0 (+1) | 1,248 (-13%) | 1mo | $175,000 | $140 | 68 |
| 18425 NE 95th St #108 | 0.00mi | 3/2.0 (+1) | 1,344 (-7%) | 19mo | $196,500 | $146 | 68 |
| 18425 NE 95th St #183 | 0.14mi | 3/2.0 (+1) | 1,248 (-13%) | 12mo | $172,450 | $138 | 56 |
| 18425 NE 95th St #199 | 0.00mi | 3/2.0 (+1) | 1,620 (+12%) | 23mo | $325,000 | $201 | 54 |
Match score weights: distance 35% · size 25% · config 20% · recency 20%. Top-matched comps best support the ARV.
Projected returns pro-forma
-3.0% appreciation · 0.65% rent growth · sell at horizon
- IRR
- 3.2%
- Equity multiple
- 1.12×
- Total profit
- $7,710
- Equity at exit
- $34,145
- IRR
- 10.4%
- Equity multiple
- 1.72×
- Total profit
- $46,148
- Equity at exit
- $19,800
Cash invested: $64,120 (down + closing). Projections, not guarantees.
Landlord ↔ Tenant lean methodology
- Overall (STATE)
- 28 Tenant-Leaning
- State Washington
- 28 Tenant-Leaning · D+8
- County
- — inherits STATE
- City
- — inherits STATE
ZIP-level market 98052
- Rents YoY
- 0.7%
- Active inventory
- 333
- Price-to-rent
- 6.3×
Monthly cashflow live
- Estimated rent
- $3,032 high interval (Pro) →
- Mortgage (P&I)
- −$1,201
- Tax est. 1.5%
- −$286 /mo · $3,435/yr
- Insurance
- −$95
- HOA
- −$0
- Vacancy / Maint / Mgmt
- −$637
- Net cashflow
- $813
Break-even live
UW: 25.0% down · 7.5% · 30yr · 1.5% tax · 5.0% vac · 8.0% maint · 8.0% mgmt
Financing live
Cash to close
- Down payment
- $57,250
- Closing costs
- $6,870
- Reserves months
- —
- Total cash needed
- —
Loan-product check · same deal, 3 products live
Conventional
25% down · 7.5% · 30yr
- Down + closing
- —
- Monthly P&I
- —
- Monthly cashflow
- —
- DSCR
- —
- Eligible?
- —
Personal DTI + credit; lowest rate.
DSCR
20% down · 8.5% · 30yr
- Down + closing
- —
- Monthly P&I
- —
- Monthly cashflow
- —
- DSCR
- —
- Eligible?
- —
No personal income docs; deal must DSCR.
Hard money
10% down · 12.0% · 12mo
- Down + closing
- —
- Monthly P&I
- —
- Monthly cashflow
- —
- DSCR
- —
- Eligible?
- —
Short-term bridge; refi at stabilization.
Rent comps 38 comps
| Address | Beds | Baths | Sqft | Rent | $/sqft | DOM | Units | Dist |
|---|---|---|---|---|---|---|---|---|
| 9056 Avondale Rd NE Redmond, WA | 3.0 | 1.0 | 1500 | $3,400 | $2.27 | 5d | 1 | 0.22mi |
| 9981 Avondale Rd NE Redmond, WA | 2.0 | 2.5 | 1280 | $2,900 | $2.27 | 43d | 1 | 0.39mi |
| 9009 Avondale Rd NE Unit K122 Redmond, WA | 2.0 | 2.0 | 958 | $2,800 | $2.92 | 24d | 1 | 0.42mi |
| 9009 Avondale Rd NE Redmond, WA | 2.0 | 2.0 | 1026 | $2,672 | $2.60 | 43d | 2 | 0.47mi |
| 17771 NE 90th St Redmond, WA | 1.0–3.0 | 1.0–2.0 | 1062 | $2,908 | $2.74 | 2d | 13 | 0.53mi |
| 17633 NE 88th Pl Redmond, WA | 3.0 | 1.5 | 1530 | $3,100 | $2.03 | 20d | 1 | 0.56mi |
| 8653 Avondale Rd NE Unit B204 Redmond, WA | 3.0 | 2.0 | 1164 | $3,150 | $2.71 | 43d | 1 | 0.56mi |
| 17202 NE 85th Pl Redmond, WA | 2.0 | 1.0–2.0 | 891 | $2,388 | $2.68 | 1d | 4 | 0.71mi |
| 17634 NE Union Hill Rd Redmond, WA | 1.0–2.0 | 1.0–2.0 | 822 | $2,987 | $3.63 | 2d | 6 | 0.72mi |
| 10909 Avondale Rd NE Unit P161 Redmond, WA | 3.0 | 2.5 | 1487 | $3,600 | $2.42 | 18d | 1 | 1.01mi |
| 7805 170th Pl NE Redmond, WA | 2.0 | 1.0–2.0 | 789 | $2,612 | $3.31 | 5d | 4 | 1.17mi |
| 17620 NE 69th Ct Redmond, WA | 1.0–3.0 | 1.0–2.0 | 994 | $3,474 | $3.49 | 5d | 20 | 1.25mi |
| 16518 NE 91st St Redmond, WA | 1.0–2.0 | 1.0 | 900 | $2,725 | $3.03 | 5d | 8 | 1.26mi |
| 16405 NE 95th St Redmond, WA | 1.0–2.0 | 1.0–1.5 | 940 | $2,400 | $2.55 | 43d | 4 | 1.30mi |
| 11305 183rd Pl NE Redmond, WA | 3.0 | 1.0–3.0 | 1211 | $3,527 | $2.91 | 1d | 1 | 1.31mi |
| 16590 NE 83rd St Redmond, WA | 2.0 | 1.0–2.0 | 769 | $3,295 | $4.28 | 10d | 3 | 1.32mi |
| 16771 Redmond Way Redmond, WA | 3.0 | 1.0–2.0 | 928 | $3,983 | $4.29 | 2d | 272 | 1.34mi |
| 6503 188th Pl NE #103 Redmond, WA | 3.0 | 2.5 | 1606 | $3,700 | $2.30 | 15d | 1 | 1.34mi |
| 8704 164th Ave NE Redmond, WA | 2.0 | 1.0 | 950 | $1,135 | $1.19 | 43d | 1 | 1.35mi |
| 16550 NE 79th St Redmond, WA | 1.0–2.0 | 1.0–2.0 | 818 | $3,383 | $4.13 | 3d | 3 | 1.37mi |
| 8920 Redmond Woodinville Rd NE Unit 8952 Redmond, WA | 2.0 | 1.0 | 875 | $1,885 | $2.15 | 5d | 1 | 1.38mi |
| 17565 NE 67th Ct Redmond, WA | 1.0–2.0 | 1.0–2.0 | 850 | $4,444 | $5.23 | 5d | 9 | 1.39mi |
| 8280 164th Ave NE Redmond, WA | 2.0 | 1.0–2.0 | 828 | $3,807 | $4.60 | 2d | 10 | 1.39mi |
| 6332 E Lake Sammamish Pkwy NE Redmond, WA | 1.0–3.0 | 1.0–2.0 | 1079 | $3,009 | $2.79 | 2d | 13 | 1.39mi |
| 16595 Redmond Way Redmond, WA | 2.0 | 1.0–2.0 | 814 | $4,487 | $5.51 | 2d | 29 | 1.40mi |
| 9110 Woodinville Redmond Rd NE Unit PM-UF-RED9110_302 Redmond, WA | 2.0 | 1.0 | 925 | $2,375 | $2.57 | 5d | 1 | 1.40mi |
| 9200 Woodinville Redmond Rd NE Unit D 326 Redmond, WA | 2.0 | 2.5 | 1330 | $2,995 | $2.25 | 43d | 1 | 1.41mi |
| 7405 168th Ave NE Redmond, WA | 2.0 | 1.0–2.0 | 984 | $4,293 | $4.36 | 4d | 8 | 1.41mi |
| 16502 Cleveland St Redmond, WA | 3.0 | 1.0–2.0 | 899 | $4,234 | $4.71 | 2d | 48 | 1.42mi |
| 6205 188th Ln NE Redmond, WA | 1.0–3.0 | 1.0–2.0 | 1042 | $3,090 | $2.97 | 2d | 11 | 1.44mi |
| 16275 NE 85th St #313 Redmond, WA | 2.0 | 2.0 | 983 | $3,095 | $3.15 | 22d | 1 | 1.44mi |
| 16255 NE 87th St Redmond, WA | 3.0 | 1.0–2.0 | 776 | $2,285 | $2.95 | 3d | 8 | 1.45mi |
| 16340 NE 83rd St Redmond, WA | 1.0–2.0 | 1.0–2.0 | 1134 | $3,141 | $2.77 | 2d | 4 | 1.45mi |
| 10509 165th Pl NE Unit 1545767P Redmond, WA | 2.0 | 2.0 | 990 | $6,032 | $6.09 | 15d | 1 | 1.46mi |
| 6335 180th Pl NE Redmond, WA | 2.0 | 1.0–2.0 | 775 | $3,475 | $4.48 | 2d | 8 | 1.46mi |
| 17305 NE 67th Ct Redmond, WA | 1.0–2.0 | 1.0–2.0 | 858 | $4,290 | $5.00 | 5d | 15 | 1.47mi |
| 16135 NE 85th St Redmond, WA | 2.0 | 1.0–2.0 | 764 | $4,338 | $5.68 | 2d | 48 | 1.49mi |
| 7535 206th Pl NE Redmond, WA | 3.0 | 1.5 | 1240 | $3,750 | $3.02 | 18d | 1 | 1.50mi |
Listing history 19 events
-
2026-06-18days on market $229,000 Active 48 DOM
-
2026-06-17days on market $229,000 Active 47 DOM
-
2026-06-16days on market $229,000 Active 46 DOM
-
2026-06-15days on market $229,000 Active 45 DOM
-
2026-06-13days on market $229,000 Active 43 DOM
-
2026-06-09days on market $229,000 Active 39 DOM
-
2026-06-08days on market $229,000 Active 38 DOM
-
2026-06-07days on market $229,000 Active 37 DOM
-
2026-06-04days on market $229,000 Active 34 DOM
-
2026-06-03days on market $229,000 Active 33 DOM
-
2026-06-02days on market $229,000 Active 32 DOM
-
2026-06-01days on market $229,000 Active 31 DOM
-
2026-05-31days on market $229,000 Active 30 DOM
-
2026-05-01$229,000 Active
-
2017-05-02soldstatus $56,000 Sold
-
2017-04-11status Pending
-
2017-03-24status Pending Inspection
-
2017-03-22price $57,000
-
2017-02-06$59,000 Active
ⓘ Source: listings_history table (triggers on properties + properties_extension) + one-shot
backfill from property_details.listing_events for pre-trigger history.
Nearby sold comps map
Loading sold comps map…
Walkable amenities ~0.75 mi
Loading nearby amenities…
Taxation est. · year 1
- Rental income
- $36,388
- − Mortgage interest
- −$12,828
- − Property taxes
- −$3,435
- − Insurance
- −$1,145
- − Repairs & maintenance
- −$2,911
- − Management
- −$2,911
- − Depreciation
- −$6,662
- Taxable income
- $6,496
- Est. tax owed @ 24.0%
- −$1,559
- After-tax cash flow
- $8,196/yr
For passive investors: Depreciation is non-cash, so a rental often shows a tax loss while cash-flowing — sheltering income. Rental losses are passive: they offset passive income freely, and up to $25,000/yr can offset ordinary (W-2) income if you actively participate and your MAGI is under $100k (phasing out to $0 by $150k); unused losses carry forward. On sale, claimed depreciation is recaptured at up to 25%, and gains may owe capital-gains tax (a 1031 exchange can defer both). Figures are a year-1 estimate at your 24.0% rate — not tax advice; consult a CPA.
Schools (NCES district)
- District
- Lake Washington School District
- NCES district ID
- 5304230
- Math proficiency
- 79% ▬ 0.00%
- Reading proficiency
- 85% ▲ 1.00%
- Median HH income
- $103,849
- Composite
- 75.15/100
- National rank
- #251
- State rank
- #3 of 291 in WA
Livability — Redmond
- Score
- 88/100
- State rank
- #10
- US rank
- #186
Category grades
Schools grade is shown separately in the Schools card above.
Census & demographics
- Census place
- Redmond, WA
- County
- King County · 2,251,916 people
- City population
- 103,482
- Metro
- Seattle-Tacoma-Bellevue, WA
- Population (ZIP)
- 80,717
- Household income
- $163,460
- Rent vs Own
- Severe rent burden
- 3044.0
Population outlook (King County) Hauer SSP2
- Today (2025)
- 2,576,485 people
- By 2030
- 2,803,316 · +8.8%
- By 2040
- 3,255,921 · +26.4%
- By 2050
- 3,706,444 · +43.9%
- By 2075
- 4,746,063 · +84.2%
- By 2100
- 5,407,730 · +109.9%
Race, ethnicity, and origin ACS 2023
- Neighborhood character
- Diverse neighborhood (Simpson 0.62)
- Race & ethnicity
- White 47% Asian 38% Two or more races 7% Hispanic / Latino 7% Black 2%
- Hispanic origin (detail)
- Mexican 5%
- Common ancestry
- Portuguese 2% Italian 2% Scotch-Irish 2%
- Foreign-born
- 44% · China, Canada, South Korea
- Languages at home
- 53% English-only · Other Asian/Pacific 11% Chinese 10% Other Indo-European 10%
Political lean MEDSL · King
- 2024 margin
- Solid D (+51.7) · D 74.2% · R 22.5% · Other 3.4%
- 2008→2024 swing
- +9.6pp toward D · 2008: 42.1pp · 2024: 51.7pp
- All cycles
- 2024: D+51.7 2020: D+52.7 2016: D+50.4 2012: D+39.9 2008: D+42.1
Not yet ingested
- Civics
- —
Market trends
- HPI YoY
- ▼ -1157.66%
- Current HPI
- 434.1949
- Rent YoY
- ▲ 0.65%
- Metro
- Seattle-Tacoma-Bellevue, WA
- State GDP YoY
- ▲ 4.65%
- F500 in state
- 22
Industry mix (Fortune 500 HQ in WA)
| Industry | F500 HQs | Revenue |
|---|---|---|
| Retail | 2 | $269B |
|
||
| Technology / Retail | 1 | $638B |
|
||
| Technology | 1 | $245B |
|
||
| Telecommunications | 1 | $38B |
|
||
| Food / Beverage | 1 | $36B |
|
||
| Automotive / Trucks | 1 | $34B |
|
||
Price history
+288.1% since first listed6 events — show timeline
- 2026-05-01 Listed $229,000 NWMLS as Distributed by MLS Grid
- 2017-05-02 Sold (MLS) $56,000 NWMLS as Distributed by MLS Grid
- 2017-04-11 Pending — NWMLS as Distributed by MLS Grid
- 2017-03-24 Pending — NWMLS as Distributed by MLS Grid
- 2017-03-22 Price Changed $57,000 NWMLS as Distributed by MLS Grid
- 2017-02-06 Listed $59,000 NWMLS as Distributed by MLS Grid
Cash-flow waterfall
monthlySold comps — $/sqft
last 12 mo · ≤1 miLoading sold comps…