501 Cheshire Dr · Gulfport, MS
Flood risk 6/10 · Moderate
- FEMA flood zone
- X (unshaded)
- Chance of flooding over 30 yrs
- 0.71%
- Est. flood insurance / yr
- $507 – $1,088
Fire risk 1/10 · Minimal
- Est. fire insurance / yr
- $1,241 – $2,305
Heat risk 10/10 · Severe
- Hot days now (above 106°F)
- 7 days/yr
- Hot days in 30 yrs
- 23 days/yr
Wind risk 9/10 · Severe
- Chance of severe wind over 30 yrs
- 99.0%
Air-quality risk 3/10 · Minor
- Unhealthy air days now
- 2 days/yr
- Unhealthy air days in 30 yrs
- 3 days/yr
Risk factors via First Street. Map © Google.
Why this score? — see what drove the B+ grade
The composite is a weighted blend of 9 inputs, each scored 0–100. Each bar is that input's sub-score; the figure is the points it added to the 100-point composite (weight × sub-score).
- Cash flow +30.0/30.0
- ARV discount +15.0/15.0
- DSCR +10.0/10.0
- 1% rule +7.3/10.0
- Livability +3.7/5.0
- Rent growth +3.6/5.0
- Schools +3.4/10.0
- Condition / age +2.5/5.0
- Appreciation +0.0/10.0
$149,900
🖨 Deal sheet (PDF) 📄 Offer letter ✓ Due diligence
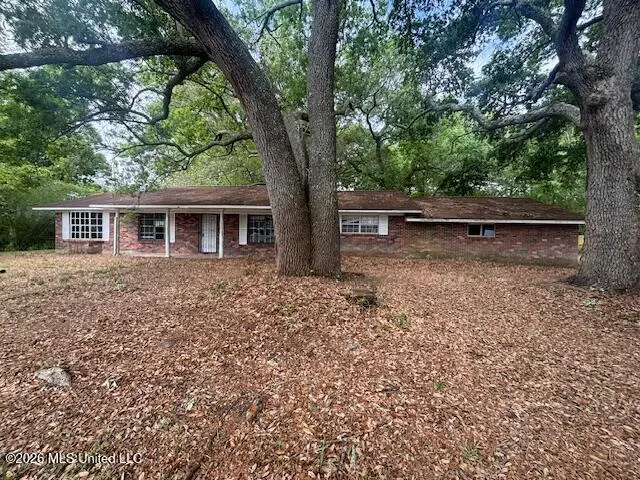
Listing remarks
Spacious 3 bedroom, 2 bath home situated on almost half an acre with beautiful mature live oak trees providing plenty of shade and character. Features include an eat-in kitchen, interior laundry room, and a functional layout with great potential. Large yard offers room to enjoy outdoor living, gardening, or additional storage. Conveniently located with easy access to local amenities. Home is in need of updates and repairs, making it a great opportunity for investors or buyers looking to add their own personal touch
Key facts
- Large yard
- Eat-in kitchen
- Functional layout
Tags
Property features AI
Exterior
- Parking: 2 total parking spaces; 2-car garage that faces the side
- Utilities: Public water; Public sewer; Utilities: see remarks
- Home design: Single-family house; One level; Fixer condition
- Construction: Brick construction; Shingle roof; Slab foundation; Built (year from assessor)
- Exterior features: Patio/porch: other; Back yard with chain link fencing; See remarks for additional exterior details; Many trees on the lot
Interior
- Flooring: Combination flooring
- Bathrooms: 1 full bathroom; 1.75 total bathrooms (2 total)
- Heating & cooling: Central heating; Central air conditioning
- Interior features: Combination flooring; Other appliances (see remarks)
- Laundry & utility: Indoor laundry room
Neighborhood map
What this means for you Summary
Snapshot
- This is a 3-bed/2.0-bath single-family listed at $150k.
Deal economics
- At list price, monthly cash flow is $581 ($7k/yr) — positive.
- The deal already cash-flows at list — no discount required.
- Meets the 1% rule at list price ($2k rent vs $150k).
- Recommended offer: $148k (1.5% below list) — sets the bar for market timing.
- Cap rate 10.9% vs local median 4.9% in Gulfport — top-decile yield for the area; either an underpriced asset or a hidden risk that comps aren't pricing in. Stress-test before assuming the spread holds.
Location & tenants
- Location reads 73/100 on livability (#15 in MS) — a middle-class / working-renter tenant base. Strengths: cost of living A+, housing A+, health & safety A+; Watch: amenities F, commute F, employment F.
- Gulfport School District (urban): math 41% / reading 42% proficiency, ranked #37 of 130 in MS (top 28%) — families likely to look elsewhere, expect single-tenant / working-renter base with shorter leases; 67% free/reduced lunch — lower-income household profile, screen leases tightly.
- Zoned schools: Pass Road Elementary School (math 32% / reading 42%, grade F, #135 of 375 statewide, top 39%, 398 students, 100% FRL); Bayou View Middle School (math 54% / reading 49%, grade C, #27 of 179 statewide, top 16%, 826 students, 100% FRL); Gulfport High School (math 42% / reading 36%, grade F, #54 of 197 statewide, top 28%, 1,728 students, 100% FRL) — zoned schools average 100% FRL vs 67% district-wide (33 pts higher); higher-poverty schools than district average — tighter screening recommended.
- Market conditions: Rents rising fast (+4.3%/yr); 301 active listings in the ZIP; 20 comparable units currently listed for rent nearby; rentals lingering (median 45d on market — plan ~5-8 weeks vacancy on turnover, expect pricing pressure); 50% of comp listings sitting > 30 days — soft ceiling on asking rent; 2,194 units permitted in Harrison County in 2024 (0 in 5+ unit buildings).
- This rent runs 40% of the median local income ($55k/yr) — at the standard rent-burdened threshold; future hikes will face affordability resistance.
Forward outlook
- Local home prices are declining (-3.0%/yr); year-one equity from $1k of loan paydown is wiped out by about $4k of value loss. Plan a longer hold.
- Harrison County population projected at +27% by 2050 — long-run rental-demand tailwind backs the buy-and-hold thesis.
- At projected returns (-3.0% appreciation + 4.3% rent growth), your $42k cash investment doubles in ~7 years — after that, you're playing with house money.
Negotiation context
- It's been on market 29 days — a 2% lower offer ($148k) is reasonable based on typical stale-listing flexibility.
Risks & watch-outs
- Climate carrying-cost: major flood risk; severe wind risk, 99% chance of damaging wind over 30y; extreme-heat days projected 7→23/yr by 2055 (HVAC capex compounding) — expect insurance premiums to compound above CPI over the hold.
Questions for the listing agent
- Built in 1974 — when were the roof, HVAC, electrical panel, plumbing, and water heater last replaced?
- Is there a deadline driving the sale (1031 exchange, divorce, estate, relocation)? That informs how much negotiation room exists.
- Schools are D-rated, which usually means shorter tenancies and higher turnover. Who's the typical renter profile here, and what's been the actual vacancy rate?
- What's the average days-on-market for RENTAL listings here right now (not sales)? A rising rental-DOM trend means longer vacancies and softer asking-rent achievability than the comps imply.
- What's the recent tenant-quality profile in this submarket — average credit score on applications, eviction rate, late-payment / NSF rate, and stable-employment percentage? A property-management company in the area should have these aggregated.
- How much new for-sale + rental construction is in the pipeline within 1–3 miles? Heavy new supply typically softens prices + rents 12–24 months out; constrained supply supports both.
Investment metrics
- 1% rule
- 1.23% ✓
- Cap rate
- 10.94%
- Cash-on-cash
- 16.61%
- DSCR
- 1.74
- GRM
- 6.8
CMA / ARV
- ARV (on-the-fly)
- $293,607
- Comps found
- 12
Show comp detail 12 sales within ~0.75 mi
| Address | Dist | Beds/Ba | Sqft | Sold | Price | $/sf | Match |
|---|---|---|---|---|---|---|---|
| 22 E Park St | 0.47mi | 4/2.0 (+1) | 1,650 (-4%) | 4mo | $184,900 | $112 | 63 |
| 400 Krill Ct | 0.70mi | 3/2.0 | 1,765 (+3%) | 2mo | $305,361 | $173 | 61 |
| 1316 Redfish Dr | 0.67mi | 3/2.0 | 1,765 (+3%) | 5mo | $301,434 | $171 | 60 |
| 1061 Flounder Way | 0.61mi | 3/2.0 | 1,845 (+8%) | 2mo | $315,406 | $171 | 57 |
| 1373 Redfish Dr | 0.61mi | 3/2.0 | 1,845 (+8%) | 4mo | $314,004 | $170 | 56 |
| 1311 Redfish Dr | 0.61mi | 3/2.0 | 1,561 (-9%) | 1mo | $291,620 | $187 | 56 |
| 1312 Redfish Dr | 0.62mi | 3/2.0 | 1,845 (+8%) | 4mo | $309,650 | $168 | 55 |
| 1057 Flounder Way | 0.61mi | 3/2.0 | 1,561 (-9%) | 3mo | $293,695 | $188 | 54 |
| 23 39th St | 0.74mi | 3/2.0 | 1,550 (-10%) | 3mo | $239,500 | $155 | 46 |
| 21 E Park St | 0.47mi | 4/1.0 (+1) | 1,481 (-14%) | 2mo | $149,900 | $101 | 45 |
| 155 Phillips Dr | 0.63mi | 3/2.0 | 1,971 (+15%) | 2mo | $589,500 | $299 | 44 |
| 463 Oak Grove Ave | 0.74mi | 3/2.0 | 1,488 (-13%) | 3mo | $176,000 | $118 | 41 |
Match score weights: distance 35% · size 25% · config 20% · recency 20%. Top-matched comps best support the ARV.
Projected returns pro-forma
-3.0% appreciation · 4.26% rent growth · sell at horizon
- IRR
- 9.0%
- Equity multiple
- 1.36×
- Total profit
- $14,992
- Equity at exit
- $22,351
- IRR
- 19.1%
- Equity multiple
- 2.68×
- Total profit
- $70,344
- Equity at exit
- $12,961
Cash invested: $41,972 (down + closing). Projections, not guarantees.
Landlord ↔ Tenant lean methodology
- Overall (STATE)
- 90 Strongly Landlord-Friendly
- State Mississippi
- 90 Strongly Landlord-Friendly · R+11
- County
- — inherits STATE
- City
- — inherits STATE
ZIP-level market 39507
- Home prices YoY
- -27.1%
- Rents YoY
- 4.3%
- Active inventory
- 301
- Price-to-rent
- 6.8×
Monthly cashflow live
- Estimated rent
- $1,841 high interval (Pro) →
- Mortgage (P&I)
- −$786
- Tax from tax record
- −$25 /mo · $300/yr
- Insurance
- −$62
- HOA
- −$0
- Vacancy / Maint / Mgmt
- −$387
- Net cashflow
- $581
Break-even live
Sensitivity live
| Price | -10% $666 | -5% $623 | +0% $581 | +5% $367 | +10% $315 |
|---|---|---|---|---|---|
| Rent | -10% $435 | -5% $508 | +0% $581 | +5% $654 | +10% $726 |
| Rate | -1.0pp $656 | -0.5pp $619 | base $581 | +0.5pp $542 | +1.0pp $502 |
UW: 25.0% down · 7.5% · 30yr · 1.5% tax · 5.0% vac · 8.0% maint · 8.0% mgmt
Financing live
Cash to close
- Down payment
- $37,475
- Closing costs
- $4,497
- Reserves months
- —
- Total cash needed
- —
Loan-product check · same deal, 3 products live
Conventional
25% down · 7.5% · 30yr
- Down + closing
- —
- Monthly P&I
- —
- Monthly cashflow
- —
- DSCR
- —
- Eligible?
- —
Personal DTI + credit; lowest rate.
DSCR
20% down · 8.5% · 30yr
- Down + closing
- —
- Monthly P&I
- —
- Monthly cashflow
- —
- DSCR
- —
- Eligible?
- —
No personal income docs; deal must DSCR.
Hard money
10% down · 12.0% · 12mo
- Down + closing
- —
- Monthly P&I
- —
- Monthly cashflow
- —
- DSCR
- —
- Eligible?
- —
Short-term bridge; refi at stabilization.
Rent comps 20 comps
| Address | Beds | Baths | Sqft | Rent | $/sqft | DOM | Units | Dist |
|---|---|---|---|---|---|---|---|---|
| 477 Tegarden Rd Unit D Gulfport, MS | 3.0 | 2.0 | 1300 | $1,300 | $1.00 | 15d | 1 | 0.13mi |
| 1229 Century Oaks Dr Gulfport, MS | 3.0 | 3.0 | 1200 | $2,600 | $2.17 | 22d | 1 | 0.62mi |
| 153 Markham Dr Gulfport, MS | 3.0 | 2.0 | 1650 | $3,000 | $1.82 | 45d | 1 | 0.66mi |
| 1131 Century Oaks Dr Gulfport, MS | 3.0 | 3.0 | 1156 | $1,800 | $1.56 | 45d | 1 | 0.66mi |
| 1270 Century Oaks Dr Gulfport, MS | 3.0 | 3.0 | 1158 | $1,950 | $1.68 | 45d | 1 | 0.67mi |
| 980 Courthouse Rd Unit 1605 Gulfport, MS | 2.0 | 2.0 | 1227 | $1,355 | $1.10 | 22d | 1 | 0.67mi |
| 1101 Century Oaks Dr Gulfport, MS | 3.0 | 3.0 | 1330 | $1,700 | $1.28 | 45d | 1 | 0.68mi |
| 1276 Century Oaks Dr Gulfport, MS | 3.0 | 3.0 | 1283 | $2,100 | $1.64 | 45d | 1 | 0.69mi |
| 1100 Century Oaks Dr Unit A Gulfport, MS | 3.0 | 3.0 | 1156 | $2,200 | $1.90 | 45d | 1 | 0.70mi |
| 3503 Hancock Ave Gulfport, MS | 2.0 | 2.5 | 1100 | $1,100 | $1.00 | 22d | 1 | 0.71mi |
| 954 Old Towne St Gulfport, MS | 3.0 | 2.0 | 1533 | $1,900 | $1.24 | 15d | 1 | 0.72mi |
| 1215 Ocean View Dr Gulfport, MS | 3.0 | 2.0 | 1710 | $2,895 | $1.69 | 22d | 1 | 0.74mi |
| 1114 Washington Ave Gulfport, MS | 3.0 | 2.0 | 1200 | $1,350 | $1.12 | 22d | 1 | 0.85mi |
| 408 Caribe Pl N Gulfport, MS | 3.0 | 2.5 | 2158 | $2,700 | $1.25 | 45d | 1 | 0.92mi |
| 1400 Mill Rd Gulfport, MS | 2.0 | 2.5 | 1290 | $2,550 | $1.98 | 45d | 1 | 0.97mi |
| 1525 E Pass Rd Gulfport, MS | 1.0–3.0 | 1.0–2.0 | 1070 | $1,519 | $1.42 | 22d | 1 | 0.99mi |
| 1100 Snapper CT Gulfport, MS | 3.0 | 2.5 | 1553 | $1,775 | $1.14 | 22d | 1 | 1.04mi |
| 1618 Courthouse Rd Gulfport, MS | 3.0 | 1.0 | 1168 | $1,400 | $1.20 | 45d | 1 | 1.36mi |
| 4801 Jefferson Ave Gulfport, MS | 3.0 | 2.0 | 1072 | $1,800 | $1.68 | 22d | 1 | 1.42mi |
| 1339 Foxwood Pl Gulfport, MS | 3.0 | 2.0 | 1100 | $1,375 | $1.25 | 45d | 1 | 1.46mi |
Listing history 16 events
-
2026-06-18days on market $149,900 Active 29 DOM
-
2026-06-17days on market $149,900 Active 28 DOM
-
2026-06-16days on market $149,900 Active 27 DOM
-
2026-06-15days on market $149,900 Active 26 DOM
-
2026-06-14days on market $149,900 Active 24 DOM
-
2026-06-13days on market $149,900 Active 23 DOM
-
2026-06-10days on market $149,900 Active 21 DOM
-
2026-06-09days on market $149,900 Active 20 DOM
-
2026-06-08days on market $149,900 Active 19 DOM
-
2026-06-07days on market $149,900 Active 18 DOM
-
2026-06-05days on market $149,900 Active 15 DOM
-
2026-06-02days on market $149,900 Active 13 DOM
-
2026-06-01days on market $149,900 Active 12 DOM
-
2026-05-31days on market $149,900 Active 11 DOM
-
2026-05-30days on market $149,900 Active 10 DOM
-
2026-05-20$149,900 Active
ⓘ Source: listings_history table (triggers on properties + properties_extension) + one-shot
backfill from property_details.listing_events for pre-trigger history.
Tax reassessment forecast MS · Resets to sale price
- Current annual tax
- $300 · $25/mo
- Projected year-2 tax
- $1,184 · $99/mo
- Expected delta
- +$884/yr (+$74/mo · 294.5%)
ⓘ Screening estimate from a state-policy table — verify with the county assessor before closing.
Climate risk First Street
- Flood 6/10 Major FEMA zone X (unshaded) · 71% chance over 30 yrs
- Wildfire 1/10 Low
- Heat 10/10 Extreme 7 d/yr ≥106°F today · 23 d/yr by 30 yrs out
- Wind 9/10 Extreme 99% chance of damaging wind over 30 yrs
- Air quality 3/10 Moderate 2 unhealthy d/yr today · 3 by 30 yrs out
Nearby sold comps map
Loading sold comps map…
Walkable amenities ~0.75 mi
Loading nearby amenities…
Taxation est. · year 1
- Rental income
- $22,092
- − Mortgage interest
- −$8,397
- − Property taxes
- −$300
- − Insurance
- −$750
- − Repairs & maintenance
- −$1,767
- − Management
- −$1,767
- − Depreciation
- −$4,361
- Taxable income
- $4,750
- Est. tax owed @ 24.0%
- −$1,140
- After-tax cash flow
- $5,830/yr
For passive investors: Depreciation is non-cash, so a rental often shows a tax loss while cash-flowing — sheltering income. Rental losses are passive: they offset passive income freely, and up to $25,000/yr can offset ordinary (W-2) income if you actively participate and your MAGI is under $100k (phasing out to $0 by $150k); unused losses carry forward. On sale, claimed depreciation is recaptured at up to 25%, and gains may owe capital-gains tax (a 1031 exchange can defer both). Figures are a year-1 estimate at your 24.0% rate — not tax advice; consult a CPA.
Schools (NCES district)
- District
- Gulfport School District
- NCES district ID
- 2801710
- Math proficiency
- 41% ▼ -15.00%
- Reading proficiency
- 42% ▼ -6.00%
- Median HH income
- $35,712
- Composite
- 34.38/100
- National rank
- #5213
- State rank
- #37 of 130 in MS
Livability — Gulfport
- Score
- 73/100
- State rank
- #15
- US rank
- #5010
Category grades
Schools grade is shown separately in the Schools card above.
Census & demographics
- Census place
- Gulfport, MS
- County
- Harrison County · 178,171 people
- City population
- 96,188
- Metro
- Gulfport-Biloxi, MS
- Population (ZIP)
- 18,564
- Household income
- $54,657
- Rent vs Own
- Severe rent burden
- 1059.0
Population outlook (Harrison County) Hauer SSP2
- Today (2025)
- 228,444 people
- By 2030
- 241,942 · +5.9%
- By 2040
- 267,531 · +17.1%
- By 2050
- 291,062 · +27.4%
- By 2075
- 346,711 · +51.8%
- By 2100
- 378,165 · +65.5%
Race, ethnicity, and origin ACS 2023
- Neighborhood character
- Majority White (65%)
- Race & ethnicity
- White 65% Black 24% Hispanic / Latino 6% Two or more races 5% Asian 1%
- Hispanic origin (detail)
- Mexican 2% Cuban 1%
- Common ancestry
- Slovak 4% Lithuanian 4% Romanian 2%
- Foreign-born
- 4% · Canada
- Languages at home
- 94% English-only · Spanish 2% French/Haitian/Cajun 2% Other Indo-European 1%
Political lean MEDSL · Harrison
- 2024 margin
- Strong R (+28.9) · D 35.0% · R 63.9% · Other 1.1%
- 2008→2024 swing
- -2.9pp toward R · 2008: -26.0pp · 2024: -28.9pp
- All cycles
- 2024: R+28.9 2020: R+25.2 2016: R+30.7 2012: R+26.6 2008: R+26.0
Not yet ingested
- Civics
- —
Market trends
- HPI YoY
- ▼ -67.48%
- Current HPI
- 181.6606
- Rent YoY
- ▲ 4.26%
- Metro
- Gulfport-Biloxi, MS
- State GDP YoY
- —
- F500 in state
- 0
Price history
1 event — show timeline
- 2026-05-20 Listed $149,900 MLSU
Property tax history
-2.4%/yrLatest (2025): $300 · -0.0% YoY. Source: county tax records.
Cash-flow waterfall
monthlySold comps — $/sqft
last 12 mo · ≤1 miLoading sold comps…