 Duplex
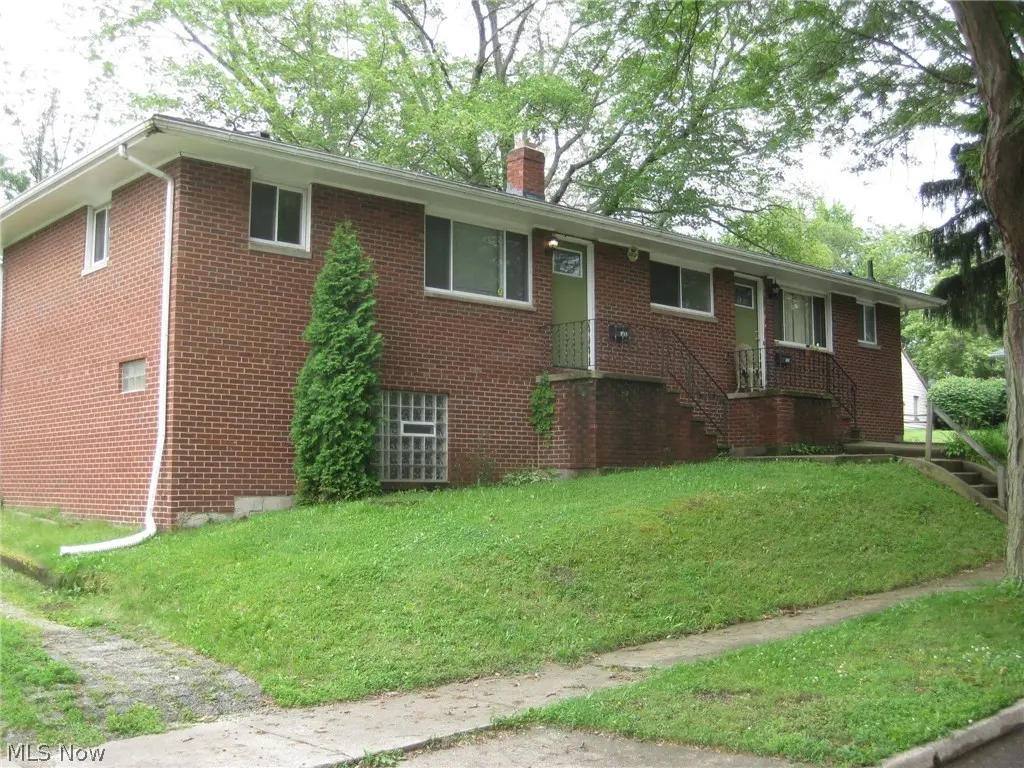
1923-1925 Evergreen Ave · Akron, OH
Flood risk 1/10 · Minimal
- FEMA flood zone
- X (unshaded)
- Chance of flooding over 30 yrs
- 0.0%
- Est. flood insurance / yr
- $473 – $860
Fire risk 1/10 · Minimal
- Est. fire insurance / yr
- $713 – $1,323
Heat risk 3/10 · Minor
- Hot days now (above 96°F)
- 7 days/yr
- Hot days in 30 yrs
- 17 days/yr
Wind risk 1/10 · Minimal
- Chance of severe wind over 30 yrs
- —
Air-quality risk 2/10 · Minimal
- Unhealthy air days now
- 1 days/yr
- Unhealthy air days in 30 yrs
- 2 days/yr
Risk factors via First Street. Map © Google.
Why this score? — see what drove the D+ grade
The composite is a weighted blend of 9 inputs, each scored 0–100. Each bar is that input's sub-score; the figure is the points it added to the 100-point composite (weight × sub-score).
- Cash flow +19.7/30.0
- DSCR +6.3/10.0
- 1% rule +5.4/10.0
- ARV discount +5.1/15.0
- Livability +4.0/5.0
- Rent growth +3.7/5.0
- Condition / age +2.5/5.0
- Schools +2.1/10.0
- Appreciation +0.0/10.0
$199,900
🖨 Deal sheet (PDF) 📄 Offer letter ✓ Due diligence
Multi-family units
County records classify this as Multi-Family (2-4 Unit). Listing-text estimate: 2 units. confirmed
Listing remarks MLS
Nice 4 bedroom/ 2 bath brick duplex on quiet street near all ammenities. This home would make a great investment property with oversized bedrooms and nice layout. Proof of funds with all offers. Buyer responsible for any inspections and repairs needed. This a Fannie Mae Homepath property. Purchase this home for a little as 3 % down. This home is approved for Renovation Mortgage Financing. Call agent for details. Fannie mae will sell owner occupied for the first 15 days
Key facts
- Open floor plan
- Brick duplex
- Two units
Tags
Property features AI
Finance
- Other: Above-grade finished area approximately 1,568; One building on the lot
- Financial info: Owner pays exterior maintenance, grounds care, management, and repairs; Tenant pays electricity, gas, snow removal, sewer, trash collection, and water
Exterior
- Parking: Driveway (gravel, unpaved); Off-street and on-street parking; outside parking available
- Security: Carbon monoxide detector(s); Smoke detector(s)
- Utilities: Public water; Public sewer
- Home design: Single-story property
- Construction: Brick construction; Asphalt/fiberglass roof
- Exterior features: City lot
Interior
- Kitchen: Range; Refrigerator
- Bathrooms: 2 full bathrooms
- Heating & cooling: Forced-air gas heating; Window cooling units
- Interior features: Blinds on windows; Ceiling fan(s)
- Laundry & utility: Laundry in basement
Neighborhood map
What this means for you Summary
Snapshot
- This is a 2 × 2-bed/1.0-bath units multifamily listed at $200k.
Deal economics
- At list price, monthly cash flow is $236 ($3k/yr) — positive. Per door: $118/mo.
- The deal already cash-flows at list — no discount required.
- Meets the 1% rule at list price ($2k rent vs $200k).
- Recommended offer: $197k (1.5% below list) — sets the bar for market timing.
Location & tenants
- Location reads 81/100 on livability (#104 in OH, #1,591 nationally) — a professional / high-income tenant draw. Strengths: amenities A+, commute A+, cost of living A+; Watch: crime F, employment F.
- Akron City (urban): math 22% / reading 30% proficiency, ranked #602 of 656 in OH (top 92%) — low school quality limits family demand, transient renter base, plan for 1-2y turnover; 66% free/reduced lunch — lower-income household profile, screen leases tightly.
- Zoned schools: Voris Community Learning Center (math 32% / reading 42%, grade F, #1,087 of 1,584 statewide, top 70%, 269 students, 0% FRL); National Inventors Hall of Fame School Center For Stem (math 45% / reading 56%, grade C, #413 of 654 statewide, top 63%, 406 students, 0% FRL); Garfield Community Learning Center (math 8% / reading 27%, grade F, #689 of 781 statewide, top 90%, 971 students, 0% FRL) — zoned schools average 0% FRL vs 66% district-wide (66 pts lower); this property's tenant base skews higher-income than the district average.
- Market conditions: Rents rising fast (+4.6%/yr); 85 active listings in the ZIP; 9 comparable units currently listed for rent nearby; rentals lingering (median 45d on market — plan ~5-8 weeks vacancy on turnover, expect pricing pressure); 56% of comp listings sitting > 30 days — soft ceiling on asking rent; 1,114 units permitted in Summit County in 2024 (397 in 5+ unit buildings).
- At $2,084/mo this rent would consume 49% of the median local household income ($51k/yr) (locally 446% of renters already pay >50% of income on rent) — very limited rent-growth headroom before tenants either downsize or default.
Forward outlook
- Local home prices are declining (-3.0%/yr); year-one equity from $1k of loan paydown is wiped out by about $6k of value loss. Plan a longer hold.
- Summit County population projected to shrink 6% by 2050 — rents likely to lag national; underwrite the cash flow, not the appreciation.
Negotiation context
- It's been on market 23 days — a 2% lower offer ($197k) is reasonable based on typical stale-listing flexibility.
- 3 sale attempts since 14y ago with the ask held roughly flat each time — persistent listings suggest the price (not the market) is what's stuck; bring a comps-based counter.
- Current owner paid $42k; list at $200k implies a 381% gain — meaningful room to come down on a strong offer.
Questions for the listing agent
- Can we see the unit-by-unit rent roll, current vacancy, and any below-market leases? What's the average tenancy length?
- What capital expenditures (roof, boiler, parking lot, exteriors) have been made in the last 5 years, and what's planned in the next 2?
- Built in 1960 — when were the roof, HVAC, electrical panel, plumbing, and water heater last replaced?
- Is there a deadline driving the sale (1031 exchange, divorce, estate, relocation)? That informs how much negotiation room exists.
- Crime grade is F in this area — have there been break-ins, vandalism, or insurance claims at this property in the last 3 years? What carrier currently insures it and at what premium?
- The area grade is low — what's the realistic commute time and amenity access for the typical tenant pool here? Any planned neighborhood developments (good or bad) we should know about?
- What's the average days-on-market for RENTAL listings here right now (not sales)? A rising rental-DOM trend means longer vacancies and softer asking-rent achievability than the comps imply.
- What's the recent tenant-quality profile in this submarket — average credit score on applications, eviction rate, late-payment / NSF rate, and stable-employment percentage? A property-management company in the area should have these aggregated.
- How much new apartment / multifamily construction is in the pipeline within 1–3 miles? Heavy new supply (>2% of stock underway) typically softens rents 12–24 months out; light construction supports rent growth.
Investment metrics
- 1% rule
- 1.04% ✓
- Cap rate
- 7.71%
- Cash-on-cash
- 5.06%
- DSCR
- 1.23
- GRM
- 8.0
CMA / ARV
- ARV (on-the-fly)
- $189,728
- Comps found
- 3
Show comp detail 3 sales within ~0.75 mi
| Address | Dist | Beds/Ba | Sqft | Sold | Price | $/sf | Match |
|---|---|---|---|---|---|---|---|
| 16-18 E Linwood Ave | 0.20mi | 4/2.0 | 1,568 (0%) | 10mo | $194,000 | $124 | 82 |
| 19 & 21 E Dresden Ave | 0.23mi | 4/2.0 | 1,600 (+2%) | 12mo | $178,000 | $111 | 76 |
| 126 W Ralston Ave | 0.45mi | 4/3.5 | 1,568 (0%) | 11mo | $190,000 | $121 | 64 |
Match score weights: distance 35% · size 25% · config 20% · recency 20%. Top-matched comps best support the ARV.
Projected returns pro-forma
-3.0% appreciation · 4.62% rent growth · sell at horizon
- IRR
- -6.6%
- Equity multiple
- 0.75×
- Total profit
- $-13,868
- Equity at exit
- $29,806
- IRR
- 5.0%
- Equity multiple
- 1.39×
- Total profit
- $22,108
- Equity at exit
- $17,284
Cash invested: $55,972 (down + closing). Projections, not guarantees.
Landlord ↔ Tenant lean methodology
- Overall (STATE)
- 73 Landlord-Friendly
- State Ohio
- 73 Landlord-Friendly · R+6
- County
- — inherits STATE
- City
- — inherits STATE
ZIP-level market 44301
- Home prices YoY
- -25.7%
- Rents YoY
- 4.6%
- Active inventory
- 85
- Price-to-rent
- 16.0×
Monthly cashflow live
- Estimated rent
- $2,084 high interval (Pro) →
- Mortgage (P&I)
- −$1,048
- Tax from tax record
- −$279 /mo · $3,347/yr
- Insurance
- −$83
- HOA
- −$0
- Vacancy / Maint / Mgmt
- −$438
- Net cashflow
- $236
Break-even live
Sensitivity live
| Price | -10% $349 | -5% $292 | +0% $236 | +5% $179 | +10% $123 |
|---|---|---|---|---|---|
| Rent | -10% $71 | -5% $154 | +0% $236 | +5% $318 | +10% $401 |
| Rate | -1.0pp $337 | -0.5pp $287 | base $236 | +0.5pp $184 | +1.0pp $131 |
2-unit breakdown (identical units grouped — click to expand)
| Units | Beds | Baths | Est. rent |
|---|---|---|---|
| 2× units | 2 | 1 | $2,084 |
| #1 | 2 | 1 | $1,042 |
| #2 | 2 | 1 | $1,042 |
| Total (2 units) | $2,084 | ||
UW: 25.0% down · 7.5% · 30yr · 1.5% tax · 5.0% vac · 8.0% maint · 8.0% mgmt
Financing live
Cash to close
- Down payment
- $49,975
- Closing costs
- $5,997
- Reserves months
- —
- Total cash needed
- —
Loan-product check · same deal, 3 products live
Conventional
25% down · 7.5% · 30yr
- Down + closing
- —
- Monthly P&I
- —
- Monthly cashflow
- —
- DSCR
- —
- Eligible?
- —
Personal DTI + credit; lowest rate.
DSCR
20% down · 8.5% · 30yr
- Down + closing
- —
- Monthly P&I
- —
- Monthly cashflow
- —
- DSCR
- —
- Eligible?
- —
No personal income docs; deal must DSCR.
Hard money
10% down · 12.0% · 12mo
- Down + closing
- —
- Monthly P&I
- —
- Monthly cashflow
- —
- DSCR
- —
- Eligible?
- —
Short-term bridge; refi at stabilization.
Rent comps 9 comps
| Address | Beds | Baths | Sqft | Rent | $/sqft | DOM | Units | Dist |
|---|---|---|---|---|---|---|---|---|
| 36 W Wilbeth Rd Akron, OH | 3.0 | 1.0 | 1382 | $1,150 | $0.83 | 15d | 1 | 0.73mi |
| 78 E Mapledale Ave Akron, OH | 4.0 | 1.5 | 1600 | $1,500 | $0.94 | 15d | 1 | 1.08mi |
| 373 N Firestone Blvd Akron, OH | 4.0 | 1.5 | 1590 | $1,550 | $0.97 | 45d | 1 | 1.14mi |
| 432 N Firestone Blvd Unit 1496097P Akron, OH | 4.0 | 2.0 | 1926 | $6,253 | $3.25 | 22d | 1 | 1.16mi |
| 67 E Archwood Ave Unit B Akron, OH | 4.0 | 1.0 | 1200 | $1,050 | $0.88 | 45d | 1 | 1.17mi |
| 1298 Bellows St Akron, OH | 3.0 | 1.0 | 1300 | $1,250 | $0.96 | 45d | 1 | 1.21mi |
| 1289 Girard St Akron, OH | 5.0 | 1.0 | 1119 | $1,350 | $1.21 | 45d | 1 | 1.27mi |
| 1368 Moore St Akron, OH | 4.0 | 1.0 | 1575 | $1,300 | $0.83 | 45d | 1 | 1.36mi |
| 1200 Girard St Akron, OH | 3.0 | 2.0 | 1438 | $1,100 | $0.76 | 15d | 1 | 1.42mi |
Listing history 18 events
-
2026-06-21days on market $199,900 Active 23 DOM
-
2026-06-18days on market $199,900 Active 20 DOM
-
2026-06-17days on market $199,900 Active 19 DOM
-
2026-06-16days on market $199,900 Active 18 DOM
-
2026-06-15days on market $199,900 Active 17 DOM
-
2026-06-14days on market $199,900 Active 15 DOM
-
2026-06-13days on market $199,900 Active 14 DOM
-
2026-06-10days on market $199,900 Active 12 DOM
-
2026-06-09days on market $199,900 Active 11 DOM
-
2026-06-08days on market $199,900 Active 10 DOM
-
2026-06-07days on market $199,900 Active 9 DOM
-
2026-06-05days on market $199,900 Active 6 DOM
-
2026-06-03days on market $199,900 Active 5 DOM
-
2026-06-02days on market $199,900 Active 4 DOM
-
2026-06-01days on market $199,900 Active 3 DOM
-
2026-05-31days on market $199,900 Active 2 DOM
-
2026-05-31remarks 699-char remark
-
2026-05-31$199,900 Active 1 DOM
ⓘ Source: listings_history table (triggers on properties + properties_extension) + one-shot
backfill from property_details.listing_events for pre-trigger history.
Tax reassessment forecast OH · Partial reset (capped growth)
- Current annual tax
- $3,347 · $279/mo
- Projected year-2 tax
- $3,347 · $279/mo
- Expected delta
- $0/yr ($0/mo · 0.0%)
ⓘ Screening estimate from a state-policy table — verify with the county assessor before closing.
Climate risk First Street
- Flood 1/10 Low FEMA zone X (unshaded) · 0% chance over 30 yrs
- Wildfire 1/10 Low
- Heat 3/10 Moderate 7 d/yr ≥96°F today · 17 d/yr by 30 yrs out
- Wind 1/10 Low
- Air quality 2/10 Low 1 unhealthy d/yr today · 2 by 30 yrs out
Nearby sold comps map
Loading sold comps map…
Walkable amenities ~0.75 mi
Loading nearby amenities…
Taxation est. · year 1
- Rental income
- $25,008
- − Mortgage interest
- −$11,198
- − Property taxes
- −$3,347
- − Insurance
- −$1,000
- − Repairs & maintenance
- −$2,001
- − Management
- −$2,001
- − Depreciation
- −$5,815
- Taxable loss
- −$352
- Est. tax savings @ 24.0%
- +$85
- After-tax cash flow
- $2,915/yr
For passive investors: Depreciation is non-cash, so a rental often shows a tax loss while cash-flowing — sheltering income. Rental losses are passive: they offset passive income freely, and up to $25,000/yr can offset ordinary (W-2) income if you actively participate and your MAGI is under $100k (phasing out to $0 by $150k); unused losses carry forward. On sale, claimed depreciation is recaptured at up to 25%, and gains may owe capital-gains tax (a 1031 exchange can defer both). Figures are a year-1 estimate at your 24.0% rate — not tax advice; consult a CPA.
Schools (NCES district)
- District
- Akron City
- NCES district ID
- 3904348
- Math proficiency
- 22% ▼ -17.00%
- Reading proficiency
- 30% ▼ -12.00%
- Median HH income
- $33,811
- Composite
- 21.31/100
- National rank
- #8383
- State rank
- #602 of 656 in OH
Livability — Akron
- Score
- 81/100
- State rank
- #104
- US rank
- #1591
Category grades
Schools grade is shown separately in the Schools card above.
Census & demographics
- Census place
- Akron, OH
- County
- Summit County · 440,783 people
- City population
- 174,375
- Metro
- Akron, OH
- Population (ZIP)
- 13,668
- Household income
- $51,321
- Rent vs Own
- Severe rent burden
- 446.0
Population outlook (Summit County) Hauer SSP2
- Today (2025)
- 546,583 people
- By 2030
- 544,028 · -0.5%
- By 2040
- 531,363 · -2.8%
- By 2050
- 514,923 · -5.8%
- By 2075
- 481,765 · -11.9%
- By 2100
- 432,265 · -20.9%
Race, ethnicity, and origin ACS 2023
- Neighborhood character
- Diverse neighborhood (Simpson 0.63)
- Race & ethnicity
- White 52% Black 30% Two or more races 11% Hispanic / Latino 5% Asian 2%
- Hispanic origin (detail)
- Mexican 3%
- Common ancestry
- Romanian 4% Lithuanian 2% Serbian 1%
- Foreign-born
- 6% · Canada
- Languages at home
- 92% English-only · Spanish 4% Other Indo-European 1% Other Asian/Pacific 1%
Political lean MEDSL · Summit
- 2024 margin
- Lean D (+7.0) · D 53.0% · R 46.0%
- 2008→2024 swing
- -9.6pp toward R · 2008: 16.6pp · 2024: 7.0pp
- All cycles
- 2024: D+7.0 2020: D+9.6 2016: D+8.2 2012: D+14.8 2008: D+16.6
Not yet ingested
- Civics
- —
Market trends
- HPI YoY
- ▼ -74.09%
- Current HPI
- 213.697
- Rent YoY
- ▲ 4.62%
- Metro
- Akron, OH
- State GDP YoY
- ▲ 1.98%
- F500 in state
- 48
Industry mix (Fortune 500 HQ in OH)
| Industry | F500 HQs | Revenue |
|---|---|---|
| Insurance | 3 | $145B |
|
||
| Industrial Machinery | 3 | $49B |
|
||
| Financial Services | 3 | $24B |
|
||
| Consumer Goods | 2 | $93B |
|
||
| Aerospace / Defense | 2 | $47B |
|
||
| Utilities | 2 | $33B |
|
||
Price history
+376.0% since first listed5 events — show timeline
- 2026-05-29 Listed $199,900 MLSNOW
- 2023-10-06 Rental Removed $650 APPFOLIO
- 2023-10-02 Listed for Rent $650 APPFOLIO
- 2012-10-12 Sold (MLS) $41,600 MLSNOW
- 2012-07-31 Listed $42,000 MLSNOW
Property tax history
+1.5%/yrLatest (2025): $3,347 · -1.3% YoY. Source: county tax records.
Cash-flow waterfall
monthlySold comps — $/sqft
last 12 mo · ≤1 miLoading sold comps…