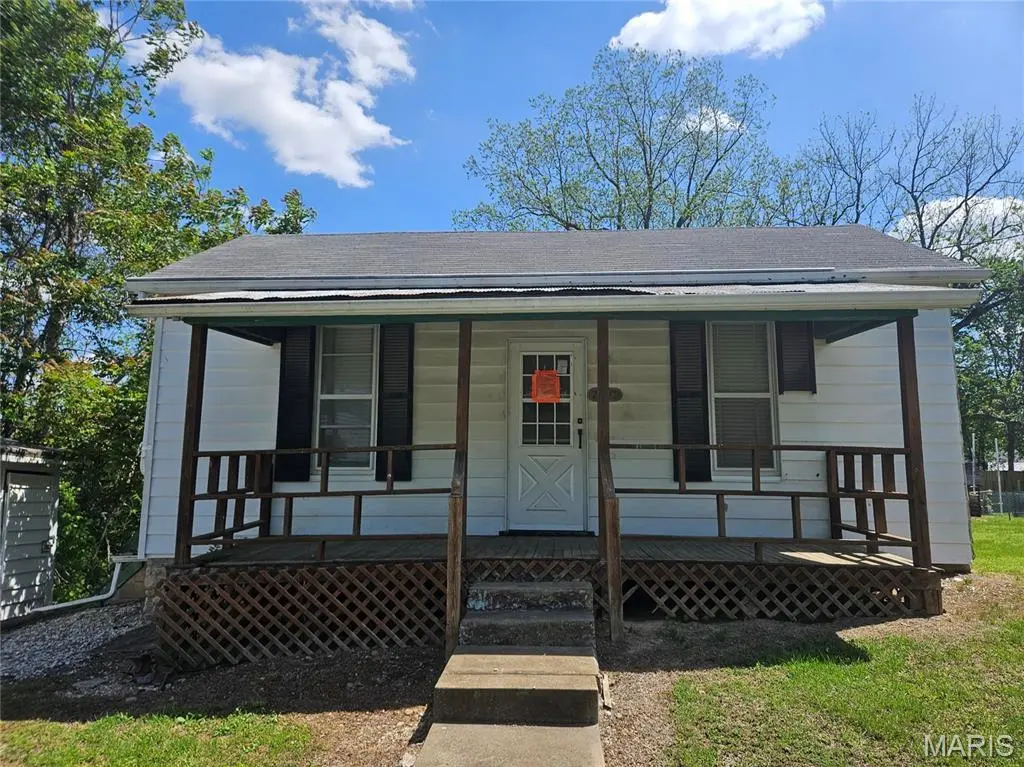
2120 Jackson St · Prairie du Rocher, IL
Flood risk 1/10 · Minimal
- FEMA flood zone
- X
- Chance of flooding over 30 yrs
- 0.0%
- Est. flood insurance / yr
- $507 – $1,088
Fire risk 3/10 · Minor
- Est. fire insurance / yr
- $804 – $1,492
Heat risk 4/10 · Minor
- Hot days now (above 106°F)
- 7 days/yr
- Hot days in 30 yrs
- 20 days/yr
Wind risk 2/10 · Minimal
- Chance of severe wind over 30 yrs
- 1.0%
Air-quality risk 1/10 · Minimal
- Unhealthy air days now
- 0 days/yr
- Unhealthy air days in 30 yrs
- 0 days/yr
Risk factors via First Street. Map © Google.
Why this score? — see what drove the C- grade
The composite is a weighted blend of 9 inputs, each scored 0–100. Each bar is that input's sub-score; the figure is the points it added to the 100-point composite (weight × sub-score).
- Cash flow +15.0/30.0
- ARV discount +8.6/15.0
- 1% rule +5.0/10.0
- DSCR +5.0/10.0
- Appreciation +5.0/10.0
- Schools +3.8/10.0
- Livability +2.8/5.0
- Rent growth +2.5/5.0
- Condition / age +2.5/5.0
$15,000
🖨 Deal sheet (PDF) 📄 Offer letter ✓ Due diligence
Key facts
- 0.24 acre lot
- Garage
- Built 1880
Property features AI
Exterior
- Parking: 1-car garage
- Utilities: Electricity connected; Electric service (other); Private sewer
- Home design: Single-family residence; One story; Residential property
- Construction: Aluminum siding
- Exterior features: Back yard
Interior
- Bedrooms: 2 bedrooms (both on the main level)
- Bathrooms: 1 full bathroom; 1 half bathroom
- Heating & cooling: Propane heating; Central air conditioning
- Interior features: Partial basement
Neighborhood map
What this means for you Summary
Snapshot
- This is a 2-bed/2.0-bath single-family listed at $15k.
Deal economics
- At list price, monthly cash flow is $575 ($7k/yr) — positive.
- The deal already cash-flows at list — no discount required.
- Meets the 1% rule at list price ($860 rent vs $15k).
Location & tenants
- Location reads 55/100 on livability (#1,250 in IL) — a working-class tenant base; expect higher turnover. Strengths: cost of living A+, housing A+; Watch: employment D+, crime D, amenities F.
- Waterloo CUSD 5 (town): math 38% / reading 46% proficiency, ranked #109 of 620 in IL (top 18%) — families likely to look elsewhere, expect single-tenant / working-renter base with shorter leases; only 16% free/reduced lunch — higher-income household profile.
- Zoned schools: Waterloo High School (math 37% / reading 37%, grade F, #107 of 693 statewide, top 17%, 895 students, 0% FRL) — zoned schools average 0% FRL vs 16% district-wide (16 pts lower); this property's tenant base skews higher-income than the district average.
- Market conditions: 1 active listings in the ZIP; 62 units permitted in Monroe County in 2024 (0 in 5+ unit buildings).
Forward outlook
- In year one you build about $554 of equity ($104 loan paydown + $450 appreciation (3.0% local appreciation)).
- At projected returns (3.0% appreciation + 3.0% rent growth), your $4k cash investment doubles in ~1 year — after that, you're playing with house money.
Negotiation context
- Only 1 days on market — expect competitive offers; lowballing is unlikely to land.
Risks & watch-outs
- Watch-outs: built in 1880 — expect roof / HVAC / electrical / plumbing capex.
Questions for the listing agent
- Built in 1880 — when were the roof, HVAC, electrical panel, plumbing, and water heater last replaced?
- Is there a deadline driving the sale (1031 exchange, divorce, estate, relocation)? That informs how much negotiation room exists.
- Schools are F-rated, which usually means shorter tenancies and higher turnover. Who's the typical renter profile here, and what's been the actual vacancy rate?
- Crime grade is D in this area — have there been break-ins, vandalism, or insurance claims at this property in the last 3 years? What carrier currently insures it and at what premium?
- What's the average days-on-market for RENTAL listings here right now (not sales)? A rising rental-DOM trend means longer vacancies and softer asking-rent achievability than the comps imply.
- What's the recent tenant-quality profile in this submarket — average credit score on applications, eviction rate, late-payment / NSF rate, and stable-employment percentage? A property-management company in the area should have these aggregated.
- How much new for-sale + rental construction is in the pipeline within 1–3 miles? Heavy new supply typically softens prices + rents 12–24 months out; constrained supply supports both.
Investment metrics
- 1% rule
- 5.73% ✓
- Cap rate
- 52.33%
- Cash-on-cash
- 164.40%
- DSCR
- 8.32
- GRM
- 1.5
CMA / ARV
- ARV (on-the-fly)
- $15,390
- Comps found
- 1
Show comp detail 1 sale within ~0.75 mi
| Address | Dist | Beds/Ba | Sqft | Sold | Price | $/sf | Match |
|---|---|---|---|---|---|---|---|
| 2120 Jackson St | 0.00mi | 2/1.5 | 810 (0%) | 0mo | $15,000 | $19 | 98 |
Match score weights: distance 35% · size 25% · config 20% · recency 20%. Top-matched comps best support the ARV.
Projected returns pro-forma
3.0% appreciation · 3.0% rent growth · sell at horizon
- IRR
- —
- Equity multiple
- 10.16×
- Total profit
- $38,468
- Equity at exit
- $6,745
- IRR
- —
- Equity multiple
- 21.38×
- Total profit
- $85,603
- Equity at exit
- $10,394
Cash invested: $4,200 (down + closing). Projections, not guarantees.
Landlord ↔ Tenant lean methodology
- Overall (STATE)
- 43 Moderately Tenant-Leaning
- State Illinois
- 43 Moderately Tenant-Leaning · D+7
- County
- — inherits STATE
- City
- — inherits STATE
ZIP-level market 62279
- Active inventory
- 1
- Price-to-rent
- 1.5×
Monthly cashflow live
- Estimated rent
- $860 medium interval (Pro) →
- Mortgage (P&I)
- −$79
- Tax est. 1.5%
- −$19 /mo · $225/yr
- Insurance
- −$6
- HOA
- −$0
- Vacancy / Maint / Mgmt
- −$181
- Net cashflow
- $575
Break-even live
Sensitivity live
| Price | -10% $586 | -5% $581 | +0% $575 | +5% $570 | +10% $565 |
|---|---|---|---|---|---|
| Rent | -10% $508 | -5% $541 | +0% $575 | +5% $609 | +10% $643 |
| Rate | -1.0pp $583 | -0.5pp $579 | base $575 | +0.5pp $572 | +1.0pp $568 |
UW: 25.0% down · 7.5% · 30yr · 1.5% tax · 5.0% vac · 8.0% maint · 8.0% mgmt
Financing live
Cash to close
- Down payment
- $3,750
- Closing costs
- $450
- Reserves months
- —
- Total cash needed
- —
Loan-product check · same deal, 3 products live
Conventional
25% down · 7.5% · 30yr
- Down + closing
- —
- Monthly P&I
- —
- Monthly cashflow
- —
- DSCR
- —
- Eligible?
- —
Personal DTI + credit; lowest rate.
DSCR
20% down · 8.5% · 30yr
- Down + closing
- —
- Monthly P&I
- —
- Monthly cashflow
- —
- DSCR
- —
- Eligible?
- —
No personal income docs; deal must DSCR.
Hard money
10% down · 12.0% · 12mo
- Down + closing
- —
- Monthly P&I
- —
- Monthly cashflow
- —
- DSCR
- —
- Eligible?
- —
Short-term bridge; refi at stabilization.
Listing history 3 events
-
2026-05-05status Pending
-
2026-05-05$15,000 Active
-
2009-07-09soldstatus $32,500
ⓘ Source: listings_history table (triggers on properties + properties_extension) + one-shot
backfill from property_details.listing_events for pre-trigger history.
Climate risk First Street
- Flood 1/10 Low FEMA zone X · 0% chance over 30 yrs
- Wildfire 3/10 Moderate
- Heat 4/10 Moderate 7 d/yr ≥106°F today · 20 d/yr by 30 yrs out
- Wind 2/10 Low 100% chance of damaging wind over 30 yrs
- Air quality 1/10 Low 0 unhealthy d/yr today · 0 by 30 yrs out
Nearby sold comps map
Loading sold comps map…
Walkable amenities ~0.75 mi
Loading nearby amenities…
Taxation est. · year 1
- Rental income
- $10,315
- − Mortgage interest
- −$840
- − Property taxes
- −$225
- − Insurance
- −$75
- − Repairs & maintenance
- −$825
- − Management
- −$825
- − Depreciation
- −$436
- Taxable income
- $7,088
- Est. tax owed @ 24.0%
- −$1,701
- After-tax cash flow
- $5,204/yr
For passive investors: Depreciation is non-cash, so a rental often shows a tax loss while cash-flowing — sheltering income. Rental losses are passive: they offset passive income freely, and up to $25,000/yr can offset ordinary (W-2) income if you actively participate and your MAGI is under $100k (phasing out to $0 by $150k); unused losses carry forward. On sale, claimed depreciation is recaptured at up to 25%, and gains may owe capital-gains tax (a 1031 exchange can defer both). Figures are a year-1 estimate at your 24.0% rate — not tax advice; consult a CPA.
Schools (NCES district)
- District
- Waterloo CUSD 5
- NCES district ID
- 1741070
- Math proficiency
- 38% ▼ -18.00%
- Reading proficiency
- 46% ▼ -15.00%
- Median HH income
- $68,468
- Composite
- 37.89/100
- National rank
- #4317
- State rank
- #109 of 620 in IL
Livability — Prairie du Rocher
- Score
- 55/100
- State rank
- #1250
- US rank
- #23493
Category grades
Schools grade is shown separately in the Schools card above.
Census & demographics
- Population (ZIP)
- 69
Population outlook (Monroe County) Hauer SSP2
- Today (2025)
- 35,776 people
- By 2030
- 36,437 · +1.8%
- By 2040
- 36,967 · +3.3%
- By 2050
- 36,310 · +1.5%
- By 2075
- 34,133 · -4.6%
- By 2100
- 28,857 · -19.3%
Race, ethnicity, and origin ACS 2023
- Neighborhood character
- Predominantly White (100%)
- Race & ethnicity
- White 100%
Political lean MEDSL · Monroe
- 2024 margin
- Solid R (+36.3) · D 31.0% · R 67.3% · Other 1.7%
- 2008→2024 swing
- -25.6pp toward R · 2008: -10.7pp · 2024: -36.3pp
- All cycles
- 2024: R+36.3 2020: R+35.7 2016: R+37.2 2012: R+26.9 2008: R+10.7
Not yet ingested
- Civics
- —
Market trends
- HPI YoY
- —
- Current HPI
- —
- Rent YoY
- —
- Metro
- —
- State GDP YoY
- ▲ 1.59%
- F500 in state
- 60
Industry mix (Fortune 500 HQ in IL)
| Industry | F500 HQs | Revenue |
|---|---|---|
| Insurance | 4 | $201B |
|
||
| Consumer Goods | 4 | $87B |
|
||
| Industrial Machinery | 3 | $64B |
|
||
| Healthcare | 2 | $55B |
|
||
| Retail / Pharmacy | 1 | $148B |
|
||
| Agriculture / Food | 1 | $86B |
|
||
Price history
-53.8% since first listed3 events — show timeline
- 2026-05-05 Pending — MARIS as Distributed by MLS Grid
- 2026-05-05 Listed $15,000 MARIS as Distributed by MLS Grid
- 2009-07-09 Sold (Public Records) $32,500 Public Records
Property tax history
+4.5%/yrLatest (2024): $805 · +1.4% YoY. Source: county tax records.
Cash-flow waterfall
monthlySold comps — $/sqft
last 12 mo · ≤1 miLoading sold comps…