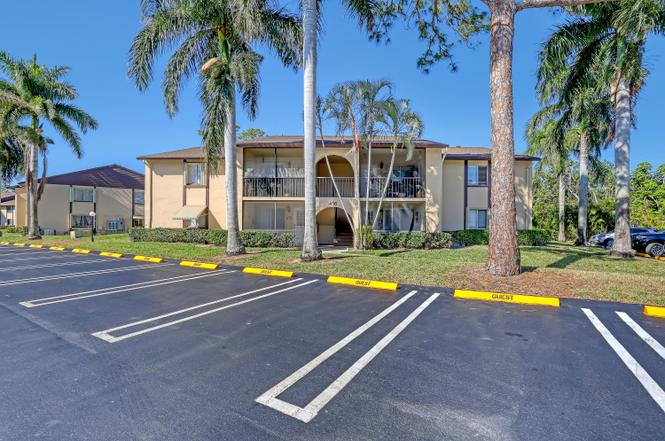
436 Pine Glen Ln Unit C-2 · Greenacres, FL
Flood risk 1/10 · Minimal
- FEMA flood zone
- X (unshaded)
- Chance of flooding over 30 yrs
- 0.0%
- Est. flood insurance / yr
- $507 – $1,088
Fire risk 1/10 · Minimal
- Est. fire insurance / yr
- $947 – $1,759
Heat risk 10/10 · Severe
- Hot days now (above 106°F)
- 7 days/yr
- Hot days in 30 yrs
- 28 days/yr
Wind risk 10/10 · Severe
- Chance of severe wind over 30 yrs
- 99.0%
Air-quality risk 2/10 · Minimal
- Unhealthy air days now
- 0 days/yr
- Unhealthy air days in 30 yrs
- 2 days/yr
Risk factors via First Street. Map © Google.
Why this score? — see what drove the C grade
The composite is a weighted blend of 9 inputs, each scored 0–100. Each bar is that input's sub-score; the figure is the points it added to the 100-point composite (weight × sub-score).
- Cash flow +20.7/30.0
- 1% rule +10.0/10.0
- ARV discount +7.5/15.0
- DSCR +6.6/10.0
- Schools +4.3/10.0
- Livability +3.5/5.0
- Rent growth +2.8/5.0
- Condition / age +2.5/5.0
- Appreciation +0.0/10.0
$119,000
🖨 Deal sheet (PDF) 📄 Offer letter ✓ Due diligence
Listing remarks MLS
PRISTINE 2ND FLOOR CONDO OVERLOOKING PRIVATE GREEN AREA, ALL TILED, NEW A/C 2014, INTERIOR FRESHLY PAINTED, NEWER KITCHEN APPLIANCES, UPDATED BATH, SPACIOUS WALK-IN CLOSETS IN BOTH BEDROOMS, LAUNDRY ROOM INSIDE, SCREENED/COVERED & TILED PATIO. TRULY IMMACULATE & MOVE-IN READY. CENTRALLY LOCATED TO SHOPPING, RESTAURANTS, BEACHES & MAJOR AIRPORT.
Key facts
- Walk-in closet
- Screened porch
- Guests parking
Tags
Property features AI
Finance
- Financial info: Pets allowed (restrictions possible)
- HOA & community: Community has an association; Monthly HOA includes cable TV, insurance, grounds maintenance, trash, common areas, and recreation facility; Association amenities: clubhouse, pool, shuffleboard court, bocce ball
Exterior
- Parking: Assigned parking; Guest parking
- Utilities: No utilities listed
- Home design: Condominium; Single-story; Faces west; Resale
- Construction: CBS construction
- Exterior features: Screened porch; Porch
Interior
- Kitchen: Dishwasher; Electric range; Refrigerator
- Bedrooms: 2 bedrooms on main level
- Flooring: Ceramic tile
- Bathrooms: 1 full bathroom (main level)
- Heating & cooling: Central heating; Central air; Ceiling fan(s)
- Interior features: Walk-in closet(s); Blinds
- Laundry & utility: Laundry inside; Unfurnished
Neighborhood map
What this means for you Summary
Snapshot
- This is a 2-bed/1.0-bath condo listed at $119k.
Deal economics
- At list price, monthly cash flow is $161 ($2k/yr) — positive.
- The deal already cash-flows at list — no discount required.
- Meets the 1% rule at list price ($2k rent vs $119k).
- Recommended offer: $105k (12.0% below list) — sets the bar for market timing.
Location & tenants
- Location reads 69/100 on livability (#490 in FL) — a middle-class / working-renter tenant base. Strengths: cost of living A+, housing A+, health & safety A; Watch: employment D, amenities F, commute F.
- Palm Beach (suburban): math 46% / reading 53% proficiency, ranked #34 of 73 in FL (top 47%) — families likely to look elsewhere, expect single-tenant / working-renter base with shorter leases.
- Zoned schools: Heritage Elementary School (math 35% / reading 39%, grade F, #1,609 of 2,144 statewide, top 77%, 786 students, 75% FRL); L C Swain Middle School (math 26% / reading 33%, grade F, #469 of 571 statewide, top 84%, 1,451 students, 74% FRL); Santaluces Community High (math 22% / reading 39%, grade F, #434 of 667 statewide, top 66%, 2,675 students, 61% FRL) — zoned schools average 70% FRL vs 52% district-wide (18 pts higher); higher-poverty schools than district average — tighter screening recommended.
- Zoned-school proficiency averages 32% at this address vs 50% district-wide (-17 pts) — the specific schools serving this property underperform the Palm Beach average; the district grade overstates school quality for this exact location.
- Market conditions: Rents rising (+1.3%/yr); 354 active listings in the ZIP; 40 comparable units currently listed for rent nearby; rentals at typical pace (median 26d on market — plan ~3-4 weeks tenant-placement turnaround); 3,974 units permitted in Palm Beach County in 2024 (1,012 in 5+ unit buildings).
- This rent runs 32% of the median local income ($74k/yr) — at the standard rent-burdened threshold; future hikes will face affordability resistance.
Forward outlook
- Local home prices are declining (-3.0%/yr); year-one equity from $823 of loan paydown is wiped out by about $4k of value loss. Plan a longer hold.
- Palm Beach County population projected at +30% by 2050 — long-run rental-demand tailwind backs the buy-and-hold thesis.
Negotiation context
- It's been on market 458 days — a 12% lower offer ($105k) is reasonable based on typical stale-listing flexibility.
- 5 sale attempts since 26y ago; this cycle's ask has dropped $14k (11%) from the opening price — seller is motivated, your offer sets the floor, not the list.
- Current owner paid $68k; list at $119k implies a 75% gain — meaningful room to come down on a strong offer.
Risks & watch-outs
- Watch-outs: HOA is 26% of rent.
- Climate carrying-cost: severe wind risk, 99% chance of damaging wind over 30y; extreme-heat days projected 7→28/yr by 2055 (HVAC capex compounding) — expect insurance premiums to compound above CPI over the hold.
Questions for the listing agent
- It's been on market 458 days. Have you received any prior offers? Is the seller open to a 12% concession, seller financing, or rate buy-down credit?
- What does the HOA fee cover, when was the last increase, and are there any pending special assessments or reserve-fund shortfalls?
- Any open or pending special assessments — roof, HVAC, plumbing, elevator, façade? What's the per-unit balance and payoff schedule, and is the seller paying it off at close or rolling it to the buyer?
- Why hasn't it sold? Are there any deal-killer items the seller is aware of (foundation, flood, title, zoning, code violations)?
- Is there a deadline driving the sale (1031 exchange, divorce, estate, relocation)? That informs how much negotiation room exists.
- Schools are D-rated, which usually means shorter tenancies and higher turnover. Who's the typical renter profile here, and what's been the actual vacancy rate?
- What's the average days-on-market for RENTAL listings here right now (not sales)? A rising rental-DOM trend means longer vacancies and softer asking-rent achievability than the comps imply.
- What's the recent tenant-quality profile in this submarket — average credit score on applications, eviction rate, late-payment / NSF rate, and stable-employment percentage? A property-management company in the area should have these aggregated.
- How much new apartment / multifamily construction is in the pipeline within 1–3 miles? Heavy new supply (>2% of stock underway) typically softens rents 12–24 months out; light construction supports rent growth.
Investment metrics
- 1% rule
- 1.63% ✓
- Cap rate
- 7.92%
- Cash-on-cash
- 5.80%
- DSCR
- 1.26
- GRM
- 5.1
CMA / ARV
No comps found within radius.
Projected returns pro-forma
-3.0% appreciation · 1.33% rent growth · sell at horizon
- IRR
- -10.0%
- Equity multiple
- 0.64×
- Total profit
- $-11,871
- Equity at exit
- $17,743
- IRR
- -4.3%
- Equity multiple
- 0.75×
- Total profit
- $-8,382
- Equity at exit
- $10,289
Cash invested: $33,320 (down + closing). Projections, not guarantees.
Landlord ↔ Tenant lean methodology
- Overall (STATE)
- 87 Strongly Landlord-Friendly
- State Florida
- 87 Strongly Landlord-Friendly · R+3
- County
- — inherits STATE
- City
- — inherits STATE
ZIP-level market 33463
- Home prices YoY
- -30.9%
- Rents YoY
- 1.3%
- Active inventory
- 354
- Price-to-rent
- 5.1×
Monthly cashflow live
- Estimated rent
- $1,944 high interval (Pro) →
- Mortgage (P&I)
- −$624
- Tax from tax record
- −$202 /mo · $2,424/yr
- Insurance
- −$50
- HOA
- −$499
- Vacancy / Maint / Mgmt
- −$408
- Net cashflow
- $161
Break-even live
Sensitivity live
| Price | -10% $228 | -5% $195 | +0% $161 | +5% $127 | +10% $94 |
|---|---|---|---|---|---|
| Rent | -10% $7 | -5% $84 | +0% $161 | +5% $238 | +10% $315 |
| Rate | -1.0pp $221 | -0.5pp $191 | base $161 | +0.5pp $130 | +1.0pp $99 |
UW: 25.0% down · 7.5% · 30yr · 1.5% tax · 5.0% vac · 8.0% maint · 8.0% mgmt
Financing live
Cash to close
- Down payment
- $29,750
- Closing costs
- $3,570
- Reserves months
- —
- Total cash needed
- —
Loan-product check · same deal, 3 products live
Conventional
25% down · 7.5% · 30yr
- Down + closing
- —
- Monthly P&I
- —
- Monthly cashflow
- —
- DSCR
- —
- Eligible?
- —
Personal DTI + credit; lowest rate.
DSCR
20% down · 8.5% · 30yr
- Down + closing
- —
- Monthly P&I
- —
- Monthly cashflow
- —
- DSCR
- —
- Eligible?
- —
No personal income docs; deal must DSCR.
Hard money
10% down · 12.0% · 12mo
- Down + closing
- —
- Monthly P&I
- —
- Monthly cashflow
- —
- DSCR
- —
- Eligible?
- —
Short-term bridge; refi at stabilization.
Rent comps 40 comps
| Address | Beds | Baths | Sqft | Rent | $/sqft | DOM | Units | Dist |
|---|---|---|---|---|---|---|---|---|
| 429 Pine Glen Ln Unit C2 Greenacres, FL | 2.0 | 1.0 | 804 | $1,650 | $2.05 | 26d | 1 | 0.07mi |
| 443 Pine Glen Ln Unit B2 Greenacres, FL | 2.0 | 2.0 | 922 | $1,500 | $1.63 | 26d | 1 | 0.09mi |
| 407 Pine Cir Unit C1 Greenacres, FL | 2.0 | 2.0 | 922 | $1,800 | $1.95 | 26d | 1 | 0.11mi |
| 407 Pine Cir Unit B1 Greenacres, FL | 2.0 | 2.0 | 922 | $1,750 | $1.90 | 26d | 1 | 0.11mi |
| 446 Pine Glen Ln Unit A1 Greenacres, FL | 1.0 | 1.0 | 614 | $1,550 | $2.52 | 16d | 1 | 0.12mi |
| 408 Pine Glen Ln Unit C-2 Greenacres, FL | 2.0 | 1.0 | 804 | $1,600 | $1.99 | 26d | 1 | 0.12mi |
| 417 Pine Glen Ln Unit D2 Greenacres, FL | 2.0 | 2.0 | 922 | $1,550 | $1.68 | 26d | 1 | 0.17mi |
| 417 Pine Glen Ln Unit C2 Greenacres, FL | 2.0 | 2.0 | 922 | $1,800 | $1.95 | 26d | 1 | 0.17mi |
| 4838 Esedra Ct Lake Worth, FL | 1.0 | 1.0 | 804 | $1,550 | $1.93 | 26d | 2 | 0.24mi |
| 4832 Esedra Ct Lake Worth, FL | 1.0–3.0 | 1.0–2.0 | 1026 | $1,650 | $1.61 | 4d | 2 | 0.27mi |
| 4535 Oak Terrace Dr Greenacres, FL | 3.0 | 2.0 | 1061 | $2,400 | $2.26 | 13d | 1 | 0.27mi |
| 4535 Oak Terrace Dr Greenacres, FL | 3.0 | 2.0 | 1061 | $2,500 | $2.36 | 16d | 1 | 0.27mi |
| 4801 Esedra Ct Lake Worth, FL | 2.0 | 2.0 | 1027 | $2,075 | $2.02 | 12d | 2 | 0.28mi |
| 4801 Esedra Ct #201 Lake Worth, FL | 2.0 | 2.0 | 1005 | $2,300 | $2.29 | 26d | 1 | 0.28mi |
| 4243 Oak Terrace Dr #4243 Greenacres, FL | 2.0 | 2.0 | 883 | $1,950 | $2.21 | 26d | 1 | 0.40mi |
| 4245 Oak Terrace Dr Greenacres, FL | 2.0 | 2.0 | 883 | $2,000 | $2.27 | 26d | 1 | 0.40mi |
| 4254 Deste Ct #305 Greenacres, FL | 1.0 | 1.0 | 716 | $1,500 | $2.09 | 26d | 1 | 0.40mi |
| 4259 Oak Terrace Dr Greenacres, FL | 2.0 | 2.0 | 883 | $1,900 | $2.15 | 26d | 1 | 0.41mi |
| 4266 Deste Ct #107 Greenacres, FL | 2.0 | 2.0 | 978 | $2,100 | $2.15 | 26d | 1 | 0.43mi |
| 4221 Oak Terrace Dr Greenacres, FL | 2.0 | 2.0 | 883 | $1,900 | $2.15 | 26d | 1 | 0.44mi |
| 4185 Oak Terrace Dr Greenacres, FL | 2.0 | 2.0 | 883 | $1,850 | $2.10 | 23d | 1 | 0.44mi |
| 4657 Fountains Dr S #206 Lake Worth, FL | 1.0 | 1.0 | 882 | $1,650 | $1.87 | 13d | 1 | 0.45mi |
| 104 Lake Pine Cir Unit A1 Greenacres, FL | 2.0 | 2.0 | 937 | $2,050 | $2.19 | 26d | 1 | 0.47mi |
| 5905 Triphammer Rd Lake Worth, FL | 2.0 | 2.0 | 1020 | $3,000 | $2.94 | 26d | 1 | 0.48mi |
| 4147 Oak Terrace Dr Greenacres, FL | 2.0 | 2.0 | 883 | $2,000 | $2.27 | 1d | 1 | 0.49mi |
| 4121 Oak Terrace Dr Greenacres, FL | 2.0 | 2.0 | 883 | $1,950 | $2.21 | 26d | 1 | 0.49mi |
| 102 Lake Pine Cir Unit A2 Greenacres, FL | 2.0 | 1.0 | 937 | $1,500 | $1.60 | 26d | 1 | 0.50mi |
| 4101 Oak Terrace Dr Greenacres, FL | 2.0 | 2.0 | 883 | $1,850 | $2.10 | 12d | 1 | 0.50mi |
| 4242 Deste Ct Unit 208 Greenacres, FL | 2.0 | 2.0 | 978 | $2,500 | $2.56 | 26d | 1 | 0.50mi |
| 6615 Waterfront Xing Lake Worth, FL | 1.0–3.0 | 1.0–2.0 | 1087 | $2,864 | $2.63 | 1d | 23 | 0.52mi |
| 121 Lake Pine Cir Unit A2 Greenacres, FL | 2.0 | 1.0 | 818 | $1,600 | $1.96 | 26d | 1 | 0.55mi |
| 105 Lake Pine Cir Unit B2 Greenacres, FL | 2.0 | 2.0 | 937 | $2,000 | $2.13 | 26d | 1 | 0.55mi |
| 4236 Deste Ct #108 Greenacres, FL | 1.0 | 1.0 | 716 | $1,800 | $2.51 | 19d | 1 | 0.56mi |
| 4284 Deste Ct #304 Greenacres, FL | 1.0 | 1.0 | 716 | $2,200 | $3.07 | 18d | 1 | 0.60mi |
| 133 Lake Pine Cir Unit B1 Greenacres, FL | 1.0 | 1.0 | 639 | $1,450 | $2.27 | 26d | 1 | 0.60mi |
| 133 Lake Pine Cir Greenacres, FL | 1.0 | 1.0 | 639 | $1,300 | $2.03 | 20d | 1 | 0.60mi |
| 4230 Deste Ct Unit 305 Greenacres, FL | 1.0 | 1.0 | 716 | $1,900 | $2.65 | 7d | 1 | 0.62mi |
| 4539 Luxemburg Ct Lake Worth, FL | 2.0 | 2.0 | 1005 | $2,250 | $2.24 | 26d | 1 | 0.62mi |
| 4539 Luxemburg Ct Lake Worth, FL | 2.0 | 2.0 | 1027 | $2,250 | $2.19 | 7d | 1 | 0.62mi |
| 4489 Luxemburg Ct #101 Lake Worth, FL | 2.0 | 2.0 | 1005 | $2,000 | $1.99 | 26d | 1 | 0.63mi |
HOA detail condo
- Monthly dues
- $499 · $5,988/yr
- Assessments
- None detected in remarks — confirm with the listing agent.
Listing history 30 events
-
2026-06-21days on market $119,000 Active 458 DOM
-
2026-06-18days on market $119,000 Active 455 DOM
-
2026-06-17days on market $119,000 Active 454 DOM
-
2026-06-16days on market $119,000 Active 453 DOM
-
2026-06-15days on market $119,000 Active 452 DOM
-
2026-06-13days on market $119,000 Active 450 DOM
-
2026-06-09days on market $119,000 Active 446 DOM
-
2026-06-07days on market $119,000 Active 444 DOM
-
2026-06-04days on market $119,000 Active 441 DOM
-
2026-06-03days on market $119,000 Active 440 DOM
-
2026-06-01days on market $119,000 Active 438 DOM
-
2026-05-31days on market $119,000 Active 437 DOM
-
2026-04-10price $119,000
-
2025-04-25price $125,000
-
2025-03-20$133,000 Active
-
2025-02-01historical
-
2025-02-01status Active
-
2025-01-31historical
-
2024-09-03$175,000 Active
-
2018-03-08soldstatus $68,000
-
2018-02-28soldstatus $68,000 Closed 359-char remark
Show marketing remark (359 chars)
PRISTINE 2ND FLOOR CONDO OVERLOOKING PRIVATE GREEN AREA, ALL TILED, NEW A/C 2014, INTERIOR FRESHLY PAINTED, NEWER KITCHEN APPLIANCES, UPDATED BATH, SPACIOUS WALK-IN CLOSETS IN BOTH BEDROOMS, LAUNDRY ROOM INSIDE, SCREENED/COVERED & TILED PATIO. TRULY IMMACULATE & MOVE-IN READY. CENTRALLY LOCATED TO SHOPPING, RESTAURANTS, BEACHES & MAJOR AIRPORT.
-
2018-02-08historical Contingent 359-char remark
Show marketing remark (359 chars)
PRISTINE 2ND FLOOR CONDO OVERLOOKING PRIVATE GREEN AREA, ALL TILED, NEW A/C 2014, INTERIOR FRESHLY PAINTED, NEWER KITCHEN APPLIANCES, UPDATED BATH, SPACIOUS WALK-IN CLOSETS IN BOTH BEDROOMS, LAUNDRY ROOM INSIDE, SCREENED/COVERED & TILED PATIO. TRULY IMMACULATE & MOVE-IN READY. CENTRALLY LOCATED TO SHOPPING, RESTAURANTS, BEACHES & MAJOR AIRPORT.
-
2018-01-24$74,900 Active 359-char remark
Show marketing remark (359 chars)
PRISTINE 2ND FLOOR CONDO OVERLOOKING PRIVATE GREEN AREA, ALL TILED, NEW A/C 2014, INTERIOR FRESHLY PAINTED, NEWER KITCHEN APPLIANCES, UPDATED BATH, SPACIOUS WALK-IN CLOSETS IN BOTH BEDROOMS, LAUNDRY ROOM INSIDE, SCREENED/COVERED & TILED PATIO. TRULY IMMACULATE & MOVE-IN READY. CENTRALLY LOCATED TO SHOPPING, RESTAURANTS, BEACHES & MAJOR AIRPORT.
-
2011-03-28soldstatus $52,000
-
2001-03-10soldstatus $36,500
-
2001-01-31soldstatus $36,500
-
2000-11-13historical
-
2000-06-05$37,900
-
1992-01-16soldstatus $35,000
-
1981-11-01soldstatus $42,300
ⓘ Source: listings_history table (triggers on properties + properties_extension) + one-shot
backfill from property_details.listing_events for pre-trigger history.
Tax reassessment forecast FL · Resets to sale price
- Current annual tax
- $2,424 · $202/mo
- Projected year-2 tax
- $2,424 · $202/mo
- Expected delta
- $0/yr ($0/mo · 0.0%)
ⓘ Screening estimate from a state-policy table — verify with the county assessor before closing.
Climate risk First Street
- Flood 1/10 Low FEMA zone X (unshaded) · 0% chance over 30 yrs
- Wildfire 1/10 Low
- Heat 10/10 Extreme 7 d/yr ≥106°F today · 28 d/yr by 30 yrs out
- Wind 10/10 Extreme 99% chance of damaging wind over 30 yrs
- Air quality 2/10 Low 0 unhealthy d/yr today · 2 by 30 yrs out
Nearby sold comps map
Loading sold comps map…
Walkable amenities ~0.75 mi
Loading nearby amenities…
Taxation est. · year 1
- Rental income
- $23,326
- − Mortgage interest
- −$6,666
- − Property taxes
- −$2,424
- − Insurance
- −$595
- − Repairs & maintenance
- −$1,866
- − Management
- −$1,866
- − HOA
- −$5,988
- − Depreciation
- −$3,462
- Taxable income
- $460
- Est. tax owed @ 24.0%
- −$110
- After-tax cash flow
- $1,822/yr
For passive investors: Depreciation is non-cash, so a rental often shows a tax loss while cash-flowing — sheltering income. Rental losses are passive: they offset passive income freely, and up to $25,000/yr can offset ordinary (W-2) income if you actively participate and your MAGI is under $100k (phasing out to $0 by $150k); unused losses carry forward. On sale, claimed depreciation is recaptured at up to 25%, and gains may owe capital-gains tax (a 1031 exchange can defer both). Figures are a year-1 estimate at your 24.0% rate — not tax advice; consult a CPA.
Schools (NCES district)
- District
- Palm Beach
- NCES district ID
- 1201500
- Math proficiency
- 46% ▼ -16.00%
- Reading proficiency
- 53% ▼ -4.00%
- Median HH income
- $53,943
- Composite
- 42.72/100
- National rank
- #3160
- State rank
- #34 of 73 in FL
Livability — Greenacres
- Score
- 69/100
- State rank
- #490
- US rank
- #9008
Category grades
Schools grade is shown separately in the Schools card above.
Census & demographics
- Census place
- Greenacres, FL
- County
- Palm Beach County · 1,438,312 people
- City population
- 65,478
- Metro
- Miami-Fort Lauderdale-Pompano Beach, FL
- Population (ZIP)
- 65,478
- Household income
- $73,865
- Rent vs Own
- Severe rent burden
- 1466.0
Population outlook (Palm Beach County) Hauer SSP2
- Today (2025)
- 1,637,487 people
- By 2030
- 1,743,255 · +6.5%
- By 2040
- 1,948,712 · +19.0%
- By 2050
- 2,132,979 · +30.3%
- By 2075
- 2,530,027 · +54.5%
- By 2100
- 2,706,979 · +65.3%
Race, ethnicity, and origin ACS 2023
- Neighborhood character
- Diverse neighborhood (Simpson 0.70)
- Race & ethnicity
- Hispanic / Latino 38% Black 29% White 27% Two or more races 11% Asian 4%
- Hispanic origin (detail)
- Mexican 8% Puerto Rican 6% Cuban 5% Dominican 2%
- Common ancestry
- Hispanic 15% Romanian 1% Slovak 1%
- Foreign-born
- 39% · Canada, Jamaica, China
- Languages at home
- 45% English-only · Spanish 32% French/Haitian/Cajun 17% Other Indo-European 2%
Political lean MEDSL · Palm Beach
- 2024 margin
- Toss-up / Even · D 50.0% · R 49.2%
- 2008→2024 swing
- -22.1pp toward R · 2008: 22.9pp · 2024: 0.8pp
- All cycles
- 2024: D+0.8 2020: D+12.8 2016: D+15.3 2012: D+17.0 2008: D+22.9
Not yet ingested
- Civics
- —
Market trends
- HPI YoY
- ▼ -175.33%
- Current HPI
- 392.055
- Rent YoY
- ▲ 1.33%
- Metro
- Miami-Fort Lauderdale-Pompano Beach, FL
- State GDP YoY
- ▲ 3.28%
- F500 in state
- 36
Industry mix (Fortune 500 HQ in FL)
| Industry | F500 HQs | Revenue |
|---|---|---|
| Industrial Technology | 2 | $29B |
|
||
| Insurance | 2 | $17B |
|
||
| Retail | 1 | $60B |
|
||
| Technology Distribution | 1 | $58B |
|
||
| Homebuilding | 1 | $35B |
|
||
| Technology Manufacturing | 1 | $35B |
|
||
Price history
+181.3% since first listed18 events — show timeline
- 2026-04-10 Price Changed $119,000 Beaches MLS
- 2025-04-25 Price Changed $125,000 Beaches MLS
- 2025-03-20 Listed $133,000 Beaches MLS
- 2025-02-01 Listing Removed — Beaches MLS
- 2025-02-01 Relisted — Beaches MLS
- 2025-01-31 Listing Removed — Beaches MLS
- 2024-09-03 Listed $175,000 Beaches MLS
- 2018-03-08 Sold (Public Records) $68,000 Public Records
- 2018-02-28 Sold (MLS) $68,000 Beaches MLS
- 2018-02-08 Contingent — Beaches MLS
- 2018-01-24 Listed $74,900 Beaches MLS
- 2011-03-28 Sold (Public Records) $52,000 Public Records
- 2001-03-10 Sold (Public Records) $36,500 Public Records
- 2001-01-31 Sold (MLS) $36,500 Beaches MLS
- 2000-11-13 Listing Removed — Beaches MLS
- 2000-06-05 Listed $37,900 Beaches MLS
- 1992-01-16 Sold (Public Records) $35,000 Public Records
- 1981-11-01 Sold (Public Records) $42,300 Public Records
Property tax history
+7.2%/yrLatest (2025): $2,424 · +5.9% YoY. Source: county tax records.
Cash-flow waterfall
monthlySold comps — $/sqft
last 12 mo · ≤1 miLoading sold comps…