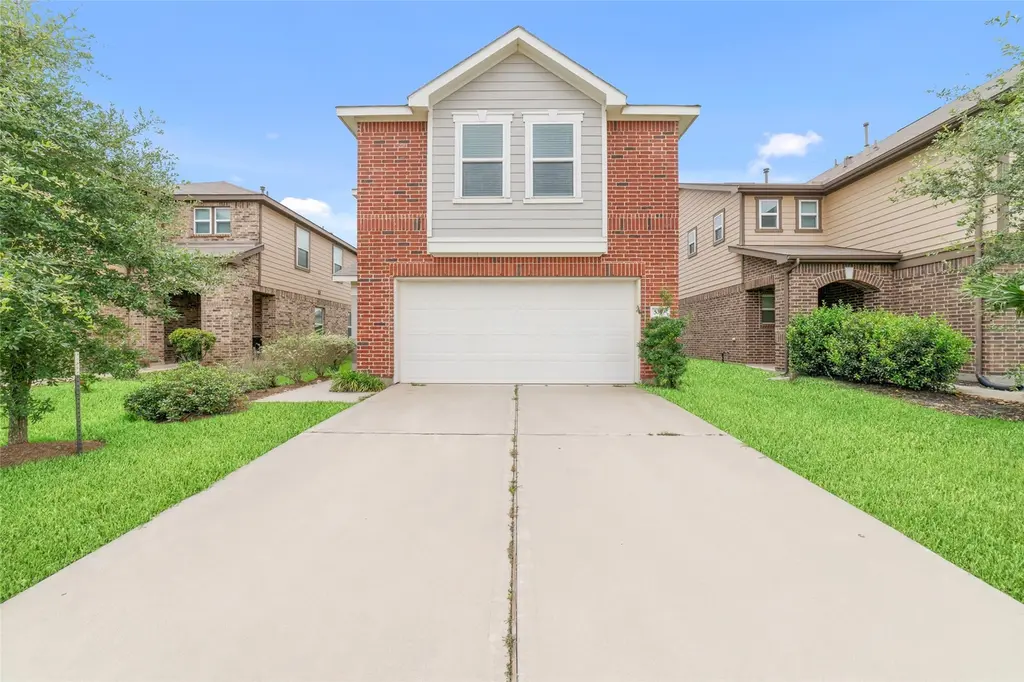
5319 Rose Trellis St · Houston, TX
Flood risk 4/10 · Minor
- FEMA flood zone
- X (unshaded)
- Chance of flooding over 30 yrs
- 0.21%
- Est. flood insurance / yr
- $507 – $1,088
Fire risk 3/10 · Minor
- Est. fire insurance / yr
- $1,222 – $2,270
Heat risk 9/10 · Severe
- Hot days now (above 111°F)
- 7 days/yr
- Hot days in 30 yrs
- 24 days/yr
Wind risk 9/10 · Severe
- Chance of severe wind over 30 yrs
- 99.0%
Air-quality risk 2/10 · Minimal
- Unhealthy air days now
- 1 days/yr
- Unhealthy air days in 30 yrs
- 1 days/yr
Risk factors via First Street. Map © Google.
Why this score? — see what drove the F grade
The composite is a weighted blend of 9 inputs, each scored 0–100. Each bar is that input's sub-score; the figure is the points it added to the 100-point composite (weight × sub-score).
- ARV discount +6.9/15.0
- Cash flow +6.7/30.0
- Schools +5.7/10.0
- Livability +3.7/5.0
- 1% rule +3.1/10.0
- Condition / age +2.5/5.0
- Rent growth +2.3/5.0
- DSCR +1.0/10.0
- Appreciation +0.0/10.0
$315,000
🖨 Deal sheet (PDF) 📄 Offer letter ✓ Due diligence
Listing remarks MLS
Experience the relaxed living of Katy with this beautiful home in the quiet community of Katy Manor. Boasting Italian tile throughout the first floor and laminate waterproof flooring on the 2nd, a dining room and patio for outdoor entertaining and leisure. This 4-bedroom, 2.5-bathroom property is a must-see! The kitchen comes equipped with beautiful granite countertops and tile backsplash, an oversized sink with an upgraded faucet, gas range, and breakfast bar. Melt away the stress in the spa-like primary suite, complete with a walk-in closet, dual vanities, a tub, and separate walk-in shower. Community comforts include a splash pad, pavilion, and more! Located near the Grand Parkway, residents enjoy easy access to Cypress and the Energy Corridor. Schools are zoned to Katy ISD. This home is exactly what you’ve been searching for – call today!
Key facts
- Spacious living area
- Private retreat
- Open concept layout
Tags
Property features AI
Finance
- Other: Seller disclosure available
- HOA & community: Association managed by King Property Management; Annual association fee of $465
Exterior
- Parking: Attached garage; 2 garage spaces
- Utilities: Public water; Public sewer
- Home design: Residential property; Built in 2019; Slab foundation
- Construction: Brick, cement siding, and vinyl siding exterior; Composition roof; Built in 2019; Slab foundation
- Exterior features: Subdivision lot; Lot approximately 5,000 sq ft
Interior
- Kitchen: Dishwasher; Disposal; Gas oven; Gas range; Microwave; Oven
- Bedrooms: Primary bedroom on second floor (approx. 14 x 13); Second-floor bedroom (approx. 11 x 10); Second-floor bedroom (approx. 10 x 10); Second-floor bedroom (approx. 10 x 10)
- Bathrooms: 2 full bathrooms; 1 half bathroom
- Heating & cooling: Central heating (gas); Central electric air conditioning
- Interior features: Granite counters; Ceiling fans; Programmable thermostat; Ventilation for indoor air quality; Insulation and energy-efficient thermostat
- Laundry & utility: Washer hookup; Electric dryer hookup; Gas dryer hookup
Neighborhood map
What this means for you Summary
Snapshot
- This is a 3-bed/2.5-bath single-family listed at $315k.
Deal economics
- At list price, monthly cash flow is $-502 ($-6k/yr) — negative.
- To cash-flow at today's rent, offer at most $226k (28.2% below list).
- To meet the 1% rule (rent ≥ 1% of price), the offer needs to be $254k (19.3% below list).
- Recommended offer: $226k (28.2% below list) — sets the bar for cash-flow.
- Cap rate 4.4% vs local median 3.2% in Houston — top-decile yield for the area; either an underpriced asset or a hidden risk that comps aren't pricing in. Stress-test before assuming the spread holds.
Location & tenants
- Location reads 74/100 on livability (#184 in TX, #4,771 nationally) — a middle-class / working-renter tenant base. Strengths: amenities A+, cost of living A+, housing A+; Watch: crime F.
- Katy ISD (suburban): math 61% / reading 63% proficiency, ranked #29 of 826 in TX (top 4%) — acceptable for families but not a draw, mixed tenant base, ~2y average lease.
- Zoned schools: Robert King El (math 41% / reading 44%, grade F, #1,313 of 4,322 statewide, top 31%, 981 students, 68% FRL); Katy J H (math 52% / reading 51%, grade C, #318 of 1,662 statewide, top 20%, 1,094 students, 53% FRL); Katy H S (math 62% / reading 74%, grade B, #150 of 1,632 statewide, top 10%, 3,330 students, 38% FRL) — zoned schools average 53% FRL vs 27% district-wide (25 pts higher); higher-poverty schools than district average — tighter screening recommended.
- Market conditions: Rents soft (-0.8%/yr); 2729 active listings in the ZIP; 5 comparable units currently listed for rent nearby; rentals lingering (median 46d on market — plan ~5-8 weeks vacancy on turnover, expect pricing pressure); 100% of comp listings sitting > 30 days — soft ceiling on asking rent; high-income renter base; 29,883 units permitted in Harris County in 2024 (8,621 in 5+ unit buildings).
Forward outlook
- Local home prices are declining (-3.0%/yr); year-one equity from $2k of loan paydown is wiped out by about $9k of value loss. Plan a longer hold.
- Harris County population projected at +47% by 2050 — long-run rental-demand tailwind backs the buy-and-hold thesis.
Negotiation context
- Only 2 days on market — expect competitive offers; lowballing is unlikely to land.
- 2 sale attempts since 6y ago with the ask held roughly flat each time — persistent listings suggest the price (not the market) is what's stuck; bring a comps-based counter.
Risks & watch-outs
- Watch-outs: property tax is 2.6% of price.
- Climate carrying-cost: severe wind risk, 99% chance of damaging wind over 30y; extreme-heat days projected 7→24/yr by 2055 (HVAC capex compounding) — expect insurance premiums to compound above CPI over the hold.
Questions for the listing agent
- What do current leases actually rent for vs. the listed asking? Can we see a recent rent roll and the last 12 months of T-12 income?
- Property tax is high relative to price — has the assessment been appealed recently, and will the sale trigger a re-assessment?
- What does the HOA fee cover, when was the last increase, and are there any pending special assessments or reserve-fund shortfalls?
- Is there a deadline driving the sale (1031 exchange, divorce, estate, relocation)? That informs how much negotiation room exists.
- Schools are D-rated, which usually means shorter tenancies and higher turnover. Who's the typical renter profile here, and what's been the actual vacancy rate?
- Crime grade is F in this area — have there been break-ins, vandalism, or insurance claims at this property in the last 3 years? What carrier currently insures it and at what premium?
- The area grade is low — what's the realistic commute time and amenity access for the typical tenant pool here? Any planned neighborhood developments (good or bad) we should know about?
- What's the average days-on-market for RENTAL listings here right now (not sales)? A rising rental-DOM trend means longer vacancies and softer asking-rent achievability than the comps imply.
- What's the recent tenant-quality profile in this submarket — average credit score on applications, eviction rate, late-payment / NSF rate, and stable-employment percentage? A property-management company in the area should have these aggregated.
- How much new for-sale + rental construction is in the pipeline within 1–3 miles? Heavy new supply typically softens prices + rents 12–24 months out; constrained supply supports both.
Investment metrics
- 1% rule
- 0.81% ✗
- Cap rate
- 4.38%
- Cash-on-cash
- -6.83%
- DSCR
- 0.70
- GRM
- 10.3
CMA / ARV
- ARV (on-the-fly)
- $311,060
- Comps found
- 12
Show comp detail 12 sales within ~0.75 mi
| Address | Dist | Beds/Ba | Sqft | Sold | Price | $/sf | Match |
|---|---|---|---|---|---|---|---|
| 25414 Whitehaven Gate St | 0.07mi | 3/2.5 | 2,248 (+9%) | 2mo | $299,900 | $133 | 80 |
| 5211 Crimson Flagg Ct | 0.35mi | 3/2.5 | 2,124 (+3%) | 2mo | $309,990 | $146 | 77 |
| 25639 Royal Catchfly Rd | 0.43mi | 4/2.5 (+1) | 2,040 (-1%) | 2mo | $284,900 | $140 | 72 |
| 5343 Marisol Cove Dr | 0.30mi | 4/2.5 (+1) | 2,176 (+6%) | 2mo | $295,000 | $136 | 70 |
| 5710 Pampus Prairie Rd | 0.50mi | 4/2.5 (+1) | 1,956 (-5%) | 4mo | $295,000 | $151 | 60 |
| 25531 Camilla Mae Ct | 0.50mi | 3/2.0 | 2,277 (+10%) | 1mo | $329,500 | $145 | 57 |
| 5810 Big Bluestem Ln | 0.68mi | 3/2.0 | 2,172 (+5%) | 2mo | $329,900 | $152 | 56 |
| 25918 Rustical Rd | 0.69mi | 4/3.0 (+1) | 1,975 (-4%) | 4mo | $285,000 | $144 | 51 |
| 24606 Brilliant Cir | 0.74mi | 3/2.0 | 2,227 (+8%) | 4mo | $449,000 | $202 | 47 |
| 24706 Ballad Dr | 0.73mi | 4/2.0 (+1) | 1,907 (-7%) | 1mo | $309,000 | $162 | 46 |
| 24751 Heirloom Ln | 0.63mi | 3/2.0 | 1,785 (-13%) | 1mo | $339,000 | $190 | 45 |
| 24630 Royal Pike Dr | 0.68mi | 3/2.0 | 1,805 (-12%) | 3mo | $295,000 | $163 | 43 |
Match score weights: distance 35% · size 25% · config 20% · recency 20%. Top-matched comps best support the ARV.
Projected returns pro-forma
-3.0% appreciation · 0.0% rent growth · sell at horizon
- IRR
- -32.1%
- Equity multiple
- -0.02×
- Total profit
- $-90,246
- Equity at exit
- $46,968
- IRR
- -63.3%
- Equity multiple
- -0.67×
- Total profit
- $-147,594
- Equity at exit
- $27,235
Cash invested: $88,200 (down + closing). Projections, not guarantees.
Landlord ↔ Tenant lean methodology
- Overall (STATE)
- 87 Strongly Landlord-Friendly
- State Texas
- 87 Strongly Landlord-Friendly · R+5
- County
- — inherits STATE
- City
- — inherits STATE
ZIP-level market 77493
- Rents YoY
- -0.8%
- Active inventory
- 2729
- Price-to-rent
- 10.3×
Monthly cashflow live
- Estimated rent
- $2,543 high interval (Pro) →
- Mortgage (P&I)
- −$1,652
- Tax from tax record
- −$689 /mo · $8,273/yr
- Insurance
- −$131
- HOA
- −$39
- Vacancy / Maint / Mgmt
- −$534
- Net cashflow
- $-502
Break-even live
Sensitivity live
| Price | -10% $-324 | -5% $-413 | +0% $-502 | +5% $-591 | +10% $-681 |
|---|---|---|---|---|---|
| Rent | -10% $-703 | -5% $-603 | +0% $-502 | +5% $-402 | +10% $-301 |
| Rate | -1.0pp $-344 | -0.5pp $-422 | base $-502 | +0.5pp $-584 | +1.0pp $-667 |
UW: 25.0% down · 7.5% · 30yr · 1.5% tax · 5.0% vac · 8.0% maint · 8.0% mgmt
Financing live
Cash to close
- Down payment
- $78,750
- Closing costs
- $9,450
- Reserves months
- —
- Total cash needed
- —
Loan-product check · same deal, 3 products live
Conventional
25% down · 7.5% · 30yr
- Down + closing
- —
- Monthly P&I
- —
- Monthly cashflow
- —
- DSCR
- —
- Eligible?
- —
Personal DTI + credit; lowest rate.
DSCR
20% down · 8.5% · 30yr
- Down + closing
- —
- Monthly P&I
- —
- Monthly cashflow
- —
- DSCR
- —
- Eligible?
- —
No personal income docs; deal must DSCR.
Hard money
10% down · 12.0% · 12mo
- Down + closing
- —
- Monthly P&I
- —
- Monthly cashflow
- —
- DSCR
- —
- Eligible?
- —
Short-term bridge; refi at stabilization.
Rent comps 5 comps
| Address | Beds | Baths | Sqft | Rent | $/sqft | DOM | Units | Dist |
|---|---|---|---|---|---|---|---|---|
| 5006 Sunway Dr Katy, TX | 4.0 | 3.0 | 2550 | $2,500 | $0.98 | 45d | 1 | 0.34mi |
| 5435 Baronet Dr Katy, TX | 4.0 | 4.0 | 2845 | $2,800 | $0.98 | 45d | 1 | 0.48mi |
| 24246 Palomino Sage Trl Katy, TX | 3.0 | 2.0 | 1860 | $2,305 | $1.24 | 46d | 1 | 1.20mi |
| 5007 Royal Amber Ln Katy, TX | 4.0 | 3.0 | 2270 | $1,975 | $0.87 | 45d | 1 | 1.20mi |
| 5022 Brewcastle Ln Katy, TX | 3.0 | 2.0 | 1524 | $2,100 | $1.38 | 45d | 1 | 1.31mi |
HOA detail
- Monthly dues
- $39 · $468/yr
- Likely covers
- watergas
Listing history 2 events
-
2026-06-21remarks 699-char remark
-
2026-06-21$315,000 Active 2 DOM
ⓘ Source: listings_history table (triggers on properties + properties_extension) + one-shot
backfill from property_details.listing_events for pre-trigger history.
Tax reassessment forecast TX · Resets to sale price
- Current annual tax
- $8,273 · $689/mo
- Projected year-2 tax
- $8,273 · $689/mo
- Expected delta
- $0/yr ($0/mo · 0.0%)
ⓘ Screening estimate from a state-policy table — verify with the county assessor before closing.
Climate risk First Street
- Flood 4/10 Moderate FEMA zone X (unshaded) · 21% chance over 30 yrs
- Wildfire 3/10 Moderate
- Heat 9/10 Extreme 7 d/yr ≥111°F today · 24 d/yr by 30 yrs out
- Wind 9/10 Extreme 99% chance of damaging wind over 30 yrs
- Air quality 2/10 Low 1 unhealthy d/yr today · 1 by 30 yrs out
Nearby sold comps map
Loading sold comps map…
Walkable amenities ~0.75 mi
Loading nearby amenities…
Taxation est. · year 1
- Rental income
- $30,520
- − Mortgage interest
- −$17,645
- − Property taxes
- −$8,273
- − Insurance
- −$1,575
- − Repairs & maintenance
- −$2,442
- − Management
- −$2,442
- − HOA
- −$468
- − Depreciation
- −$9,164
- Taxable loss
- −$11,488
- Est. tax savings @ 24.0%
- +$2,757
- After-tax cash flow
- $-3,271/yr
For passive investors: Depreciation is non-cash, so a rental often shows a tax loss while cash-flowing — sheltering income. Rental losses are passive: they offset passive income freely, and up to $25,000/yr can offset ordinary (W-2) income if you actively participate and your MAGI is under $100k (phasing out to $0 by $150k); unused losses carry forward. On sale, claimed depreciation is recaptured at up to 25%, and gains may owe capital-gains tax (a 1031 exchange can defer both). Figures are a year-1 estimate at your 24.0% rate — not tax advice; consult a CPA.
Schools (NCES district)
- District
- Katy ISD
- NCES district ID
- 4825170
- Math proficiency
- 61% ▼ -7.00%
- Reading proficiency
- 63% ▼ -3.00%
- Median HH income
- $90,312
- Composite
- 56.59/100
- National rank
- #1146
- State rank
- #29 of 826 in TX
Livability — Houston
- Score
- 74/100
- State rank
- #184
- US rank
- #4771
Category grades
Schools grade is shown separately in the Schools card above.
Census & demographics
- County
- Harris County · 4,702,590 people
- City population
- 413,575
- Metro
- Houston-The Woodlands-Sugar Land, TX
- Population (ZIP)
- 71,484
- Household income
- $118,464
- Rent vs Own
- Severe rent burden
- 913.0
Population outlook (Harris County) Hauer SSP2
- Today (2025)
- 5,571,493 people
- By 2030
- 6,089,821 · +9.3%
- By 2040
- 7,142,806 · +28.2%
- By 2050
- 8,185,864 · +46.9%
- By 2075
- 10,574,329 · +89.8%
- By 2100
- 12,109,958 · +117.4%
Race, ethnicity, and origin ACS 2023
- Neighborhood character
- Highly diverse neighborhood (Simpson 0.73)
- Race & ethnicity
- White 36% Hispanic / Latino 33% Two or more races 16% Black 15% Asian 12%
- Hispanic origin (detail)
- Mexican 20%
- Common ancestry
- Lithuanian 2% Slovak 1% Italian 1%
- Foreign-born
- 21% · Canada, Vietnam, Jamaica
- Languages at home
- 64% English-only · Spanish 22% Vietnamese 5% French/Haitian/Cajun 4%
Political lean MEDSL · Harris
- 2024 margin
- Lean D (+5.5) · D 52.0% · R 46.4% · Other 1.6%
- 2008→2024 swing
- +3.9pp toward D · 2008: 1.6pp · 2024: 5.5pp
- All cycles
- 2024: D+5.5 2020: D+13.3 2016: D+12.4 2012: D+0.1 2008: D+1.6
Not yet ingested
- Civics
- —
Market trends
- HPI YoY
- ▼ -140.65%
- Current HPI
- 233.1683
- Rent YoY
- ▼ -0.80%
- Metro
- Houston-The Woodlands-Sugar Land, TX
- State GDP YoY
- ▲ 3.95%
- F500 in state
- 110
Industry mix (Fortune 500 HQ in TX)
| Industry | F500 HQs | Revenue |
|---|---|---|
| Energy | 16 | $1,198B |
|
||
| Technology | 5 | $198B |
|
||
| Engineering / Construction | 4 | $72B |
|
||
| Energy Services | 3 | $60B |
|
||
| Utilities | 3 | $41B |
|
||
| Healthcare | 2 | $330B |
|
||
Price history
+34.0% since first listed7 events — show timeline
- 2026-06-19 Listed $315,000 HARMLS
- 2020-11-24 Sold (Public Records) — Public Records
- 2020-11-23 Sold (MLS) — HARMLS
- 2020-11-03 Pending — HARMLS
- 2020-10-22 Pending — HARMLS
- 2020-10-12 Price Changed $230,000 HARMLS
- 2020-09-24 Listed $235,000 HARMLS
Property tax history
+53.0%/yrLatest (2025): $8,273 · +0.6% YoY. Source: county tax records.
Cash-flow waterfall
monthlySold comps — $/sqft
last 12 mo · ≤1 miLoading sold comps…