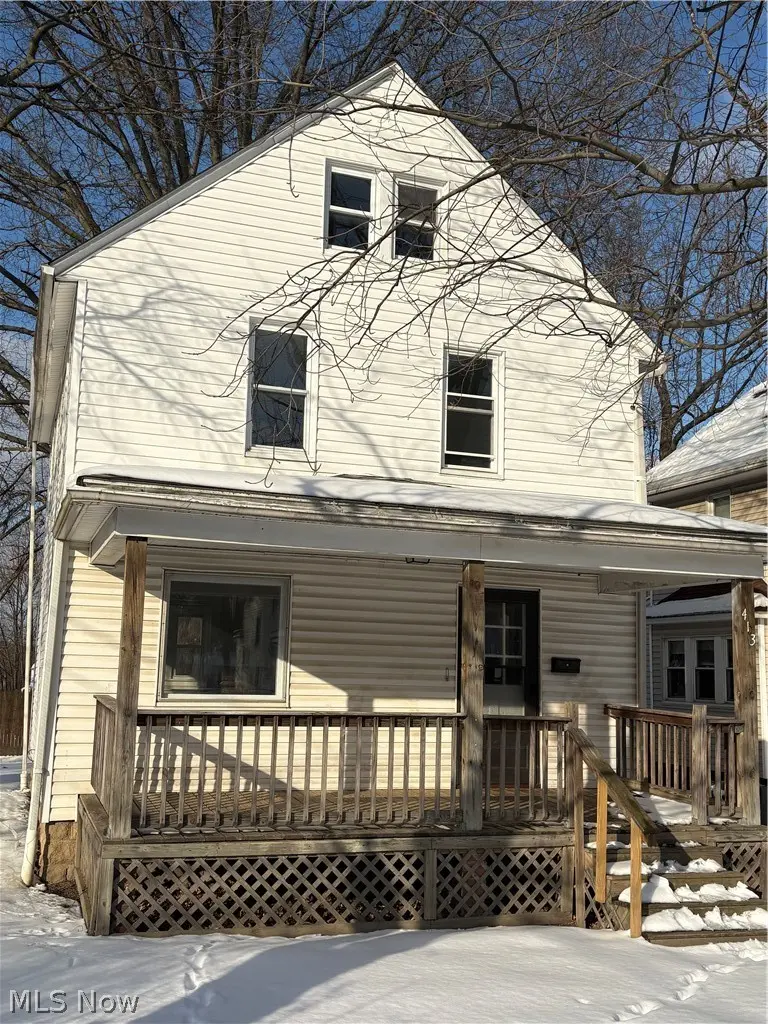
413 Stanton Ave · Akron, OH
Flood risk 1/10 · Minimal
- FEMA flood zone
- X (unshaded)
- Chance of flooding over 30 yrs
- 0.0%
- Est. flood insurance / yr
- $473 – $860
Fire risk 1/10 · Minimal
- Est. fire insurance / yr
- $713 – $1,323
Heat risk 3/10 · Minor
- Hot days now (above 96°F)
- 7 days/yr
- Hot days in 30 yrs
- 17 days/yr
Wind risk 1/10 · Minimal
- Chance of severe wind over 30 yrs
- —
Air-quality risk 3/10 · Minor
- Unhealthy air days now
- 2 days/yr
- Unhealthy air days in 30 yrs
- 4 days/yr
Risk factors via First Street. Map © Google.
Why this score? — see what drove the C- grade
The composite is a weighted blend of 9 inputs, each scored 0–100. Each bar is that input's sub-score; the figure is the points it added to the 100-point composite (weight × sub-score).
- Cash flow +25.9/30.0
- DSCR +8.7/10.0
- 1% rule +6.9/10.0
- Livability +4.0/5.0
- Rent growth +3.7/5.0
- Condition / age +2.5/5.0
- Schools +2.1/10.0
- ARV discount +0.0/15.0
- Appreciation +0.0/10.0
$110,000
🖨 Deal sheet 📄 Offer letter ✓ Due diligence
Listing remarks MLS
Charming South Akron two-story on a spacious corner lot featuring 3 bedrooms, 1 full bath, and a bonus finished attic space for storage or flexible use. Enjoy the covered front porch, welcoming living room with decorative fireplace, and dining room with built-in storage. The kitchen includes a stove and refrigerator and connects to the rear of the home with off-street parking and a driveway off Wilbur Ave. A partially fenced yard offers added privacy. Upstairs are three bedrooms and a full bath. Basement with washer/dryer hookups.
Key facts
- Covered front porch
- Decorative fireplace
- Finished attic space
Tags
Neighborhood map
What this means for you Summary
Snapshot
- This is a 3-bed/1.0-bath single-family listed at $110k.
Deal economics
- At list price, monthly cash flow is $269 ($3k/yr) — positive.
- The deal already cash-flows at list — no discount required.
- Meets the 1% rule at list price ($1k rent vs $110k).
- Recommended offer: $97k (12.0% below list) — sets the bar for market timing.
- Cap rate 9.2% vs local median 6.6% in Akron — top-decile yield for the area; either an underpriced asset or a hidden risk that comps aren't pricing in. Stress-test before assuming the spread holds.
Location & tenants
- Location reads 81/100 on livability (#104 in OH, #1,591 nationally) — a professional / high-income tenant draw. Strengths: amenities A+, commute A+, cost of living A+; Watch: crime F, employment F.
- Akron City (urban): math 22% / reading 30% proficiency, ranked #602 of 656 in OH (top 92%) — low school quality limits family demand, transient renter base, plan for 1-2y turnover; 66% free/reduced lunch — lower-income household profile, screen leases tightly.
- Market conditions: Rents rising fast (+4.6%/yr); 83 active listings in the ZIP; 40 comparable units currently listed for rent nearby; rentals lingering (median 44d on market — plan ~5-8 weeks vacancy on turnover, expect pricing pressure); 58% of comp listings sitting > 30 days — soft ceiling on asking rent; 1,114 units permitted in Summit County in 2024 (397 in 5+ unit buildings).
- This rent runs 31% of the median local income ($51k/yr) — at the standard rent-burdened threshold; future hikes will face affordability resistance.
Forward outlook
- Local home prices are declining (-3.0%/yr); year-one equity from $761 of loan paydown is wiped out by about $3k of value loss. Plan a longer hold.
- Summit County population projected to shrink 6% by 2050 — rents likely to lag national; underwrite the cash flow, not the appreciation.
- At projected returns (-3.0% appreciation + 4.6% rent growth), your $31k cash investment doubles in ~9 years — after that, you're playing with house money.
Negotiation context
- It's been on market 125 days — a 12% lower offer ($97k) is reasonable based on typical stale-listing flexibility.
- 13 sale attempts since 29y ago; this cycle's ask has dropped $10k (8%) from the opening price — seller is motivated, your offer sets the floor, not the list.
- Current owner paid $88k; 25% above their basis — modest negotiation headroom, anchor on the comps not their cost.
Risks & watch-outs
- Watch-outs: built in 1924 — expect roof / HVAC / electrical / plumbing capex.
Questions for the listing agent
- It's been on market 125 days. Have you received any prior offers? Is the seller open to a 12% concession, seller financing, or rate buy-down credit?
- Built in 1924 — when were the roof, HVAC, electrical panel, plumbing, and water heater last replaced?
- Why hasn't it sold? Are there any deal-killer items the seller is aware of (foundation, flood, title, zoning, code violations)?
- Is there a deadline driving the sale (1031 exchange, divorce, estate, relocation)? That informs how much negotiation room exists.
- Crime grade is F in this area — have there been break-ins, vandalism, or insurance claims at this property in the last 3 years? What carrier currently insures it and at what premium?
- What's the average days-on-market for RENTAL listings here right now (not sales)? A rising rental-DOM trend means longer vacancies and softer asking-rent achievability than the comps imply.
- What's the recent tenant-quality profile in this submarket — average credit score on applications, eviction rate, late-payment / NSF rate, and stable-employment percentage? A property-management company in the area should have these aggregated.
- How much new for-sale + rental construction is in the pipeline within 1–3 miles? Heavy new supply typically softens prices + rents 12–24 months out; constrained supply supports both.
Investment metrics
- 1% rule
- 1.19% ✓
- Cap rate
- 9.23%
- Cash-on-cash
- 10.50%
- DSCR
- 1.47
- GRM
- 7.0
CMA / ARV
- ARV (median comp)
- $79,679
- List price
- $110,000
- Delta
- 38.05%
- Verdict
- OVERPRICED
- Comps
- 20 within 1.0 mi
Show comp detail 12 sales within ~0.75 mi
| Address | Dist | Beds/Ba | Sqft | Sold | Price | $/sf | Match |
|---|---|---|---|---|---|---|---|
| 586 Morgan Ave | 0.36mi | 3/1.0 | 1,276 (+0%) | 3mo | $70,050 | $55 | 81 |
| 1212 Tulip St | 0.34mi | 3/1.0 | 1,236 (-3%) | 2mo | $114,000 | $92 | 78 |
| 390 Cole Ave | 0.13mi | 3/1.0 | 1,104 (-13%) | 2mo | $110,000 | $100 | 70 |
| 885 Brown St | 0.40mi | 4/2.0 (+1) | 1,280 (+0%) | 2mo | $93,500 | $73 | 70 |
| 485 E Archwood Ave | 0.47mi | 3/1.0 | 1,204 (-5%) | 1mo | $101,000 | $84 | 69 |
| 521 E Archwood Ave | 0.51mi | 3/1.0 | 1,216 (-4%) | 2mo | $73,500 | $60 | 67 |
| 1222 Lily St | 0.31mi | 3/1.0 | 1,132 (-11%) | 2mo | $107,000 | $95 | 65 |
| 1215 Sherman St | 0.24mi | 3/1.0 | 1,100 (-14%) | 2mo | $134,500 | $122 | 65 |
| 1429 Bellows St | 0.69mi | 3/1.0 | 1,198 (-6%) | 3mo | $150,000 | $125 | 56 |
| 888 Beardsley St | 0.36mi | 3/2.0 | 1,453 (+14%) | 3mo | $92,000 | $63 | 53 |
| 1240 Tulip St | 0.39mi | 2/1.5 (-1) | 1,107 (-13%) | 1mo | $135,000 | $122 | 52 |
| 1281 Neptune Ave | 0.63mi | 3/2.0 | 1,172 (-8%) | 2mo | $120,000 | $102 | 52 |
Match score weights: distance 35% · size 25% · config 20% · recency 20%. Top-matched comps best support the ARV.
Projected returns pro-forma
-3.0% appreciation · 4.62% rent growth · sell at horizon
- IRR
- 1.3%
- Equity multiple
- 1.05×
- Total profit
- $1,534
- Equity at exit
- $16,401
- IRR
- 12.5%
- Equity multiple
- 2.06×
- Total profit
- $32,755
- Equity at exit
- $9,511
Cash invested: $30,800 (down + closing). Projections, not guarantees.
Landlord ↔ Tenant lean methodology
- Overall (STATE)
- 73 Landlord-Friendly
- State Ohio
- 73 Landlord-Friendly · R+6
- County
- — inherits STATE
- City
- — inherits STATE
ZIP-level market 44301
- Home prices YoY
- -25.7%
- Rents YoY
- 4.6%
- Active inventory
- 83
- Price-to-rent
- 7.0×
Monthly cashflow live
- Estimated rent
- $1,313 high interval (Pro) →
- Mortgage (P&I)
- −$577
- Tax from tax record
- −$145 /mo · $1,740/yr
- Insurance
- −$46
- HOA
- −$0
- Vacancy / Maint / Mgmt
- −$276
- Net cashflow
- $269
Break-even live
UW: 25.0% down · 7.5% · 30yr · 1.5% tax · 5.0% vac · 8.0% maint · 8.0% mgmt
Financing live
Cash to close
- Down payment
- $27,500
- Closing costs
- $3,300
- Reserves months
- —
- Total cash needed
- —
Loan-product check · same deal, 3 products live
Conventional
25% down · 7.5% · 30yr
- Down + closing
- —
- Monthly P&I
- —
- Monthly cashflow
- —
- DSCR
- —
- Eligible?
- —
Personal DTI + credit; lowest rate.
DSCR
20% down · 8.5% · 30yr
- Down + closing
- —
- Monthly P&I
- —
- Monthly cashflow
- —
- DSCR
- —
- Eligible?
- —
No personal income docs; deal must DSCR.
Hard money
10% down · 12.0% · 12mo
- Down + closing
- —
- Monthly P&I
- —
- Monthly cashflow
- —
- DSCR
- —
- Eligible?
- —
Short-term bridge; refi at stabilization.
Rent comps 40 comps
| Address | Beds | Baths | Sqft | Rent | $/sqft | DOM | Units | Dist |
|---|---|---|---|---|---|---|---|---|
| 1028 Kling St Akron, OH | 4.0 | 2.0 | 1500 | $1,450 | $0.97 | 43d | 1 | 0.10mi |
| 466 Adkins Ave Akron, OH | 4.0 | 1.5 | 1800 | $1,450 | $0.81 | 43d | 1 | 0.13mi |
| 1012 Brown St Akron, OH | 4.0 | 2.0 | 1518 | $1,295 | $0.85 | 43d | 1 | 0.21mi |
| 1200 Girard St Akron, OH | 3.0 | 2.0 | 1438 | $1,100 | $0.76 | 14d | 1 | 0.27mi |
| 907 Kling St Akron, OH | 3.0 | 1.0 | 1248 | $1,250 | $1.00 | 14d | 1 | 0.33mi |
| 1085 Herberich Ave Akron, OH | 4.0 | 1.0 | 1350 | $1,400 | $1.04 | 43d | 1 | 0.33mi |
| 1114 Herberich Ave Akron, OH | 4.0 | 1.0 | 1308 | $1,200 | $0.92 | 43d | 1 | 0.34mi |
| 1036 Neptune Ave Akron, OH | 3.0 | 1.0 | 1000 | $1,350 | $1.35 | 43d | 1 | 0.36mi |
| 1040 Neptune Ave Akron, OH | 4.0 | 1.0 | 1400 | $1,300 | $0.93 | 43d | 1 | 0.36mi |
| 1139 Marcy St Akron, OH | 4.0 | 1.5 | 1300 | $1,300 | $1.00 | 43d | 1 | 0.38mi |
| 979 Neptune Ave Akron, OH | 3.0 | 1.0 | 1248 | $1,250 | $1.00 | 23d | 1 | 0.39mi |
| 885 Brown St Akron, OH | 4.0 | 2.0 | 1280 | $1,400 | $1.09 | 23d | 1 | 0.39mi |
| 1102 Neptune Ave Akron, OH | 3.0 | 1.0 | 1000 | $1,200 | $1.20 | 43d | 1 | 0.40mi |
| 1282 Andrus St Akron, OH | 4.0 | 1.0 | 1242 | $1,195 | $0.96 | 43d | 1 | 0.42mi |
| 629 Morgan Ave Akron, OH | 2.0 | 1.0 | 960 | $1,200 | $1.25 | 43d | 1 | 0.44mi |
| 1298 Bellows St Akron, OH | 3.0 | 1.0 | 1300 | $1,250 | $0.96 | 43d | 1 | 0.50mi |
| 1368 Moore St Akron, OH | 4.0 | 1.0 | 1575 | $1,300 | $0.83 | 43d | 1 | 0.53mi |
| 796 Brown St Akron, OH | 4.0 | 2.0 | 1200 | $900 | $0.75 | 43d | 1 | 0.53mi |
| 373 N Firestone Blvd Akron, OH | 4.0 | 1.5 | 1590 | $1,550 | $0.97 | 43d | 1 | 0.57mi |
| 147 Brighton Dr Akron, OH | 3.0 | 1.0 | 1040 | $1,350 | $1.30 | 23d | 1 | 0.57mi |
| 94 Brighton Dr Akron, OH | 3.0 | 1.0 | 1000 | $1,100 | $1.10 | 43d | 1 | 0.66mi |
| 67 E Archwood Ave Unit B Akron, OH | 4.0 | 1.0 | 1200 | $1,050 | $0.88 | 43d | 1 | 0.71mi |
| 67 E Archwood Ave Unit A Akron, OH | 2.0 | 1.0 | 1000 | $850 | $0.85 | 43d | 1 | 0.71mi |
| 1313 Coventry St Akron, OH | 2.0 | 1.0 | 913 | $1,250 | $1.37 | 14d | 1 | 0.72mi |
| 374 E Voris St Akron, OH | 3.0 | 1.0 | 876 | $1,150 | $1.31 | 23d | 1 | 0.73mi |
| 78 E Mapledale Ave Akron, OH | 4.0 | 1.5 | 1600 | $1,500 | $0.94 | 14d | 1 | 0.75mi |
| 662 Sumner St Akron, OH | 2.0 | 1.0 | 915 | $999 | $1.09 | 43d | 1 | 0.85mi |
| 658 Sumner St Akron, OH | 2.0 | 1.0 | 915 | $999 | $1.09 | 43d | 1 | 0.86mi |
| 44 E Brookside Ave Akron, OH | 2.0 | 1.0 | 1762 | $900 | $0.51 | 14d | 1 | 0.87mi |
| 1204 Inman St Akron, OH | 3.0 | 1.0 | 1080 | $1,200 | $1.11 | 23d | 1 | 0.88mi |
| 600 Sherman St Akron, OH | 4.0 | 1.0–2.0 | 824 | $1,400 | $1.70 | 14d | 14 | 0.95mi |
| 902 Cole Ave Akron, OH | 3.0 | 1.0 | 984 | $1,050 | $1.07 | 14d | 1 | 0.97mi |
| 548 Spicer St Akron, OH | 4.0 | 2.0 | 1487 | $1,100 | $0.74 | 23d | 1 | 0.97mi |
| 288 Cross St Akron, OH | 4.0 | 2.0 | 1512 | $1,295 | $0.86 | 43d | 1 | 1.00mi |
| 566 Sumner St Akron, OH | 4.0 | 1.0 | 1170 | $1,200 | $1.03 | 43d | 1 | 1.03mi |
| 356 Rankin St Akron, OH | 4.0 | 1.5 | 1186 | $1,197 | $1.01 | 23d | 1 | 1.04mi |
| 764 Lindsay Ave Akron, OH | 3.0 | 1.0 | 1000 | $1,295 | $1.29 | 14d | 1 | 1.08mi |
| 418 Power St Akron, OH | 3.0 | 1.0 | 1000 | $999 | $1.00 | 23d | 1 | 1.10mi |
| 420 Power St Akron, OH | 3.0 | 1.0 | 900 | $800 | $0.89 | 23d | 1 | 1.11mi |
| 516 Whitney Ave Akron, OH | 4.0 | 2.0 | 1676 | $1,500 | $0.89 | 43d | 1 | 1.12mi |
Listing history 49 events
-
2026-06-18days on market $110,000 Active 125 DOM
-
2026-06-17days on market $110,000 Active 124 DOM
-
2026-06-16days on market $110,000 Active 123 DOM
-
2026-06-15days on market $110,000 Active 122 DOM
-
2026-06-14days on market $110,000 Active 120 DOM
-
2026-06-13days on market $110,000 Active 119 DOM
-
2026-06-10days on market $110,000 Active 117 DOM
-
2026-06-09days on market $110,000 Active 116 DOM
-
2026-06-08days on market $110,000 Active 115 DOM
-
2026-06-07days on market $110,000 Active 114 DOM
-
2026-06-05days on market $110,000 Active 111 DOM
-
2026-06-03days on market $110,000 Active 110 DOM
-
2026-06-02days on market $110,000 Active 109 DOM
-
2026-06-01days on market $110,000 Active 108 DOM
-
2026-05-31days on market $110,000 Active 107 DOM
-
2026-05-31days on market $110,000 Active 106 DOM
-
2026-04-24price $110,000 536-char remark
Show marketing remark (536 chars)
Charming South Akron two-story on a spacious corner lot featuring 3 bedrooms, 1 full bath, and a bonus finished attic space for storage or flexible use. Enjoy the covered front porch, welcoming living room with decorative fireplace, and dining room with built-in storage. The kitchen includes a stove and refrigerator and connects to the rear of the home with off-street parking and a driveway off Wilbur Ave. A partially fenced yard offers added privacy. Upstairs are three bedrooms and a full bath. Basement with washer/dryer hookups.
-
2026-02-21historical $1,050
-
2026-02-13$120,000 Active 536-char remark
Show marketing remark (536 chars)
Charming South Akron two-story on a spacious corner lot featuring 3 bedrooms, 1 full bath, and a bonus finished attic space for storage or flexible use. Enjoy the covered front porch, welcoming living room with decorative fireplace, and dining room with built-in storage. The kitchen includes a stove and refrigerator and connects to the rear of the home with off-street parking and a driveway off Wilbur Ave. A partially fenced yard offers added privacy. Upstairs are three bedrooms and a full bath. Basement with washer/dryer hookups.
-
2026-01-15price $1,050
-
2025-12-10$1,080
-
2025-06-13historical $1,080
-
2025-01-21$1,080
-
2024-11-18soldstatus $88,000
-
2023-10-05historical $1,000
-
2023-07-11$1,000
-
2019-01-31soldstatus $20,000 Sold 417-char remark
Show marketing remark (417 chars)
Opportunity knocks, this investment property has a great rental history. The owner has owned the property for seven years. Its currently rented for 675 per month through AMHA and the tenant pays all utilities. Some updates include replacement windows, roof, vinyl siding, kitchen, and bathroom. Call agent/owner today for a showing. All the work is done buy this income property and immediately start collecting rent.
-
2019-01-31soldstatus $20,000
Show marketing remark (417 chars)
Opportunity knocks, this investment property has a great rental history. The owner has owned the property for seven years. Its currently rented for 675 per month through AMHA and the tenant pays all utilities. Some updates include replacement windows, roof, vinyl siding, kitchen, and bathroom. Call agent/owner today for a showing. All the work is done buy this income property and immediately start collecting rent.
-
2018-12-05status Pending 417-char remark
Show marketing remark (417 chars)
Opportunity knocks, this investment property has a great rental history. The owner has owned the property for seven years. Its currently rented for 675 per month through AMHA and the tenant pays all utilities. Some updates include replacement windows, roof, vinyl siding, kitchen, and bathroom. Call agent/owner today for a showing. All the work is done buy this income property and immediately start collecting rent.
-
2018-12-05historical 417-char remark
Show marketing remark (417 chars)
Opportunity knocks, this investment property has a great rental history. The owner has owned the property for seven years. Its currently rented for 675 per month through AMHA and the tenant pays all utilities. Some updates include replacement windows, roof, vinyl siding, kitchen, and bathroom. Call agent/owner today for a showing. All the work is done buy this income property and immediately start collecting rent.
-
2018-10-19$22,900 Active 417-char remark
Show marketing remark (417 chars)
Opportunity knocks, this investment property has a great rental history. The owner has owned the property for seven years. Its currently rented for 675 per month through AMHA and the tenant pays all utilities. Some updates include replacement windows, roof, vinyl siding, kitchen, and bathroom. Call agent/owner today for a showing. All the work is done buy this income property and immediately start collecting rent.
-
2010-02-26soldstatus $14,900
-
2010-01-31historical
-
2009-09-01$19,900
-
2008-10-21historical
-
2008-04-21$47,500
-
2005-02-10soldstatus $70,000
-
2005-02-09soldstatus $70,000
-
2004-09-30$69,900
-
2004-09-28historical
-
2004-03-28$79,900
-
2003-09-24historical
-
2003-03-24$49,900
-
2003-01-22historical
-
2003-01-22historical
-
2002-07-23$54,900
-
2002-07-22$54,900
-
1997-06-09soldstatus $19,000
-
1997-03-02$24,900
ⓘ Source: listings_history table (triggers on properties + properties_extension) + one-shot
backfill from property_details.listing_events for pre-trigger history.
Tax reassessment forecast OH · Partial reset (capped growth)
- Current annual tax
- $1,740 · $145/mo
- Projected year-2 tax
- $1,740 · $145/mo
- Expected delta
- $0/yr ($0/mo · 0.0%)
ⓘ Screening estimate from a state-policy table — verify with the county assessor before closing.
Climate risk First Street
- Flood 1/10 Low FEMA zone X (unshaded) · 0% chance over 30 yrs
- Wildfire 1/10 Low
- Heat 3/10 Moderate 7 d/yr ≥96°F today · 17 d/yr by 30 yrs out
- Wind 1/10 Low
- Air quality 3/10 Moderate 2 unhealthy d/yr today · 4 by 30 yrs out
Nearby sold comps map
Loading sold comps map…
Walkable amenities ~0.75 mi
Loading nearby amenities…
Taxation est. · year 1
- Rental income
- $15,754
- − Mortgage interest
- −$6,162
- − Property taxes
- −$1,740
- − Insurance
- −$550
- − Repairs & maintenance
- −$1,260
- − Management
- −$1,260
- − Depreciation
- −$3,200
- Taxable income
- $1,581
- Est. tax owed @ 24.0%
- −$380
- After-tax cash flow
- $2,854/yr
For passive investors: Depreciation is non-cash, so a rental often shows a tax loss while cash-flowing — sheltering income. Rental losses are passive: they offset passive income freely, and up to $25,000/yr can offset ordinary (W-2) income if you actively participate and your MAGI is under $100k (phasing out to $0 by $150k); unused losses carry forward. On sale, claimed depreciation is recaptured at up to 25%, and gains may owe capital-gains tax (a 1031 exchange can defer both). Figures are a year-1 estimate at your 24.0% rate — not tax advice; consult a CPA.
Schools (NCES district)
- District
- Akron City
- NCES district ID
- 3904348
- Math proficiency
- 22% ▼ -17.00%
- Reading proficiency
- 30% ▼ -12.00%
- Median HH income
- $33,811
- Composite
- 21.31/100
- National rank
- #8383
- State rank
- #602 of 656 in OH
Livability — Akron
- Score
- 81/100
- State rank
- #104
- US rank
- #1591
Category grades
Schools grade is shown separately in the Schools card above.
Census & demographics
- Census place
- Akron, OH
- County
- Summit County · 440,783 people
- City population
- 174,375
- Metro
- Akron, OH
- Population (ZIP)
- 13,668
- Household income
- $51,321
- Rent vs Own
- Severe rent burden
- 446.0
Population outlook (Summit County) Hauer SSP2
- Today (2025)
- 546,583 people
- By 2030
- 544,028 · -0.5%
- By 2040
- 531,363 · -2.8%
- By 2050
- 514,923 · -5.8%
- By 2075
- 481,765 · -11.9%
- By 2100
- 432,265 · -20.9%
Race, ethnicity, and origin ACS 2023
- Neighborhood character
- Diverse neighborhood (Simpson 0.63)
- Race & ethnicity
- White 52% Black 30% Two or more races 11% Hispanic / Latino 5% Asian 2%
- Hispanic origin (detail)
- Mexican 3%
- Common ancestry
- Romanian 4% Lithuanian 2% Serbian 1%
- Foreign-born
- 6% · Canada
- Languages at home
- 92% English-only · Spanish 4% Other Indo-European 1% Other Asian/Pacific 1%
Political lean MEDSL · Summit
- 2024 margin
- Lean D (+7.0) · D 53.0% · R 46.0%
- 2008→2024 swing
- -9.6pp toward R · 2008: 16.6pp · 2024: 7.0pp
- All cycles
- 2024: D+7.0 2020: D+9.6 2016: D+8.2 2012: D+14.8 2008: D+16.6
Not yet ingested
- Civics
- —
Market trends
- HPI YoY
- ▼ -74.09%
- Current HPI
- 213.697
- Rent YoY
- ▲ 4.62%
- Metro
- Akron, OH
- State GDP YoY
- ▲ 1.98%
- F500 in state
- 48
Industry mix (Fortune 500 HQ in OH)
| Industry | F500 HQs | Revenue |
|---|---|---|
| Insurance | 3 | $145B |
|
||
| Industrial Machinery | 3 | $49B |
|
||
| Financial Services | 3 | $24B |
|
||
| Consumer Goods | 2 | $93B |
|
||
| Aerospace / Defense | 2 | $47B |
|
||
| Utilities | 2 | $33B |
|
||
Price history
+341.8% since first listed33 events — show timeline
- 2026-04-24 Price Changed $110,000 MLSNOW
- 2026-02-21 Rental Removed $1,050 APPFOLIO
- 2026-02-13 Listed $120,000 MLSNOW
- 2026-01-15 Price Changed $1,050 APPFOLIO
- 2025-12-10 Listed for Rent $1,080 APPFOLIO
- 2025-06-13 Rental Removed $1,080 PROPERTYWARE
- 2025-01-21 Listed for Rent $1,080 PROPERTYWARE
- 2024-11-18 Sold (Public Records) $88,000 Public Records
- 2023-10-05 Rental Removed $1,000 YESMLS
- 2023-07-11 Listed for Rent $1,000 YESMLS
- 2019-01-31 Sold (Public Records) $20,000 Public Records
- 2019-01-31 Sold (MLS) $20,000 MLSNOW
- 2018-12-05 Pending — MLSNOW
- 2018-12-05 Listing Removed — MLSNOW
- 2018-10-19 Listed $22,900 MLSNOW
- 2010-02-26 Sold (MLS) $14,900 MLSNOW
- 2010-01-31 Listing Removed — MLSNOW
- 2009-09-01 Listed $19,900 MLSNOW
- 2008-10-21 Listing Removed — MLSNOW
- 2008-04-21 Listed $47,500 MLSNOW
- 2005-02-10 Sold (MLS) $70,000 MLSNOW
- 2005-02-09 Sold (Public Records) $70,000 Public Records
- 2004-09-30 Listed $69,900 MLSNOW
- 2004-09-28 Listing Removed — MLSNOW
- 2004-03-28 Listed $79,900 MLSNOW
- 2003-09-24 Listing Removed — MLSNOW
- 2003-03-24 Listed $49,900 MLSNOW
- 2003-01-22 Listing Removed — MLSNOW
- 2003-01-22 Listing Removed — MLSNOW
- 2002-07-23 Listed $54,900 MLSNOW
- 2002-07-22 Listed $54,900 MLSNOW
- 1997-06-09 Sold (Public Records) $19,000 Public Records
- 1997-03-02 Listed $24,900 MLSNOW
Property tax history
+3.4%/yrLatest (2025): $1,740 · +20.8% YoY. Source: county tax records.
Cash-flow waterfall
monthlySold comps — $/sqft
last 12 mo · ≤1 miLoading sold comps…