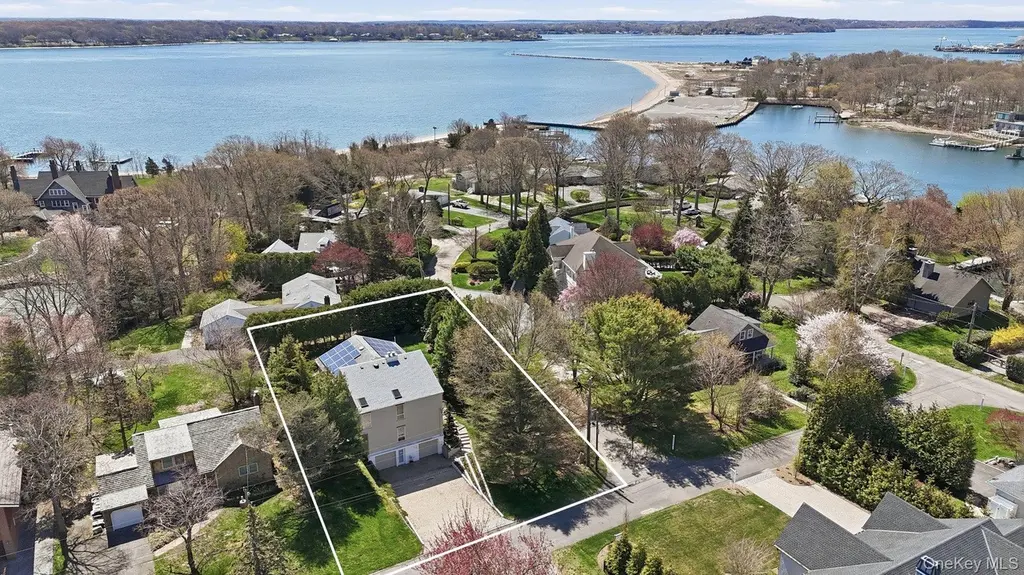
145 Osprey Nest Rd · Greenport West, NY
Flood risk 1/10 · Minimal
- FEMA flood zone
- X (unshaded)
- Chance of flooding over 30 yrs
- 0.0%
- Est. flood insurance / yr
- $473 – $860
Fire risk 1/10 · Minimal
- Est. fire insurance / yr
- $691 – $1,283
Heat risk 5/10 · Moderate
- Hot days now (above 90°F)
- 7 days/yr
- Hot days in 30 yrs
- 19 days/yr
Wind risk 8/10 · Major
- Chance of severe wind over 30 yrs
- 80.0%
Air-quality risk 2/10 · Minimal
- Unhealthy air days now
- 2 days/yr
- Unhealthy air days in 30 yrs
- 2 days/yr
Risk factors via First Street. Map © Google.
Why this score? — see what drove the B+ grade
The composite is a weighted blend of 9 inputs, each scored 0–100. Each bar is that input's sub-score; the figure is the points it added to the 100-point composite (weight × sub-score).
- Cash flow +30.0/30.0
- ARV discount +15.0/15.0
- 1% rule +10.0/10.0
- DSCR +10.0/10.0
- Schools +4.5/10.0
- Livability +2.9/5.0
- Rent growth +2.5/5.0
- Condition / age +2.5/5.0
- Appreciation +0.0/10.0
$1,500,000
🖨 Deal sheet (PDF) 📄 Offer letter ✓ Due diligence
Listing remarks
Newly Reduced Price! Welcome to 145 Osprey Nest Road, a gem nestled in the heart of the charming Cleaves Point Beach Community. This home, with its resort-like atmosphere, offers an enticing blend of comfort and convenience. As a member of the Community, this property affords use of a private Bay Beach, in addition to having a community marina with some private docks and mooring lots, in a protected inlet off the Peconic Bay. This spacious home boasts four bedrooms and three bathrooms, designed with a modern aesthetic and an open, airy layout. The primary suite offers a private retreat, while three additional guest bedrooms share a full bath. The home's generous windows and soaring ceiling
Key facts
- Private deeded dock
- Village of greenport
- Outdoor shower
Tags
Property features AI
Finance
- HOA & community: Part of Cleaves Point Beach Community association; Annual association fee of $450; Association amenities include powered boats allowed and other community features; Association fee covers common area maintenance and snow removal; Additional annual fee $450 (Annual Association Fee)
Exterior
- Parking: Attached garage and driveway; 2-car garage; No carport
- Security: Fire alarm; Smoke detectors
- Utilities: PSEG electric; Septic tank; Cable connected; Electricity connected; Water connected
- Home design: Single-family residence; Three or more levels; Measured living area
- Construction: Built with wood siding; Concrete perimeter foundation
- Exterior features: Wood siding; Corner lot; Landscaped grounds; Level lot; Near golf course; Near shops; Outdoor deck; Private outdoor pool (outdoor pool, other pool features); Garage(s) as other structures; No waterfront
Interior
- Kitchen: Granite counters; Open, eat-in kitchen; Electric oven and electric range; Microwave; Dishwasher; Refrigerator
- Bedrooms: Total of 8 rooms (includes bedrooms and living spaces)
- Flooring: Hardwood floors; Tile floors
- Bathrooms: 3 full bathrooms; Basement includes unfinished full bath access (basement present)
- Heating & cooling: Baseboard heating (oil); Central air conditioning; Wood-burning fireplace in living room
- Interior features: First-floor full bath; Ceiling fans; Eat-in kitchen; Granite counters; High ceilings; Open floorplan with open kitchen; Primary bathroom; Recessed lighting; Storage; Walk-through kitchen; Skylights; Wall of windows; Oversized windows; Deck
- Laundry & utility: Laundry room; Washer and dryer; Laundry located in bathroom (laundry on-bath option)
Neighborhood map
What this means for you Summary
Snapshot
- This is a 4-bed/3.0-bath single-family listed at $1.50M.
Deal economics
- At list price, monthly cash flow is $8k ($99k/yr) — positive.
- The deal already cash-flows at list — no discount required.
- Meets the 1% rule at list price ($22k rent vs $1.50M).
- Recommended offer: $1.46M (3.0% below list) — sets the bar for market timing.
- Cap rate 12.9% vs local median 8.1% in Greenport West — top-decile yield for the area; either an underpriced asset or a hidden risk that comps aren't pricing in. Stress-test before assuming the spread holds.
Location & tenants
- Location reads 58/100 on livability (#1,073 in NY) — a working-class tenant base; expect higher turnover. Strengths: crime A+, employment A+; Watch: amenities F, commute F, cost of living F.
- Greenport Union Free School District (town): math 55% / reading 45% proficiency, ranked #450 of 755 in NY (top 60%) — acceptable for families but not a draw, mixed tenant base, ~2y average lease.
- Zoned schools: Greenport Elementary School (math 47% / reading 62%, grade C, #908 of 2,108 statewide, top 46%, 339 students, 61% FRL); Greenport High School (math 52% / reading 54%, grade C-, #934 of 1,100 statewide, top 86%, 356 students, 63% FRL).
- Market conditions: 69 active listings in the ZIP; 11 comparable units currently listed for rent nearby; rentals lingering (median 46d on market — plan ~5-8 weeks vacancy on turnover, expect pricing pressure); 82% of comp listings sitting > 30 days — soft ceiling on asking rent; 1,366 units permitted in Suffolk County in 2024 (216 in 5+ unit buildings).
Forward outlook
- Local home prices are declining (-3.0%/yr); year-one equity from $10k of loan paydown is wiped out by about $45k of value loss. Plan a longer hold.
- Suffolk County population projected to shrink 5% by 2050 — rents likely to lag national; underwrite the cash flow, not the appreciation.
- At projected returns (-3.0% appreciation + 3.0% rent growth), your $420k cash investment doubles in ~6 years — after that, you're playing with house money.
Negotiation context
- It's been on market 58 days — a 3% lower offer ($1.46M) is reasonable based on typical stale-listing flexibility.
- Current owner paid $278k; list at $1.50M implies a 440% gain — meaningful room to come down on a strong offer.
Risks & watch-outs
- Climate carrying-cost: severe wind risk, 80% chance of damaging wind over 30y; extreme-heat days projected 7→19/yr by 2055 (HVAC capex compounding) — expect insurance premiums to compound above CPI over the hold.
Questions for the listing agent
- It's been on market 58 days. Have you received any prior offers? Is the seller open to a 3% concession, seller financing, or rate buy-down credit?
- What does the HOA fee cover, when was the last increase, and are there any pending special assessments or reserve-fund shortfalls?
- Is there a deadline driving the sale (1031 exchange, divorce, estate, relocation)? That informs how much negotiation room exists.
- Schools are D-rated, which usually means shorter tenancies and higher turnover. Who's the typical renter profile here, and what's been the actual vacancy rate?
- What's the average days-on-market for RENTAL listings here right now (not sales)? A rising rental-DOM trend means longer vacancies and softer asking-rent achievability than the comps imply.
- What's the recent tenant-quality profile in this submarket — average credit score on applications, eviction rate, late-payment / NSF rate, and stable-employment percentage? A property-management company in the area should have these aggregated.
- How much new for-sale + rental construction is in the pipeline within 1–3 miles? Heavy new supply typically softens prices + rents 12–24 months out; constrained supply supports both.
Investment metrics
- 1% rule
- 1.50% ✓
- Cap rate
- 12.92%
- Cash-on-cash
- 23.66%
- DSCR
- 2.05
- GRM
- 5.6
CMA / ARV
- ARV (median comp)
- $1,849,122
- List price
- $1,500,000
- Delta
- -18.88%
- Verdict
- UNDERPRICED
- Comps
- 14 within 1.0 mi
Show comp detail 5 sales within ~0.75 mi
| Address | Dist | Beds/Ba | Sqft | Sold | Price | $/sf | Match |
|---|---|---|---|---|---|---|---|
| 430 Snug Harbor Rd | 0.16mi | 3/4.0 (-1) | 2,455 (-3%) | 12mo | $1,900,000 | $774 | 69 |
| 165 Anglers Rd | 0.34mi | 4/4.0 | 2,650 (+5%) | 19mo | $1,450,000 | $547 | 56 |
| 2255 Old Orchard Rd | 0.73mi | 4/3.0 | 2,310 (-9%) | 12mo | $1,131,000 | $490 | 41 |
| 1117 Cedar Ln | 0.61mi | 4/2.0 | 2,200 (-13%) | 9mo | $2,000,000 | $909 | 39 |
| 3900 Route 25 | 0.41mi | 3/2.5 (-1) | 2,162 (-14%) | 19mo | $1,090,000 | $504 | 34 |
Match score weights: distance 35% · size 25% · config 20% · recency 20%. Top-matched comps best support the ARV.
Projected returns pro-forma
-3.0% appreciation · 3.0% rent growth · sell at horizon
- IRR
- 16.8%
- Equity multiple
- 1.68×
- Total profit
- $284,238
- Equity at exit
- $223,655
- IRR
- 25.3%
- Equity multiple
- 3.20×
- Total profit
- $925,873
- Equity at exit
- $129,693
Cash invested: $420,000 (down + closing). Projections, not guarantees.
Landlord ↔ Tenant lean methodology
- Overall (STATE)
- 15 Strongly Tenant-Friendly
- State New York
- 15 Strongly Tenant-Friendly · D+10
- County
- — inherits STATE
- City
- — inherits STATE
ZIP-level market 11944
- Home prices YoY
- -23.7%
- Active inventory
- 69
- Price-to-rent
- 5.6×
Monthly cashflow live
- Estimated rent
- $22,446 high interval (Pro) →
- Mortgage (P&I)
- −$7,866
- Tax from tax record
- −$921 /mo · $11,051/yr
- Insurance
- −$625
- HOA
- −$38
- Vacancy / Maint / Mgmt
- −$4,714
- Net cashflow
- $8,283
Break-even live
Sensitivity live
| Price | -10% $9,132 | -5% $8,707 | +0% $8,283 | +5% $7,858 | +10% $7,434 |
|---|---|---|---|---|---|
| Rent | -10% $6,509 | -5% $7,396 | +0% $8,283 | +5% $9,169 | +10% $10,056 |
| Rate | -1.0pp $9,038 | -0.5pp $8,664 | base $8,283 | +0.5pp $7,894 | +1.0pp $7,499 |
UW: 25.0% down · 7.5% · 30yr · 1.5% tax · 5.0% vac · 8.0% maint · 8.0% mgmt
Financing live
Cash to close
- Down payment
- $375,000
- Closing costs
- $45,000
- Reserves months
- —
- Total cash needed
- —
Loan-product check · same deal, 3 products live
Conventional
25% down · 7.5% · 30yr
- Down + closing
- —
- Monthly P&I
- —
- Monthly cashflow
- —
- DSCR
- —
- Eligible?
- —
Personal DTI + credit; lowest rate.
DSCR
20% down · 8.5% · 30yr
- Down + closing
- —
- Monthly P&I
- —
- Monthly cashflow
- —
- DSCR
- —
- Eligible?
- —
No personal income docs; deal must DSCR.
Hard money
10% down · 12.0% · 12mo
- Down + closing
- —
- Monthly P&I
- —
- Monthly cashflow
- —
- DSCR
- —
- Eligible?
- —
Short-term bridge; refi at stabilization.
Rent comps 11 comps
| Address | Beds | Baths | Sqft | Rent | $/sqft | DOM | Units | Dist |
|---|---|---|---|---|---|---|---|---|
| 580 South Ln East Marion, NY | 3.0 | 2.5 | 2000 | $20,000 | $10.00 | 21d | 1 | 0.88mi |
| 300 Marion Pl East Marion, NY | 3.0 | 2.0 | 1750 | $19,000 | $10.86 | 26d | 1 | 0.95mi |
| 485 Sutton Pl Greenport, NY | 4.0 | 2.5 | 2026 | $20,000 | $9.87 | 45d | 1 | 1.13mi |
| 312 5th Ave Greenport, NY | 4.0 | 2.0 | 1900 | $12,000 | $6.32 | 45d | 1 | 1.15mi |
| 580 Stars Rd East Marion, NY | 4.0 | 3.5 | 2700 | $35,000 | $12.96 | 45d | 1 | 1.21mi |
| 3045 Rocky Point Rd East Marion, NY | 3.0 | 2.0 | 2025 | $12,000 | $5.93 | 45d | 1 | 1.25mi |
| 950 Tasker Ln Greenport, NY | 4.0 | 3.5 | 3500 | $36,000 | $10.29 | 45d | 1 | 1.26mi |
| 11003 Main Rd East Marion, NY | 3.0 | 2.0 | 3000 | $15,000 | $5.00 | 45d | 1 | 1.37mi |
| 3600 Rocky Point Rd East Marion, NY | 3.0 | 2.5 | 3000 | $16,000 | $5.33 | 45d | 1 | 1.38mi |
| 1000 Sound Dr Greenport, NY | 5.0 | 4.5 | 3700 | $45,000 | $12.16 | 45d | 1 | 1.39mi |
| 11930 Main Rd East Marion, NY | 4.0 | 2.0 | 2200 | $3,500 | $1.59 | 45d | 1 | 1.43mi |
HOA detail
- Monthly dues
- $38 · $456/yr
Listing history 20 events
-
2026-06-22days on market $1,500,000 Active 58 DOM
-
2026-06-21days on market $1,500,000 Active 57 DOM
-
2026-06-21days on market $1,500,000 Active 56 DOM
-
2026-06-18days on market $1,500,000 Active 54 DOM
-
2026-06-17days on market $1,500,000 Active 53 DOM
-
2026-06-16days on market $1,500,000 Active 52 DOM
-
2026-06-15days on market $1,500,000 Active 51 DOM
-
2026-06-13days on market $1,500,000 Active 49 DOM
-
2026-06-12days on market $1,500,000 Active 48 DOM
-
2026-06-09days on market $1,500,000 Active 45 DOM
-
2026-06-08days on market $1,500,000 Active 44 DOM
-
2026-06-07days on market $1,500,000 Active 43 DOM
-
2026-06-05days on market $1,500,000 Active 41 DOM
-
2026-06-04days on market $1,500,000 Active 39 DOM
-
2026-06-02days on market $1,500,000 Active 38 DOM
-
2026-06-01days on market $1,500,000 Active 37 DOM
-
2026-05-31days on market $1,500,000 Active 36 DOM
-
2026-04-25$1,650,000 Active 1988-char remark
-
1998-06-30soldstatus $278,000
-
1987-12-08soldstatus $115,000
ⓘ Source: listings_history table (triggers on properties + properties_extension) + one-shot
backfill from property_details.listing_events for pre-trigger history.
Tax reassessment forecast NY · Partial reset (capped growth)
- Current annual tax
- $11,051 · $921/mo
- Projected year-2 tax
- $18,200 · $1,517/mo
- Expected delta
- +$7,150/yr (+$596/mo · 64.7%)
ⓘ Screening estimate from a state-policy table — verify with the county assessor before closing.
Climate risk First Street
- Flood 1/10 Low FEMA zone X (unshaded) · 0% chance over 30 yrs
- Wildfire 1/10 Low
- Heat 5/10 Major 7 d/yr ≥90°F today · 19 d/yr by 30 yrs out
- Wind 8/10 Severe 80% chance of damaging wind over 30 yrs
- Air quality 2/10 Low 2 unhealthy d/yr today · 2 by 30 yrs out
Nearby sold comps map
Loading sold comps map…
Walkable amenities ~0.75 mi
Loading nearby amenities…
Taxation est. · year 1
- Rental income
- $269,358
- − Mortgage interest
- −$84,023
- − Property taxes
- −$11,051
- − Insurance
- −$7,500
- − Repairs & maintenance
- −$21,549
- − Management
- −$21,549
- − HOA
- −$456
- − Depreciation
- −$43,636
- Taxable income
- $79,594
- Est. tax owed @ 24.0%
- −$19,103
- After-tax cash flow
- $80,289/yr
For passive investors: Depreciation is non-cash, so a rental often shows a tax loss while cash-flowing — sheltering income. Rental losses are passive: they offset passive income freely, and up to $25,000/yr can offset ordinary (W-2) income if you actively participate and your MAGI is under $100k (phasing out to $0 by $150k); unused losses carry forward. On sale, claimed depreciation is recaptured at up to 25%, and gains may owe capital-gains tax (a 1031 exchange can defer both). Figures are a year-1 estimate at your 24.0% rate — not tax advice; consult a CPA.
Schools (NCES district)
- District
- Greenport Union Free School District
- NCES district ID
- 3612840
- Math proficiency
- 55% ▲ 5.00%
- Reading proficiency
- 45% ▼ -5.00%
- Median HH income
- $54,490
- Composite
- 45.25/100
- National rank
- #5759
- State rank
- #450 of 755 in NY
Livability — Greenport West
- Score
- 58/100
- State rank
- #1073
- US rank
- #21520
Category grades
Schools grade is shown separately in the Schools card above.
Census & demographics
- Census place
- Greenport West, NY
- Population (ZIP)
- 4,744
Population outlook (Suffolk County) Hauer SSP2
- Today (2025)
- 1,505,262 people
- By 2030
- 1,498,318 · -0.5%
- By 2040
- 1,471,101 · -2.3%
- By 2050
- 1,424,848 · -5.3%
- By 2075
- 1,337,157 · -11.2%
- By 2100
- 1,217,720 · -19.1%
Race, ethnicity, and origin ACS 2023
- Neighborhood character
- Predominantly White (69%)
- Race & ethnicity
- White 69% Hispanic / Latino 23% Two or more races 6% Black 4% Asian 2%
- Hispanic origin (detail)
- Mexican 5% Puerto Rican 2%
- Common ancestry
- Romanian 6% Lithuanian 2% Subsaharan African 2%
- Foreign-born
- 19% · Canada, China
- Languages at home
- 69% English-only · Spanish 22% German/W. Germanic 3% Russian/Polish/Slavic 2%
Political lean MEDSL · Suffolk
- 2024 margin
- Lean R (+10.0) · D 45.0% · R 55.0%
- 2008→2024 swing
- -16.0pp toward R · 2008: 6.0pp · 2024: -10.0pp
- All cycles
- 2024: R+10.0 2020: R+0.0 2016: R+8.2 2012: D+2.9 2008: D+6.0
Not yet ingested
- Civics
- —
Market trends
- HPI YoY
- ▼ -143.97%
- Current HPI
- 462.3431
- Rent YoY
- —
- Metro
- —
- State GDP YoY
- ▲ 2.60%
- F500 in state
- 92
Industry mix (Fortune 500 HQ in NY)
| Industry | F500 HQs | Revenue |
|---|---|---|
| Financial Services | 10 | $950B |
|
||
| Consumer Goods | 9 | $162B |
|
||
| Insurance | 4 | $225B |
|
||
| Telecommunications | 2 | $144B |
|
||
| Pharmaceuticals | 2 | $112B |
|
||
| Media / Entertainment | 2 | $69B |
|
||
Price history
+1204.3% since first listed4 events — show timeline
- 2026-05-20 Price Changed $1,500,000 OneKey® MLS as Distributed by MLS Grid
- 2026-04-25 Listed $1,650,000 OneKey® MLS as Distributed by MLS Grid
- 1998-06-30 Sold (Public Records) $278,000 Public Records
- 1987-12-08 Sold (Public Records) $115,000 Public Records
Property tax history
+2.0%/yrLatest (2025): $11,051 · +0.0% YoY. Source: county tax records.
Cash-flow waterfall
monthlySold comps — $/sqft
last 12 mo · ≤1 miLoading sold comps…