709 North Second Avenue Ave · Amory, MS
Flood risk 1/10 · Minimal
- FEMA flood zone
- X (unshaded)
- Chance of flooding over 30 yrs
- 0.0%
- Est. flood insurance / yr
- $507 – $1,088
Fire risk 3/10 · Minor
- Est. fire insurance / yr
- $1,241 – $2,305
Heat risk 7/10 · Major
- Hot days now (above 110°F)
- 7 days/yr
- Hot days in 30 yrs
- 21 days/yr
Wind risk 6/10 · Moderate
- Chance of severe wind over 30 yrs
- 27.0%
Air-quality risk 1/10 · Minimal
- Unhealthy air days now
- 0 days/yr
- Unhealthy air days in 30 yrs
- 0 days/yr
Risk factors via First Street. Map © Google.
Why this score? — see what drove the B- grade
The composite is a weighted blend of 9 inputs, each scored 0–100. Each bar is that input's sub-score; the figure is the points it added to the 100-point composite (weight × sub-score).
- Cash flow +25.3/30.0
- ARV discount +15.0/15.0
- DSCR +8.3/10.0
- 1% rule +6.7/10.0
- Schools +3.6/10.0
- Livability +3.4/5.0
- Rent growth +2.5/5.0
- Condition / age +2.5/5.0
- Appreciation +0.0/10.0
$99,500
🖨 Deal sheet (PDF) 📄 Offer letter ✓ Due diligence
Listing remarks MLS
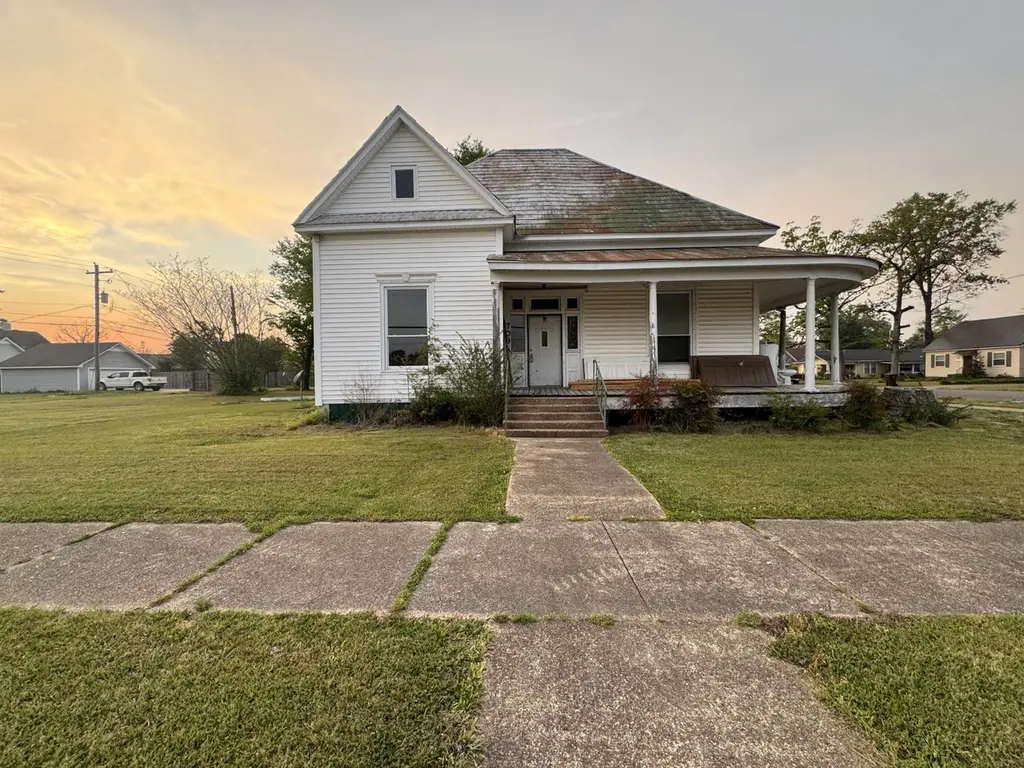
This duplex or possible home presents an excellent opportunity for income generation, ideally situated in a desirable location. Each unit offers 3 bedrooms and 1 bath, catering well to potential renters. The property is situated on a generous corner lot, featuring a charming large wrap-around porch, perfect for enjoying the outdoors. Additionally, the inclusion of an extra lot to the left of the home opens up further development possibilities. This is a promising investment for anyone looking to enhance their real estate portfolio.
Key facts
- Extra lot
- Wrap-around porch
- Corner lot
Tags
Neighborhood map
What this means for you Summary
Snapshot
- This is a 3-bed/1.0-bath single-family listed at $100k.
Deal economics
- At list price, monthly cash flow is $227 ($3k/yr) — positive.
- The deal already cash-flows at list — no discount required.
- Meets the 1% rule at list price ($1k rent vs $100k).
- Recommended offer: $94k (6.0% below list) — sets the bar for market timing.
Location & tenants
- Location reads 67/100 on livability (#76 in MS) — a middle-class / working-renter tenant base. Strengths: cost of living A+, housing A+, health & safety A+; Watch: crime F, amenities F, commute F.
- Amory School District (town): math 44% / reading 43% proficiency, ranked #34 of 130 in MS (top 26%) — families likely to look elsewhere, expect single-tenant / working-renter base with shorter leases.
- Zoned schools: East Amory School (math 47% / reading 53%, grade D+, #61 of 375 statewide, top 17%, 372 students, 99% FRL); Amory Middle School (math 41% / reading 35%, grade F, #73 of 179 statewide, top 41%, 331 students, 99% FRL); Amory High School (math 52% / reading 42%, grade D-, #30 of 197 statewide, top 15%, 456 students, 99% FRL) — zoned schools average 99% FRL vs 55% district-wide (44 pts higher); higher-poverty schools than district average — tighter screening recommended.
- Market conditions: 102 active listings in the ZIP; 18 units permitted in Monroe County in 2024 (0 in 5+ unit buildings).
Forward outlook
- Local home prices are declining (-3.0%/yr); year-one equity from $688 of loan paydown is wiped out by about $3k of value loss. Plan a longer hold.
- Monroe County population projected at -21% by 2050 — secular population decline; favor cash flow + early exit over multi-decade hold.
Negotiation context
- It's been on market 73 days — a 6% lower offer ($94k) is reasonable based on typical stale-listing flexibility.
- 7 sale attempts since 3y ago with the ask held roughly flat each time — persistent listings suggest the price (not the market) is what's stuck; bring a comps-based counter.
Risks & watch-outs
- Watch-outs: built in 1920 — expect roof / HVAC / electrical / plumbing capex.
- Climate carrying-cost: major wind risk, 27% chance of damaging wind over 30y; extreme-heat days projected 7→21/yr by 2055 (HVAC capex compounding) — expect insurance premiums to compound above CPI over the hold.
Questions for the listing agent
- It's been on market 73 days. Have you received any prior offers? Is the seller open to a 6% concession, seller financing, or rate buy-down credit?
- Built in 1920 — when were the roof, HVAC, electrical panel, plumbing, and water heater last replaced?
- Why hasn't it sold? Are there any deal-killer items the seller is aware of (foundation, flood, title, zoning, code violations)?
- Is there a deadline driving the sale (1031 exchange, divorce, estate, relocation)? That informs how much negotiation room exists.
- Schools are D-rated, which usually means shorter tenancies and higher turnover. Who's the typical renter profile here, and what's been the actual vacancy rate?
- Crime grade is F in this area — have there been break-ins, vandalism, or insurance claims at this property in the last 3 years? What carrier currently insures it and at what premium?
- What's the average days-on-market for RENTAL listings here right now (not sales)? A rising rental-DOM trend means longer vacancies and softer asking-rent achievability than the comps imply.
- What's the recent tenant-quality profile in this submarket — average credit score on applications, eviction rate, late-payment / NSF rate, and stable-employment percentage? A property-management company in the area should have these aggregated.
- How much new for-sale + rental construction is in the pipeline within 1–3 miles? Heavy new supply typically softens prices + rents 12–24 months out; constrained supply supports both.
Investment metrics
- 1% rule
- 1.17% ✓
- Cap rate
- 9.03%
- Cash-on-cash
- 9.77%
- DSCR
- 1.43
- GRM
- 7.1
CMA / ARV
- ARV (median comp)
- $131,642
- List price
- $99,500
- Delta
- -24.42%
- Verdict
- UNDERPRICED
- Comps
- 20 within 1.0 mi
Show comp detail 3 sales within ~0.75 mi
| Address | Dist | Beds/Ba | Sqft | Sold | Price | $/sf | Match |
|---|---|---|---|---|---|---|---|
| 804 Maple St | 0.25mi | 3/2.0 | 2,231 (-4%) | 23mo | $110,000 | $49 | 58 |
| 1 Emily Ln | 0.70mi | 4/2.5 (+1) | 2,471 (+6%) | 19mo | $18,000 | $7 | 30 |
| 205 Boulvard Dr South | 0.41mi | 4/3.0 (+1) | 2,015 (-13%) | 19mo | $140,000 | $69 | 30 |
Match score weights: distance 35% · size 25% · config 20% · recency 20%. Top-matched comps best support the ARV.
Projected returns pro-forma
-3.0% appreciation · 3.0% rent growth · sell at horizon
- IRR
- -1.6%
- Equity multiple
- 0.94×
- Total profit
- $-1,650
- Equity at exit
- $14,836
- IRR
- 8.1%
- Equity multiple
- 1.62×
- Total profit
- $17,257
- Equity at exit
- $8,603
Cash invested: $27,860 (down + closing). Projections, not guarantees.
Landlord ↔ Tenant lean methodology
- Overall (STATE)
- 90 Strongly Landlord-Friendly
- State Mississippi
- 90 Strongly Landlord-Friendly · R+11
- County
- — inherits STATE
- City
- — inherits STATE
ZIP-level market 38821
- Home prices YoY
- -18.1%
- Active inventory
- 102
- Price-to-rent
- 7.1×
Monthly cashflow live
- Estimated rent
- $1,163 medium interval (Pro) →
- Mortgage (P&I)
- −$522
- Tax from tax record
- −$129 /mo · $1,545/yr
- Insurance
- −$41
- HOA
- −$0
- Vacancy / Maint / Mgmt
- −$244
- Net cashflow
- $227
Break-even live
Sensitivity live
| Price | -10% $283 | -5% $255 | +0% $227 | +5% $199 | +10% $171 |
|---|---|---|---|---|---|
| Rent | -10% $135 | -5% $181 | +0% $227 | +5% $273 | +10% $319 |
| Rate | -1.0pp $277 | -0.5pp $252 | base $227 | +0.5pp $201 | +1.0pp $175 |
UW: 25.0% down · 7.5% · 30yr · 1.5% tax · 5.0% vac · 8.0% maint · 8.0% mgmt
Financing live
Cash to close
- Down payment
- $24,875
- Closing costs
- $2,985
- Reserves months
- —
- Total cash needed
- —
Loan-product check · same deal, 3 products live
Conventional
25% down · 7.5% · 30yr
- Down + closing
- —
- Monthly P&I
- —
- Monthly cashflow
- —
- DSCR
- —
- Eligible?
- —
Personal DTI + credit; lowest rate.
DSCR
20% down · 8.5% · 30yr
- Down + closing
- —
- Monthly P&I
- —
- Monthly cashflow
- —
- DSCR
- —
- Eligible?
- —
No personal income docs; deal must DSCR.
Hard money
10% down · 12.0% · 12mo
- Down + closing
- —
- Monthly P&I
- —
- Monthly cashflow
- —
- DSCR
- —
- Eligible?
- —
Short-term bridge; refi at stabilization.
Listing history 26 events
-
2026-06-21days on market $99,500 Active 73 DOM
-
2026-06-21days on market $99,500 Active 72 DOM
-
2026-06-18days on market $99,500 Active 70 DOM
-
2026-06-17days on market $99,500 Active 69 DOM
-
2026-06-16days on market $99,500 Active 68 DOM
-
2026-06-15days on market $99,500 Active 67 DOM
-
2026-06-13days on market $99,500 Active 65 DOM
-
2026-06-12days on market $99,500 Active 64 DOM
-
2026-06-09days on market $99,500 Active 61 DOM
-
2026-06-08days on market $99,500 Active 60 DOM
-
2026-06-07days on market $99,500 Active 59 DOM
-
2026-06-07days on market $99,500 Active 58 DOM
-
2026-06-04days on market $99,500 Active 55 DOM
-
2026-06-02days on market $99,500 Active 54 DOM
-
2026-06-01days on market $99,500 Active 53 DOM
-
2026-05-31days on market $99,500 Active 52 DOM
-
2026-04-09$103,900 Active 537-char remark
Show marketing remark (537 chars)
This duplex or possible home presents an excellent opportunity for income generation, ideally situated in a desirable location. Each unit offers 3 bedrooms and 1 bath, catering well to potential renters. The property is situated on a generous corner lot, featuring a charming large wrap-around porch, perfect for enjoying the outdoors. Additionally, the inclusion of an extra lot to the left of the home opens up further development possibilities. This is a promising investment for anyone looking to enhance their real estate portfolio.
-
2025-11-19soldstatus Closed
-
2024-12-04status Active
-
2024-12-04price $65,000
-
2024-06-25status Active
-
2024-04-05status Active
-
2024-01-28price $75,000
-
2024-01-23status Active
-
2023-07-02$82,500
ⓘ Source: listings_history table (triggers on properties + properties_extension) + one-shot
backfill from property_details.listing_events for pre-trigger history.
Tax reassessment forecast MS · Resets to sale price
- Current annual tax
- $1,545 · $129/mo
- Projected year-2 tax
- $1,545 · $129/mo
- Expected delta
- $0/yr ($0/mo · 0.0%)
ⓘ Screening estimate from a state-policy table — verify with the county assessor before closing.
Climate risk First Street
- Flood 1/10 Low FEMA zone X (unshaded) · 0% chance over 30 yrs
- Wildfire 3/10 Moderate
- Heat 7/10 Severe 7 d/yr ≥110°F today · 21 d/yr by 30 yrs out
- Wind 6/10 Major 27% chance of damaging wind over 30 yrs
- Air quality 1/10 Low 0 unhealthy d/yr today · 0 by 30 yrs out
Nearby sold comps map
Loading sold comps map…
Walkable amenities ~0.75 mi
Loading nearby amenities…
Taxation est. · year 1
- Rental income
- $13,959
- − Mortgage interest
- −$5,574
- − Property taxes
- −$1,545
- − Insurance
- −$498
- − Repairs & maintenance
- −$1,117
- − Management
- −$1,117
- − Depreciation
- −$2,895
- Taxable income
- $1,215
- Est. tax owed @ 24.0%
- −$291
- After-tax cash flow
- $2,432/yr
For passive investors: Depreciation is non-cash, so a rental often shows a tax loss while cash-flowing — sheltering income. Rental losses are passive: they offset passive income freely, and up to $25,000/yr can offset ordinary (W-2) income if you actively participate and your MAGI is under $100k (phasing out to $0 by $150k); unused losses carry forward. On sale, claimed depreciation is recaptured at up to 25%, and gains may owe capital-gains tax (a 1031 exchange can defer both). Figures are a year-1 estimate at your 24.0% rate — not tax advice; consult a CPA.
Schools (NCES district)
- District
- Amory School District
- NCES district ID
- 2800450
- Math proficiency
- 44% ▼ -17.00%
- Reading proficiency
- 43% ▼ -6.00%
- Median HH income
- $37,071
- Composite
- 36.17/100
- National rank
- #4733
- State rank
- #34 of 130 in MS
Livability — Amory
- Score
- 67/100
- State rank
- #76
- US rank
- #10386
Category grades
Schools grade is shown separately in the Schools card above.
Census & demographics
- Census place
- Amory, MS
- Population (ZIP)
- 12,417
Population outlook (Monroe County) Hauer SSP2
- Today (2025)
- 33,903 people
- By 2030
- 32,612 · -3.8%
- By 2040
- 29,761 · -12.2%
- By 2050
- 26,788 · -21.0%
- By 2075
- 20,058 · -40.8%
- By 2100
- 14,566 · -57.0%
Race, ethnicity, and origin ACS 2023
- Neighborhood character
- Predominantly White (78%)
- Race & ethnicity
- White 78% Black 17% Hispanic / Latino 3% Two or more races 3%
- Common ancestry
- Scottish 2% Slovak 1% Lithuanian 1%
- Foreign-born
- 1% · Canada
- Languages at home
- 98% English-only · Spanish 2%
Political lean MEDSL · Monroe
- 2024 margin
- Solid R (+35.9) · D 31.7% · R 67.6%
- 2008→2024 swing
- -18.7pp toward R · 2008: -17.2pp · 2024: -35.9pp
- All cycles
- 2024: R+35.9 2020: R+30.7 2016: R+29.3 2012: R+15.9 2008: R+17.2
Not yet ingested
- Civics
- —
Market trends
- HPI YoY
- ▼ -31.08%
- Current HPI
- 141.0581
- Rent YoY
- —
- Metro
- —
- State GDP YoY
- —
- F500 in state
- 0
Price history
+25.9% since first listed10 events — show timeline
- 2026-04-09 Listed $103,900 NEMSBD
- 2026-04-09 Listed $103,900 NEMSBD
- 2025-11-19 Sold (MLS) — NEMSBD
- 2024-12-04 Relisted — NEMSBD
- 2024-12-04 Price Changed $65,000 NEMSBD
- 2024-06-25 Relisted — NEMSBD
- 2024-04-05 Relisted — NEMSBD
- 2024-01-28 Price Changed $75,000 NEMSBD
- 2024-01-23 Relisted — NEMSBD
- 2023-07-02 Listed $82,500 NEMSBD
Property tax history
+11.4%/yrLatest (2025): $1,545 · +36.3% YoY. Source: county tax records.
Cash-flow waterfall
monthlySold comps — $/sqft
last 12 mo · ≤1 miLoading sold comps…