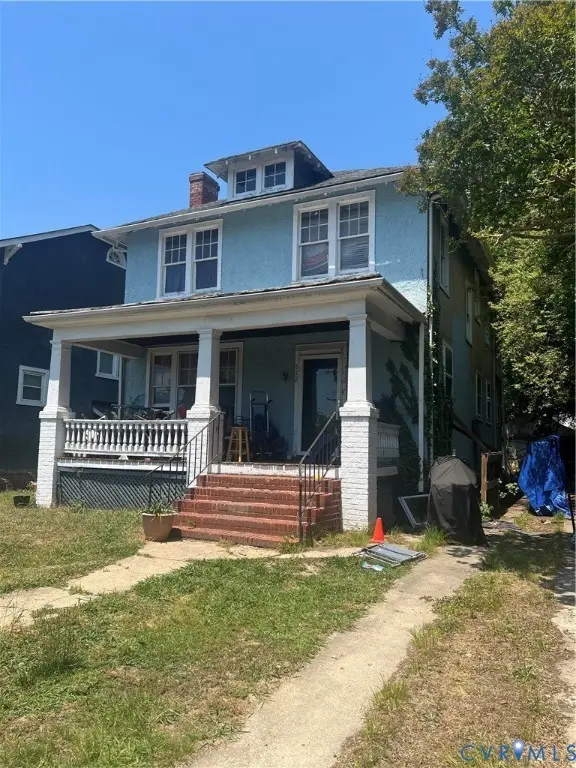
812 W Lancaster Rd · Richmond, VA
Flood risk 1/10 · Minimal
- FEMA flood zone
- X (unshaded)
- Chance of flooding over 30 yrs
- 0.0%
- Est. flood insurance / yr
- $473 – $860
Fire risk 1/10 · Minimal
- Est. fire insurance / yr
- $666 – $1,236
Heat risk 8/10 · Major
- Hot days now (above 105°F)
- 7 days/yr
- Hot days in 30 yrs
- 17 days/yr
Wind risk 6/10 · Moderate
- Chance of severe wind over 30 yrs
- 27.0%
Air-quality risk 2/10 · Minimal
- Unhealthy air days now
- 1 days/yr
- Unhealthy air days in 30 yrs
- 3 days/yr
Risk factors via First Street. Map © Google.
Why this score? — see what drove the D+ grade
The composite is a weighted blend of 9 inputs, each scored 0–100. Each bar is that input's sub-score; the figure is the points it added to the 100-point composite (weight × sub-score).
- ARV discount +15.0/15.0
- Cash flow +13.4/30.0
- Rent growth +4.4/5.0
- Livability +4.2/5.0
- DSCR +4.0/10.0
- Schools +3.3/10.0
- 1% rule +2.9/10.0
- Condition / age +2.5/5.0
- Appreciation +0.0/10.0
$325,000
🖨 Deal sheet 📄 Offer letter ✓ Due diligence
Listing remarks
INVESTOR ALERT — Northside Richmond opportunity in the heart of one of the city's most active renovation corridors! This circa-1929 home on a classic tree-lined block of W Lancaster Rd needs a complete gut renovation and is priced accordingly at $325,000. Bring your contractor and your vision: similar homes on this very street have been transformed into stunning showpieces. Renovated comps in the area suggest strong after-repair potential (buyer to perform their own analysis — no representation is made as to future value). The location speaks for itself: minutes from the booming Brookland Park Boulevard corridor with neighborhood favorites like The Smoky Mug, Ruby Scoops ice cre
Key facts
- 7,000 sq ft lot
- Garage
- Built 1929
Property features AI
Exterior
- Parking: Detached garage with alley access; On-street parking; Off-street parking
- Utilities: Public water; Public sewer
- Home design: 2-story property; Resale condition; Zoned R-6
- Construction: Block, frame, and stucco construction; Metal roof; Below-grade unfinished area present
- Exterior features: Front porch; Rear porch; Balcony; Back yard fencing (partial, fenced)
Interior
- Kitchen: Electric water heater
- Bedrooms: Total rooms: 8
- Flooring: Wood
- Bathrooms: 2 full bathrooms
- Heating & cooling: Natural gas heating; Radiator heating
- Interior features: Wood flooring; Partial basement
- Laundry & utility: Electric water heater
Neighborhood map
What this means for you Summary
Snapshot
- This is a 4-bed/2.0-bath single-family listed at $325k.
Deal economics
- At list price, monthly cash flow is $5 ($60/yr) — positive.
- The deal already cash-flows at list — no discount required.
- To meet the 1% rule (rent ≥ 1% of price), the offer needs to be $258k (20.5% below list).
- Recommended offer: $258k (20.5% below list) — sets the bar for 1% rule.
- Cap rate 6.3% vs local median 3.3% in Richmond — top-decile yield for the area; either an underpriced asset or a hidden risk that comps aren't pricing in. Stress-test before assuming the spread holds.
Location & tenants
- Location reads 84/100 on livability (#33 in VA, #793 nationally) — a professional / high-income tenant draw. Strengths: amenities A+, commute A+, health & safety A+; Watch: crime D-.
- Richmond City Public School District (urban): math 32% / reading 47% proficiency, ranked #123 of 131 in VA (top 94%) — families likely to look elsewhere, expect single-tenant / working-renter base with shorter leases; 74% free/reduced lunch — lower-income household profile, screen leases tightly.
- Market conditions: Rents rising fast (+7.4%/yr); 179 active listings in the ZIP; 27 comparable units currently listed for rent nearby; rentals at typical pace (median 24d on market — plan ~3-4 weeks tenant-placement turnaround); 48% of comp listings sitting > 30 days — soft ceiling on asking rent; 2,540 units permitted in Richmond city in 2024 (2,077 in 5+ unit buildings).
- At $2,583/mo this rent would consume 51% of the median local household income ($61k/yr) (locally 1325% of renters already pay >50% of income on rent) — very limited rent-growth headroom before tenants either downsize or default.
Forward outlook
- Local home prices are declining (-3.0%/yr); year-one equity from $2k of loan paydown is wiped out by about $10k of value loss. Plan a longer hold.
- Richmond County population projected at +40% by 2050 — long-run rental-demand tailwind backs the buy-and-hold thesis.
Negotiation context
- Only 6 days on market — expect competitive offers; lowballing is unlikely to land.
- Current owner paid $25k; list at $325k implies a 1195% gain — meaningful room to come down on a strong offer.
Risks & watch-outs
- Watch-outs: built in 1929 — expect roof / HVAC / electrical / plumbing capex.
- Climate carrying-cost: major wind risk, 27% chance of damaging wind over 30y; extreme-heat days projected 7→17/yr by 2055 (HVAC capex compounding) — expect insurance premiums to compound above CPI over the hold.
Questions for the listing agent
- Built in 1929 — when were the roof, HVAC, electrical panel, plumbing, and water heater last replaced?
- Is there a deadline driving the sale (1031 exchange, divorce, estate, relocation)? That informs how much negotiation room exists.
- Schools are A-rated — typically a magnet for longer-tenancy family renters. What's the average tenant stay here, and is there a school-zone premium baked into asking?
- Crime grade is D in this area — have there been break-ins, vandalism, or insurance claims at this property in the last 3 years? What carrier currently insures it and at what premium?
- The area grade is low — what's the realistic commute time and amenity access for the typical tenant pool here? Any planned neighborhood developments (good or bad) we should know about?
- What's the average days-on-market for RENTAL listings here right now (not sales)? A rising rental-DOM trend means longer vacancies and softer asking-rent achievability than the comps imply.
- What's the recent tenant-quality profile in this submarket — average credit score on applications, eviction rate, late-payment / NSF rate, and stable-employment percentage? A property-management company in the area should have these aggregated.
- How much new for-sale + rental construction is in the pipeline within 1–3 miles? Heavy new supply typically softens prices + rents 12–24 months out; constrained supply supports both.
Investment metrics
- 1% rule
- 0.79% ✗
- Cap rate
- 6.31%
- Cash-on-cash
- 0.07%
- DSCR
- 1.00
- GRM
- 10.5
CMA / ARV
- ARV (on-the-fly)
- $493,518
- Comps found
- 12
Show comp detail 12 sales within ~0.75 mi
| Address | Dist | Beds/Ba | Sqft | Sold | Price | $/sf | Match |
|---|---|---|---|---|---|---|---|
| 2814 Montrose Ave | 0.27mi | 4/2.5 | 1,980 (-0%) | 0mo | $535,000 | $270 | 85 |
| 3012 Edgewood Ave | 0.46mi | 4/2.0 | 1,920 (-3%) | 2mo | $512,000 | $267 | 71 |
| 116 Overbrook Rd | 0.37mi | 3/2.5 (-1) | 1,900 (-4%) | 0mo | $510,000 | $268 | 68 |
| 2910 Griffin Ave | 0.42mi | 4/1.5 | 2,088 (+5%) | 1mo | $520,000 | $249 | 68 |
| 3102 Moss Side Ave | 0.57mi | 4/2.5 | 1,892 (-4%) | 3mo | $414,000 | $219 | 61 |
| 5 W Graham Rd | 0.55mi | 4/2.5 | 1,858 (-6%) | 3mo | $335,000 | $180 | 59 |
| 2903 Hanes Ave | 0.51mi | 3/2.5 (-1) | 1,824 (-8%) | 0mo | $545,000 | $299 | 56 |
| 2124 Lamb Ave | 0.71mi | 3/2.5 (-1) | 1,931 (-3%) | 3mo | $500,000 | $259 | 53 |
| 2923 Garland Ave | 0.60mi | 3/2.0 (-1) | 1,840 (-7%) | 3mo | $425,000 | $231 | 53 |
| 2013 North Ave | 0.68mi | 3/2.5 (-1) | 2,101 (+6%) | 3mo | $425,000 | $202 | 49 |
| 2803 Garland Ave | 0.53mi | 3/1.0 (-1) | 1,792 (-10%) | 3mo | $197,000 | $110 | 48 |
| 2701 Barton Ave | 0.63mi | 3/1.5 (-1) | 1,792 (-10%) | 1mo | $320,000 | $179 | 47 |
Match score weights: distance 35% · size 25% · config 20% · recency 20%. Top-matched comps best support the ARV.
Projected returns pro-forma
-3.0% appreciation · 7.43% rent growth · sell at horizon
- IRR
- -11.8%
- Equity multiple
- 0.56×
- Total profit
- $-40,408
- Equity at exit
- $48,459
- IRR
- 2.5%
- Equity multiple
- 1.21×
- Total profit
- $18,946
- Equity at exit
- $28,100
Cash invested: $91,000 (down + closing). Projections, not guarantees.
Landlord ↔ Tenant lean methodology
- Overall (STATE)
- 55 Moderately Landlord-Leaning
- State Virginia
- 55 Moderately Landlord-Leaning · D+2
- County
- — inherits STATE
- City
- — inherits STATE
ZIP-level market 23222
- Rents YoY
- 7.4%
- Active inventory
- 179
- Price-to-rent
- 10.5×
Monthly cashflow live
- Estimated rent
- $2,583 high interval (Pro) →
- Mortgage (P&I)
- −$1,704
- Tax from tax record
- −$196 /mo · $2,352/yr
- Insurance
- −$135
- HOA
- −$0
- Vacancy / Maint / Mgmt
- −$542
- Net cashflow
- $5
Break-even live
UW: 25.0% down · 7.5% · 30yr · 1.5% tax · 5.0% vac · 8.0% maint · 8.0% mgmt
Financing live
Cash to close
- Down payment
- $81,250
- Closing costs
- $9,750
- Reserves months
- —
- Total cash needed
- —
Loan-product check · same deal, 3 products live
Conventional
25% down · 7.5% · 30yr
- Down + closing
- —
- Monthly P&I
- —
- Monthly cashflow
- —
- DSCR
- —
- Eligible?
- —
Personal DTI + credit; lowest rate.
DSCR
20% down · 8.5% · 30yr
- Down + closing
- —
- Monthly P&I
- —
- Monthly cashflow
- —
- DSCR
- —
- Eligible?
- —
No personal income docs; deal must DSCR.
Hard money
10% down · 12.0% · 12mo
- Down + closing
- —
- Monthly P&I
- —
- Monthly cashflow
- —
- DSCR
- —
- Eligible?
- —
Short-term bridge; refi at stabilization.
Rent comps 27 comps
| Address | Beds | Baths | Sqft | Rent | $/sqft | DOM | Units | Dist |
|---|---|---|---|---|---|---|---|---|
| 2701 Northumberland Ave Richmond, VA | 3.0 | 3.0 | 2310 | $2,630 | $1.14 | 4d | 1 | 0.25mi |
| 2807 Edgewood Ave Richmond, VA | 3.0 | 1.0 | 1320 | $1,750 | $1.33 | 43d | 1 | 0.29mi |
| 3007 Moss Side Ave Richmond, VA | 3.0 | 2.5 | 1772 | $2,495 | $1.41 | 23d | 1 | 0.40mi |
| 2435 Ownby Ln Richmond, VA | 3.0 | 2.5 | 2516 | $3,500 | $1.39 | 43d | 1 | 0.75mi |
| 1500 W Moore St Unit B Richmond, VA | 3.0 | 2.5 | 2500 | $3,700 | $1.48 | 43d | 1 | 0.79mi |
| 3204 North Ave Richmond, VA | 3.0 | 2.5 | 1626 | $2,395 | $1.47 | 4d | 1 | 0.80mi |
| 2402 Ownby Ln Richmond, VA | 3.0 | 2.5 | 2253 | $3,488 | $1.55 | 1d | 4 | 0.80mi |
| 1013 N Lombardy St Unit B Richmond, VA | 3.0 | 2.5 | 2460 | $3,030 | $1.23 | 43d | 1 | 0.86mi |
| 1601 Overbrook Rd Richmond, VA | 1.0–3.0 | 1.0–2.0 | 922 | $3,172 | $3.44 | 1d | 25 | 0.86mi |
| 207 Welford St Richmond, VA | 3.0 | 1.5 | 1348 | $1,850 | $1.37 | 23d | 1 | 0.88mi |
| 1417 W Leigh St Richmond, VA | 4.0 | 3.0 | 1512 | $2,600 | $1.72 | 43d | 1 | 0.91mi |
| 900 N Allen Ave Richmond, VA | 1.0–3.0 | 1.0–3.0 | 1286 | $3,800 | $2.95 | 1d | 30 | 0.95mi |
| 800 Catherine St Richmond, VA | 4.0 | 2.5 | 1251 | $2,062 | $1.65 | 43d | 1 | 1.04mi |
| 1128 W Marshall St Richmond, VA | 4.0 | 3.0 | 1658 | $3,000 | $1.81 | 23d | 1 | 1.08mi |
| 1128 W Marshall St Unit Na Richmond, VA | 4.0 | 3.0 | 1658 | $3,000 | $1.81 | 43d | 1 | 1.08mi |
| 412 W Marshall St Richmond, VA | 3.0 | 2.0 | 1650 | $2,375 | $1.44 | 14d | 1 | 1.24mi |
| 724 N 1st St Richmond, VA | 3.0 | 2.5 | 1704 | $3,000 | $1.76 | 43d | 1 | 1.24mi |
| 2034 W Grace St Unit A Richmond, VA | 4.0 | 2.0 | 2450 | $2,950 | $1.20 | 43d | 1 | 1.27mi |
| 403 E Ladies Mile Rd Richmond, VA | 5.0 | 2.5 | 1448 | $3,200 | $2.21 | 43d | 1 | 1.28mi |
| 2034 W Grace St Unit B Richmond, VA | 4.0 | 2.0 | 2500 | $3,200 | $1.28 | 43d | 1 | 1.28mi |
| 1103 W Franklin St Unit A Richmond, VA | 3.0 | 1.5 | 1250 | $1,695 | $1.36 | 23d | 1 | 1.31mi |
| 3324 Meadowbridge Rd Richmond, VA | 4.0 | 2.5 | 1667 | $2,175 | $1.30 | 17d | 1 | 1.38mi |
| 3211 Maryland Ave Richmond, VA | 4.0 | 1.5 | 1344 | $1,871 | $1.39 | 43d | 1 | 1.38mi |
| 3501 Meadowbridge Rd Richmond, VA | 3.0 | 1.0 | 1383 | $1,495 | $1.08 | 23d | 1 | 1.46mi |
| 3501 Meadowbridge Rd Richmond, VA | 3.0 | 1.0 | 1383 | $1,495 | $1.08 | 19d | 1 | 1.46mi |
| 3202 1st Ave Richmond, VA | 3.0 | 2.5 | 1440 | $2,062 | $1.43 | 21d | 1 | 1.48mi |
| 3007 3rd Ave Richmond, VA | 3.0 | 3.0 | 2036 | $2,295 | $1.13 | 43d | 1 | 1.48mi |
Listing history 6 events
-
2026-06-18days on market $325,000 Active 6 DOM
-
2026-06-17days on market $325,000 Active 5 DOM
-
2026-06-16days on market $325,000 Active 4 DOM
-
2026-06-15days on market $325,000 Active 3 DOM
-
2026-06-13remarks 687-char remark
-
2026-06-13$325,000 Active 1 DOM
ⓘ Source: listings_history table (triggers on properties + properties_extension) + one-shot
backfill from property_details.listing_events for pre-trigger history.
Tax reassessment forecast VA · Resets to sale price
- Current annual tax
- $2,352 · $196/mo
- Projected year-2 tax
- $2,665 · $222/mo
- Expected delta
- +$313/yr (+$26/mo · 13.3%)
ⓘ Screening estimate from a state-policy table — verify with the county assessor before closing.
Climate risk First Street
- Flood 1/10 Low FEMA zone X (unshaded) · 0% chance over 30 yrs
- Wildfire 1/10 Low
- Heat 8/10 Severe 7 d/yr ≥105°F today · 17 d/yr by 30 yrs out
- Wind 6/10 Major 27% chance of damaging wind over 30 yrs
- Air quality 2/10 Low 1 unhealthy d/yr today · 3 by 30 yrs out
Nearby sold comps map
Loading sold comps map…
Walkable amenities ~0.75 mi
Loading nearby amenities…
Taxation est. · year 1
- Rental income
- $30,999
- − Mortgage interest
- −$18,205
- − Property taxes
- −$2,352
- − Insurance
- −$1,625
- − Repairs & maintenance
- −$2,480
- − Management
- −$2,480
- − Depreciation
- −$9,455
- Taxable loss
- −$5,598
- Est. tax savings @ 24.0%
- +$1,343
- After-tax cash flow
- $1,403/yr
For passive investors: Depreciation is non-cash, so a rental often shows a tax loss while cash-flowing — sheltering income. Rental losses are passive: they offset passive income freely, and up to $25,000/yr can offset ordinary (W-2) income if you actively participate and your MAGI is under $100k (phasing out to $0 by $150k); unused losses carry forward. On sale, claimed depreciation is recaptured at up to 25%, and gains may owe capital-gains tax (a 1031 exchange can defer both). Figures are a year-1 estimate at your 24.0% rate — not tax advice; consult a CPA.
Schools (NCES district)
- District
- Richmond City Public School District
- NCES district ID
- 5103240
- Math proficiency
- 32% ▼ -24.00%
- Reading proficiency
- 47% ▼ -9.00%
- Median HH income
- $40,276
- Composite
- 33.09/100
- National rank
- #5564
- State rank
- #123 of 131 in VA
Livability — Richmond
- Score
- 84/100
- State rank
- #33
- US rank
- #793
Category grades
Schools grade is shown separately in the Schools card above.
Census & demographics
- Census place
- Richmond, VA
- County
- Richmond City · 178,280 people
- City population
- 287,109
- Metro
- Richmond, VA
- Population (ZIP)
- 26,322
- Household income
- $61,345
- Rent vs Own
- Severe rent burden
- 1325.0
Population outlook (Richmond County) Hauer SSP2
- Today (2025)
- 262,263 people
- By 2030
- 284,503 · +8.5%
- By 2040
- 327,353 · +24.8%
- By 2050
- 367,946 · +40.3%
- By 2075
- 449,560 · +71.4%
- By 2100
- 500,301 · +90.8%
Race, ethnicity, and origin ACS 2023
- Neighborhood character
- Predominantly Black (70%)
- Race & ethnicity
- Black 70% White 21% Two or more races 4% Hispanic / Latino 3% Asian 2%
- Common ancestry
- Lithuanian 1% Italian 1% Serbian 1%
- Foreign-born
- 5% · Canada
- Languages at home
- 95% English-only · Spanish 2% Other Indo-European 1%
Political lean MEDSL · Richmond
- 2024 margin
- Solid D (+66.3) · D 82.0% · R 15.8% · Other 2.2%
- 2008→2024 swing
- +7.2pp toward D · 2008: 59.1pp · 2024: 66.3pp
- All cycles
- 2024: D+66.3 2020: D+68.0 2016: D+63.8 2012: D+55.7 2008: D+59.1
Not yet ingested
- Civics
- —
Market trends
- HPI YoY
- ▼ -288.72%
- Current HPI
- 428.4029
- Rent YoY
- ▲ 7.43%
- Metro
- Richmond, VA
- State GDP YoY
- ▲ 2.40%
- F500 in state
- 50
Industry mix (Fortune 500 HQ in VA)
| Industry | F500 HQs | Revenue |
|---|---|---|
| Aerospace / Defense | 4 | $236B |
|
||
| Technology / Defense | 3 | $32B |
|
||
| Financial Services | 2 | $176B |
|
||
| Utilities | 2 | $27B |
|
||
| Insurance | 2 | $25B |
|
||
| Technology | 2 | $15B |
|
||
Price history
+523.0% since first listed3 events — show timeline
- 2026-06-11 Listed $325,000 CVRMLS
- 1997-04-29 Sold (Public Records) $25,100 Public Records
- 1997-02-27 Sold (Public Records) $52,164 Public Records
Property tax history
+7.4%/yrLatest (2022): $2,352 · +28.9% YoY. Source: county tax records.
Cash-flow waterfall
monthlySold comps — $/sqft
last 12 mo · ≤1 miLoading sold comps…