 Multi-family
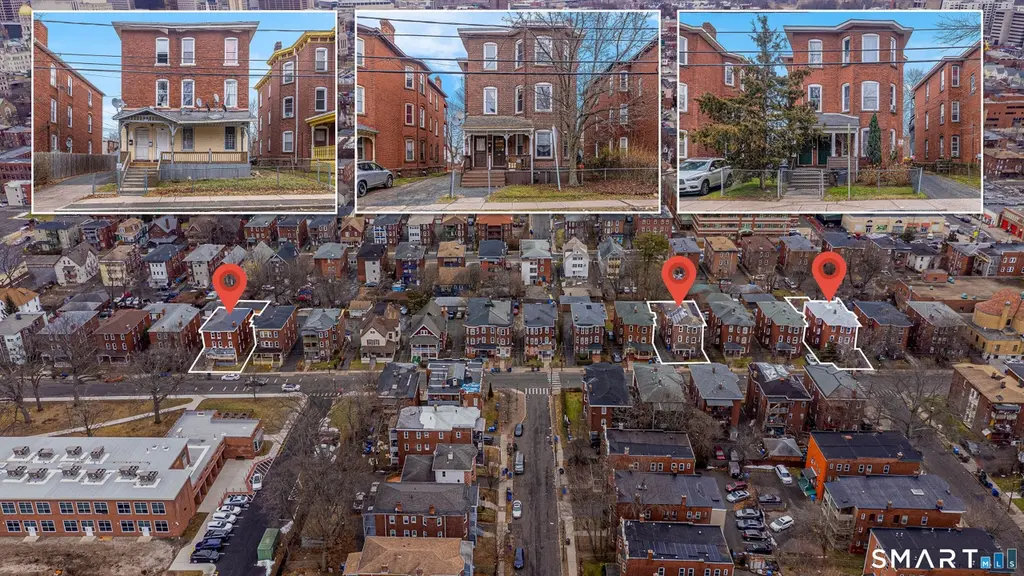
49-51 Chadwick Ave · Hartford, CT
Flood risk 1/10 · Minimal
- FEMA flood zone
- X (unshaded)
- Chance of flooding over 30 yrs
- 0.0%
- Est. flood insurance / yr
- $473 – $860
Fire risk 1/10 · Minimal
- Est. fire insurance / yr
- $829 – $1,539
Heat risk 5/10 · Moderate
- Hot days now (above 97°F)
- 7 days/yr
- Hot days in 30 yrs
- 16 days/yr
Wind risk 6/10 · Moderate
- Chance of severe wind over 30 yrs
- 27.0%
Air-quality risk 3/10 · Minor
- Unhealthy air days now
- 3 days/yr
- Unhealthy air days in 30 yrs
- 4 days/yr
Risk factors via First Street. Map © Google.
Why this score? — see what drove the B grade
The composite is a weighted blend of 9 inputs, each scored 0–100. Each bar is that input's sub-score; the figure is the points it added to the 100-point composite (weight × sub-score).
- Cash flow +30.0/30.0
- DSCR +10.0/10.0
- 1% rule +9.9/10.0
- ARV discount +7.5/15.0
- Appreciation +5.7/10.0
- Livability +3.8/5.0
- Rent growth +3.1/5.0
- Condition / age +2.5/5.0
- Schools +1.4/10.0
$2,999,999
🖨 Deal sheet (PDF) 📄 Offer letter ✓ Due diligence
Multi-family units
County records classify this as Multi-Family (2-4 Unit). Listing-text estimate: 1 unit. estimate disagrees with records
Listing remarks MLS
Compelling opportunity to acquire a Hartford multifamily portfolio consisting of seven (7) buildings and twenty-one (21) units. The portfolio is comprised of spacious 3-Bedroom / 1-Bathroom units with large floor plans, a strong and stable tenant base, and a history of low vacancy. The properties are well maintained and offer low-maintenance operations. Additional features include off-street parking and separately metered, tenant-paid gas utilities. The portfolio provides clear value-add upside through rent increases upon tenant turnover, allowing an investor to drive NOI growth while maintaining operational efficiency.
Key facts
- Twenty-one units
- Strong tenant base
- Seven buildings
Tags
Neighborhood map
What this means for you Summary
Snapshot
- This is a 9-bed/3.0-bath multifamily listed at $3.00M.
Deal economics
- At list price, monthly cash flow is $15k ($176k/yr) — positive.
- The deal already cash-flows at list — no discount required.
- Meets the 1% rule at list price ($45k rent vs $3.00M).
- Recommended offer: $2.64M (12.0% below list) — sets the bar for market timing.
Location & tenants
- Location reads 76/100 on livability (#58 in CT, #3,553 nationally) — a middle-class / working-renter tenant base. Strengths: amenities A+, commute A+, health & safety A+; Watch: crime F, employment F.
- Hartford School District (urban): math 13% / reading 21% proficiency, ranked #150 of 153 in CT (top 98%) — low school quality limits family demand, transient renter base, plan for 1-2y turnover; 84% free/reduced lunch — lower-income household profile, screen leases tightly.
- Zoned schools: Kennelly School (math 7% / reading 12%, grade F, #522 of 553 statewide, top 95%, 598 students, 85% FRL); Mcdonough Middle School (math 0% / reading 6%, grade F, #175 of 175 statewide, top 100%, 317 students, 83% FRL) — zoned schools at 84% FRL track the district average.
- Market conditions: Rents rising (+2.4%/yr); 61 active listings in the ZIP; 1,867 units permitted in Capitol Planning Region in 2024 (1,399 in 5+ unit buildings).
- At $44,838/mo this rent would consume 1162% of the median local household income ($46k/yr) (locally 3400% of renters already pay >50% of income on rent) — very limited rent-growth headroom before tenants either downsize or default.
Forward outlook
- In year one you build about $62k of equity ($21k loan paydown + $41k appreciation (1.4% local appreciation)).
- At projected returns (1.4% appreciation + 2.4% rent growth), your $840k cash investment doubles in ~4 years — after that, you're playing with house money.
- By year 4, paydown + projected appreciation supports a ~$219k cash-out refi (75% LTV) — recoverable capital for the next deal without selling this one.
Negotiation context
- It's been on market 131 days — a 12% lower offer ($2.64M) is reasonable based on typical stale-listing flexibility.
- 4 sale attempts since 23y ago with the ask held roughly flat each time — persistent listings suggest the price (not the market) is what's stuck; bring a comps-based counter.
- Current owner paid $90k; list at $3.00M implies a 3233% gain — meaningful room to come down on a strong offer.
Risks & watch-outs
- Watch-outs: built in 1910 — expect roof / HVAC / electrical / plumbing capex.
- Climate carrying-cost: major wind risk, 27% chance of damaging wind over 30y; extreme-heat days projected 7→16/yr by 2055 (HVAC capex compounding) — expect insurance premiums to compound above CPI over the hold.
Questions for the listing agent
- It's been on market 131 days. Have you received any prior offers? Is the seller open to a 12% concession, seller financing, or rate buy-down credit?
- Built in 1910 — when were the roof, HVAC, electrical panel, plumbing, and water heater last replaced?
- Why hasn't it sold? Are there any deal-killer items the seller is aware of (foundation, flood, title, zoning, code violations)?
- Is there a deadline driving the sale (1031 exchange, divorce, estate, relocation)? That informs how much negotiation room exists.
- Schools are D-rated, which usually means shorter tenancies and higher turnover. Who's the typical renter profile here, and what's been the actual vacancy rate?
- Crime grade is F in this area — have there been break-ins, vandalism, or insurance claims at this property in the last 3 years? What carrier currently insures it and at what premium?
- What's the average days-on-market for RENTAL listings here right now (not sales)? A rising rental-DOM trend means longer vacancies and softer asking-rent achievability than the comps imply.
- What's the recent tenant-quality profile in this submarket — average credit score on applications, eviction rate, late-payment / NSF rate, and stable-employment percentage? A property-management company in the area should have these aggregated.
- How much new apartment / multifamily construction is in the pipeline within 1–3 miles? Heavy new supply (>2% of stock underway) typically softens rents 12–24 months out; light construction supports rent growth.
Investment metrics
- 1% rule
- 1.49% ✓
- Cap rate
- 12.17%
- Cash-on-cash
- 20.99%
- DSCR
- 1.93
- GRM
- 5.6
CMA / ARV
- ARV (median comp)
- $670,632
- List price
- $2,999,999
- Delta
- 347.34%
- Verdict
- OVERPRICED
- Comps
- 20 within 1.0 mi
Projected returns pro-forma
1.38% appreciation · 2.37% rent growth · sell at horizon
- IRR
- 23.4%
- Equity multiple
- 2.21×
- Total profit
- $1,019,606
- Equity at exit
- $1,083,171
- IRR
- 25.5%
- Equity multiple
- 4.11×
- Total profit
- $2,613,649
- Equity at exit
- $1,486,230
Cash invested: $840,000 (down + closing). Projections, not guarantees.
Landlord ↔ Tenant lean methodology
- Overall (STATE)
- 27 Tenant-Leaning
- State Connecticut
- 27 Tenant-Leaning · D+7
- County
- — inherits STATE
- City
- — inherits STATE
ZIP-level market 06106
- Home prices YoY
- 0.4%
- Rents YoY
- 2.4%
- Active inventory
- 61
- Price-to-rent
- 117.1×
Monthly cashflow live
- Estimated rent
- $44,838 high interval (Pro) →
- Mortgage (P&I)
- −$15,732
- Tax est. 1.5%
- −$3,750 /mo · $45,000/yr
- Insurance
- −$1,250
- HOA
- −$0
- Vacancy / Maint / Mgmt
- −$9,416
- Net cashflow
- $14,690
Break-even live
Sensitivity live
| Price | -10% $16,763 | -5% $15,726 | +0% $14,690 | +5% $13,653 | +10% $12,616 |
|---|---|---|---|---|---|
| Rent | -10% $11,147 | -5% $12,919 | +0% $14,690 | +5% $16,461 | +10% $18,232 |
| Rate | -1.0pp $16,200 | -0.5pp $15,453 | base $14,690 | +0.5pp $13,912 | +1.0pp $13,121 |
21-unit breakdown (identical units grouped — click to expand)
| Units | Beds | Baths | Est. rent |
|---|---|---|---|
| 21× units | 3 | 1 | $44,835 |
| #1 | 3 | 1 | $2,135 |
| #2 | 3 | 1 | $2,135 |
| #3 | 3 | 1 | $2,135 |
| #4 | 3 | 1 | $2,135 |
| #5 | 3 | 1 | $2,135 |
| #6 | 3 | 1 | $2,135 |
| #7 | 3 | 1 | $2,135 |
| #8 | 3 | 1 | $2,135 |
| #9 | 3 | 1 | $2,135 |
| #10 | 3 | 1 | $2,135 |
| #11 | 3 | 1 | $2,135 |
| #12 | 3 | 1 | $2,135 |
| #13 | 3 | 1 | $2,135 |
| #14 | 3 | 1 | $2,135 |
| #15 | 3 | 1 | $2,135 |
| #16 | 3 | 1 | $2,135 |
| #17 | 3 | 1 | $2,135 |
| #18 | 3 | 1 | $2,135 |
| #19 | 3 | 1 | $2,135 |
| #20 | 3 | 1 | $2,135 |
| #21 | 3 | 1 | $2,135 |
| Total (21 units) | $44,838 | ||
UW: 25.0% down · 7.5% · 30yr · 1.5% tax · 5.0% vac · 8.0% maint · 8.0% mgmt
Financing live
Cash to close
- Down payment
- $750,000
- Closing costs
- $90,000
- Reserves months
- —
- Total cash needed
- —
Loan-product check · same deal, 3 products live
Conventional
25% down · 7.5% · 30yr
- Down + closing
- —
- Monthly P&I
- —
- Monthly cashflow
- —
- DSCR
- —
- Eligible?
- —
Personal DTI + credit; lowest rate.
DSCR
20% down · 8.5% · 30yr
- Down + closing
- —
- Monthly P&I
- —
- Monthly cashflow
- —
- DSCR
- —
- Eligible?
- —
No personal income docs; deal must DSCR.
Hard money
10% down · 12.0% · 12mo
- Down + closing
- —
- Monthly P&I
- —
- Monthly cashflow
- —
- DSCR
- —
- Eligible?
- —
Short-term bridge; refi at stabilization.
Listing history 9 events
-
2026-05-31days on market $2,999,999 Active 131 DOM
-
2026-01-20$2,999,999 Active 627-char remark
Show marketing remark (627 chars)
Compelling opportunity to acquire a Hartford multifamily portfolio consisting of seven (7) buildings and twenty-one (21) units. The portfolio is comprised of spacious 3-Bedroom / 1-Bathroom units with large floor plans, a strong and stable tenant base, and a history of low vacancy. The properties are well maintained and offer low-maintenance operations. Additional features include off-street parking and separately metered, tenant-paid gas utilities. The portfolio provides clear value-add upside through rent increases upon tenant turnover, allowing an investor to drive NOI growth while maintaining operational efficiency.
-
2011-09-28soldstatus $90,000 239-char remark
Show marketing remark (239 chars)
Nice 3 family in good condition with 3 bedrooms on each floor. Good investment for a 1st time home buyer or investor. This property is very close to the west hartford town line. (Short sale already approved by lender) can close immediately
-
2010-08-29$109,900 239-char remark
Show marketing remark (239 chars)
Nice 3 family in good condition with 3 bedrooms on each floor. Good investment for a 1st time home buyer or investor. This property is very close to the west hartford town line. (Short sale already approved by lender) can close immediately
-
2010-08-29historical
Show marketing remark (239 chars)
Nice 3 family in good condition with 3 bedrooms on each floor. Good investment for a 1st time home buyer or investor. This property is very close to the west hartford town line. (Short sale already approved by lender) can close immediately
-
2010-01-15$235,000
-
2003-10-20soldstatus $167,000
-
2003-10-17soldstatus $167,000
-
2003-05-09$166,900
ⓘ Source: listings_history table (triggers on properties + properties_extension) + one-shot
backfill from property_details.listing_events for pre-trigger history.
Climate risk First Street
- Flood 1/10 Low FEMA zone X (unshaded) · 0% chance over 30 yrs
- Wildfire 1/10 Low
- Heat 5/10 Major 7 d/yr ≥97°F today · 16 d/yr by 30 yrs out
- Wind 6/10 Major 27% chance of damaging wind over 30 yrs
- Air quality 3/10 Moderate 3 unhealthy d/yr today · 4 by 30 yrs out
Nearby sold comps map
Loading sold comps map…
Walkable amenities ~0.75 mi
Loading nearby amenities…
Taxation est. · year 1
- Rental income
- $538,056
- − Mortgage interest
- −$168,047
- − Property taxes
- −$45,000
- − Insurance
- −$15,000
- − Repairs & maintenance
- −$43,044
- − Management
- −$43,044
- − Depreciation
- −$87,273
- Taxable income
- $136,648
- Est. tax owed @ 24.0%
- −$32,795
- After-tax cash flow
- $143,481/yr
For passive investors: Depreciation is non-cash, so a rental often shows a tax loss while cash-flowing — sheltering income. Rental losses are passive: they offset passive income freely, and up to $25,000/yr can offset ordinary (W-2) income if you actively participate and your MAGI is under $100k (phasing out to $0 by $150k); unused losses carry forward. On sale, claimed depreciation is recaptured at up to 25%, and gains may owe capital-gains tax (a 1031 exchange can defer both). Figures are a year-1 estimate at your 24.0% rate — not tax advice; consult a CPA.
Schools (NCES district)
- District
- Hartford School District
- NCES district ID
- 0901920
- Math proficiency
- 13% ▼ -5.00%
- Reading proficiency
- 21% ▼ -6.00%
- Median HH income
- $30,521
- Composite
- 13.54/100
- National rank
- #9514
- State rank
- #150 of 153 in CT
Livability — Hartford
- Score
- 76/100
- State rank
- #58
- US rank
- #3553
Category grades
Schools grade is shown separately in the Schools card above.
Census & demographics
- Census place
- Hartford, CT
- County
- Hartford County · 754,208 people
- City population
- 121,162
- Metro
- Hartford-East Hartford-Middletown, CT
- Population (ZIP)
- 36,322
- Household income
- $46,304
- Rent vs Own
- Severe rent burden
- 3400.0
Population outlook (Capitol County) Hauer SSP2
- By 2040
- 1,063,519
Race, ethnicity, and origin ACS 2023
- Neighborhood character
- Diverse neighborhood (Simpson 0.58)
- Race & ethnicity
- Hispanic / Latino 60% Two or more races 25% Black 18% White 15% Asian 3%
- Hispanic origin (detail)
- Mexican 2% Puerto Rican 42% Dominican 6%
- Common ancestry
- Lithuanian 2% Russian 1% Romanian 1%
- Foreign-born
- 20% · Canada, Jamaica, China
- Languages at home
- 46% English-only · Spanish 47% Other Indo-European 3% Other Asian/Pacific 1%
Political lean MEDSL · Capitol
- 2024 margin
- Strong D (+21.9) · D 60.1% · R 38.2% · Other 1.7%
- All cycles
- 2024: D+21.9
Not yet ingested
- Civics
- —
Market trends
- HPI YoY
- ▲ 1.38%
- Current HPI
- 314.0899
- Rent YoY
- ▲ 2.37%
- Metro
- Hartford-East Hartford-Middletown, CT
- State GDP YoY
- ▲ 1.06%
- F500 in state
- 38
Industry mix (Fortune 500 HQ in CT)
| Industry | F500 HQs | Revenue |
|---|---|---|
| Industrial Machinery | 4 | $38B |
|
||
| Insurance | 3 | $71B |
|
||
| Financial Services | 2 | $25B |
|
||
| Transportation / Logistics | 2 | $18B |
|
||
| Healthcare | 1 | $247B |
|
||
| Telecommunications | 1 | $55B |
|
||
Price history
+1697.5% since first listed8 events — show timeline
- 2026-01-20 Listed $2,999,999 Smart MLS
- 2011-09-28 Sold (MLS) $90,000 Smart MLS
- 2010-08-29 Listing Removed — Smart MLS
- 2010-08-29 Listed $109,900 Smart MLS
- 2010-01-15 Listed $235,000 Smart MLS
- 2003-10-20 Sold (Public Records) $167,000 Public Records
- 2003-10-17 Sold (MLS) $167,000 Smart MLS
- 2003-05-09 Listed $166,900 Smart MLS
Property tax history
+6.7%/yrLatest (2025): $5,316 · +0.0% YoY. Source: county tax records.
Cash-flow waterfall
monthlySold comps — $/sqft
last 12 mo · ≤1 miLoading sold comps…