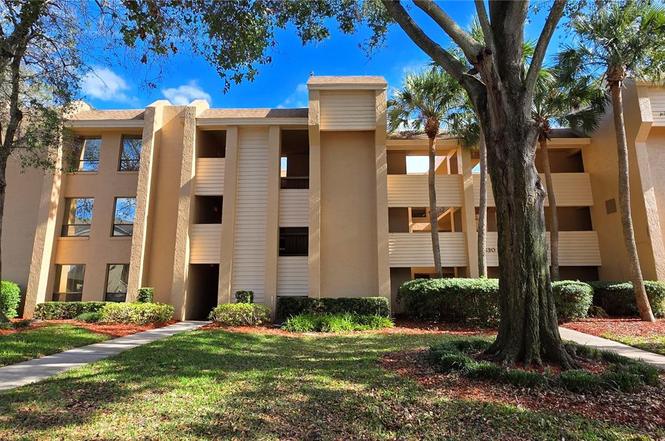
630 Cranes Way #203 · Altamonte Springs, FL
Flood risk 1/10 · Minimal
- FEMA flood zone
- X (unshaded)
- Chance of flooding over 30 yrs
- 0.0%
- Est. flood insurance / yr
- $507 – $1,088
Fire risk 1/10 · Minimal
- Est. fire insurance / yr
- $947 – $1,759
Heat risk 9/10 · Severe
- Hot days now (above 108°F)
- 7 days/yr
- Hot days in 30 yrs
- 23 days/yr
Wind risk 9/10 · Severe
- Chance of severe wind over 30 yrs
- 99.0%
Air-quality risk 2/10 · Minimal
- Unhealthy air days now
- 1 days/yr
- Unhealthy air days in 30 yrs
- 1 days/yr
Risk factors via First Street. Map © Google.
Why this score? — see what drove the D grade
The composite is a weighted blend of 9 inputs, each scored 0–100. Each bar is that input's sub-score; the figure is the points it added to the 100-point composite (weight × sub-score).
- Cash flow +10.7/30.0
- ARV discount +7.5/15.0
- 1% rule +6.9/10.0
- Schools +5.1/10.0
- Livability +4.1/5.0
- DSCR +3.1/10.0
- Condition / age +2.5/5.0
- Rent growth +2.1/5.0
- Appreciation +0.0/10.0
$147,900
🖨 Deal sheet (PDF) 📄 Offer letter ✓ Due diligence
Listing remarks
Great Condo in Great Location. Right across the street from Cranes Roost Park and Altamonte Mall is Cranes Roost Village where this beautiful 3-Beds 2-Baths Condo is located. New Electrical Panel and Water Heater. A dual entry Kitchen and spacious Living area create a great flow for daily living and furniture placement. It features ceramic tile all throughout the different areas which help keep a clean and elegant look. A cozy balcony offers a great option to enjoy that morning coffee while overseeing the community landscaping. Only steps away you can enjoy dinning, shopping and movie theater options as well as fun events all year long at the Cranes Roost Park. Come see it before its gone!
Key facts
- Cozy balcony
- Spacious living area
- Dual entry kitchen
Tags
Property features AI
Finance
- Other: Unit is unfurnished; Condo located on 2nd floor; Living area listed as 929 (public records); Building area total listed as 1,047 (public records); Direction faces west; Accessible features include accessible closets, elevator, kitchen appliances, central living area, stairway access, and washer/dryer accessibility
- Financial info: Total monthly fees reported as $443; total annual fees reported as $5,316; No lease restrictions reported
- HOA & community: Monthly association fee of $443 (includes maintenance structure and grounds, general maintenance, pool and recreational facilities); Association required; Community clubhouse; Community pool; Tennis courts; Community mailbox; Street lights; Pets allowed (maximum ~100 lbs)
Exterior
- Parking: Ground level parking; Guest parking; Reserved parking
- Utilities: Public sewer; Water available; Electricity available; Cable available; Phone available; Sewer connected
- Home design: Residential condominium; One story; West-facing
- Construction: Block and stucco construction; Shingle roof; Slab foundation; Building identified as #630
- Exterior features: Balcony; Sliding doors; Exterior lighting; Tennis courts
Interior
- Kitchen: Dishwasher; Disposal; Microwave; Range; Refrigerator; Electric water heater
- Bedrooms: 2 bedrooms
- Flooring: Laminate; Tile
- Bathrooms: 1 full bathroom
- Heating & cooling: Electric heating; Central air conditioning
- Interior features: Elevator in the building; Open floor plan; Living room/dining room combo; Thermostat; Walk-in closets
- Laundry & utility: Laundry closet; Dryer
Neighborhood map
What this means for you Summary
Snapshot
- This is a 2-bed/1.0-bath condo listed at $148k.
Deal economics
- At list price, monthly cash flow is $-70 ($-842/yr) — negative.
- To cash-flow at today's rent, offer at most $136k (8.4% below list).
- Meets the 1% rule at list price ($2k rent vs $148k).
- Recommended offer: $135k (9.0% below list) — sets the bar for market timing.
- Cap rate 5.7% vs local median 3.3% in Altamonte Springs — top-decile yield for the area; either an underpriced asset or a hidden risk that comps aren't pricing in. Stress-test before assuming the spread holds.
Location & tenants
- Location reads 82/100 on livability (#62 in FL, #1,095 nationally) — a professional / high-income tenant draw. Strengths: commute A+, cost of living A+, housing A+; Watch: employment C-, crime D+, amenities D-.
- Seminole (suburban): math 57% / reading 61% proficiency, ranked #13 of 73 in FL (top 18%) — acceptable for families but not a draw, mixed tenant base, ~2y average lease.
- Zoned schools: Altamonte Elementary School (math 46% / reading 51%, grade D, #1,152 of 2,144 statewide, top 55%, 589 students, 78% FRL); Milwee Middle School (math 55% / reading 56%, grade B-, #178 of 571 statewide, top 31%, 1,426 students, 64% FRL); Lyman High School (math 36% / reading 50%, grade F, #255 of 667 statewide, top 39%, 2,084 students, 53% FRL) — zoned schools average 65% FRL vs 38% district-wide (26 pts higher); higher-poverty schools than district average — tighter screening recommended.
- Market conditions: Rents soft (-1.5%/yr); 203 active listings in the ZIP; 40 comparable units currently listed for rent nearby; rentals leasing fast (median 14d on market — plan ~1-2 weeks tenant-placement turnaround); 1,979 units permitted in Seminole County in 2024 (1,191 in 5+ unit buildings).
- This rent runs 34% of the median local income ($62k/yr) — at the standard rent-burdened threshold; future hikes will face affordability resistance.
Forward outlook
- Local home prices are declining (-3.0%/yr); year-one equity from $1k of loan paydown is wiped out by about $4k of value loss. Plan a longer hold.
- Seminole County population projected at +24% by 2050 — long-run rental-demand tailwind backs the buy-and-hold thesis.
Negotiation context
- It's been on market 116 days — a 9% lower offer ($135k) is reasonable based on typical stale-listing flexibility.
- 2 sale attempts since 2y ago; this cycle's ask has dropped $22k (13%) from the opening price — seller is motivated, your offer sets the floor, not the list.
- Current owner paid $48k; list at $148k implies a 208% gain — meaningful room to come down on a strong offer.
Risks & watch-outs
- Watch-outs: HOA is 25% of rent.
- Climate carrying-cost: severe wind risk, 99% chance of damaging wind over 30y; extreme-heat days projected 7→23/yr by 2055 (HVAC capex compounding) — expect insurance premiums to compound above CPI over the hold.
Questions for the listing agent
- What do current leases actually rent for vs. the listed asking? Can we see a recent rent roll and the last 12 months of T-12 income?
- It's been on market 116 days. Have you received any prior offers? Is the seller open to a 9% concession, seller financing, or rate buy-down credit?
- What does the HOA fee cover, when was the last increase, and are there any pending special assessments or reserve-fund shortfalls?
- Any open or pending special assessments — roof, HVAC, plumbing, elevator, façade? What's the per-unit balance and payoff schedule, and is the seller paying it off at close or rolling it to the buyer?
- Why hasn't it sold? Are there any deal-killer items the seller is aware of (foundation, flood, title, zoning, code violations)?
- Is there a deadline driving the sale (1031 exchange, divorce, estate, relocation)? That informs how much negotiation room exists.
- Crime grade is D in this area — have there been break-ins, vandalism, or insurance claims at this property in the last 3 years? What carrier currently insures it and at what premium?
- The area grade is low — what's the realistic commute time and amenity access for the typical tenant pool here? Any planned neighborhood developments (good or bad) we should know about?
- What's the average days-on-market for RENTAL listings here right now (not sales)? A rising rental-DOM trend means longer vacancies and softer asking-rent achievability than the comps imply.
- What's the recent tenant-quality profile in this submarket — average credit score on applications, eviction rate, late-payment / NSF rate, and stable-employment percentage? A property-management company in the area should have these aggregated.
- How much new apartment / multifamily construction is in the pipeline within 1–3 miles? Heavy new supply (>2% of stock underway) typically softens rents 12–24 months out; light construction supports rent growth.
Investment metrics
- 1% rule
- 1.19% ✓
- Cap rate
- 5.72%
- Cash-on-cash
- -2.03%
- DSCR
- 0.91
- GRM
- 7.0
CMA / ARV
No comps found within radius.
Projected returns pro-forma
-3.0% appreciation · 0.0% rent growth · sell at horizon
- IRR
- -24.5%
- Equity multiple
- 0.20×
- Total profit
- $-33,316
- Equity at exit
- $22,052
- IRR
- -42.3%
- Equity multiple
- -0.29×
- Total profit
- $-53,564
- Equity at exit
- $12,788
Cash invested: $41,412 (down + closing). Projections, not guarantees.
Landlord ↔ Tenant lean methodology
- Overall (STATE)
- 87 Strongly Landlord-Friendly
- State Florida
- 87 Strongly Landlord-Friendly · R+3
- County
- — inherits STATE
- City
- — inherits STATE
ZIP-level market 32701
- Home prices YoY
- -34.4%
- Rents YoY
- -1.5%
- Active inventory
- 203
- Price-to-rent
- 7.0×
Monthly cashflow live
- Estimated rent
- $1,767 high interval (Pro) →
- Mortgage (P&I)
- −$776
- Tax from tax record
- −$186 /mo · $2,232/yr
- Insurance
- −$62
- HOA
- −$443
- Lot rent
- −$0
- Vacancy / Maint / Mgmt
- −$371
- Net cashflow
- $-70
Break-even live
Sensitivity live
| Price | -10% $14 | -5% $-28 | +0% $-70 | +5% $-112 | +10% $-154 |
|---|---|---|---|---|---|
| Rent | -10% $-210 | -5% $-140 | +0% $-70 | +5% $0 | +10% $69 |
| Rate | -1.0pp $4 | -0.5pp $-33 | base $-70 | +0.5pp $-109 | +1.0pp $-148 |
UW: 25.0% down · 7.5% · 30yr · 1.5% tax · 5.0% vac · 8.0% maint · 8.0% mgmt
Financing live
Cash to close
- Down payment
- $36,975
- Closing costs
- $4,437
- Reserves months
- —
- Total cash needed
- —
Loan-product check · same deal, 3 products live
Conventional
25% down · 7.5% · 30yr
- Down + closing
- —
- Monthly P&I
- —
- Monthly cashflow
- —
- DSCR
- —
- Eligible?
- —
Personal DTI + credit; lowest rate.
DSCR
20% down · 8.5% · 30yr
- Down + closing
- —
- Monthly P&I
- —
- Monthly cashflow
- —
- DSCR
- —
- Eligible?
- —
No personal income docs; deal must DSCR.
Hard money
10% down · 12.0% · 12mo
- Down + closing
- —
- Monthly P&I
- —
- Monthly cashflow
- —
- DSCR
- —
- Eligible?
- —
Short-term bridge; refi at stabilization.
Rent comps 40 comps
| Address | Beds | Baths | Sqft | Rent | $/sqft | DOM | Units | Dist |
|---|---|---|---|---|---|---|---|---|
| 700 Altamira Cir Altamonte Springs, FL | 1.0–2.0 | 1.0–2.0 | 825 | $1,781 | $2.16 | 1d | 32 | 0.15mi |
| 510 Cranes Way Altamonte Springs, FL | 1.0–2.0 | 1.0–2.0 | 967 | $1,700 | $1.76 | 1d | 1 | 0.16mi |
| 525 One Center Blvd Altamonte Springs, FL | 1.0–3.0 | 1.0–2.0 | 1082 | $1,929 | $1.78 | 1d | 17 | 0.17mi |
| 505 One Center Blvd Altamonte Springs, FL | 3.0 | 1.0–2.0 | 963 | $2,764 | $2.87 | 4d | 39 | 0.28mi |
| 425 Centerpointe Cir Altamonte Springs, FL | 2.0 | 1.0–2.0 | 884 | $3,364 | $3.81 | 1d | 127 | 0.45mi |
| 486 Centerpointe Cir Altamonte Springs, FL | 1.0–3.0 | 1.0–2.0 | 1037 | $2,290 | $2.21 | 1d | 14 | 0.47mi |
| 375 Palm Springs Dr Altamonte Springs, FL | 3.0 | 1.0–2.0 | 828 | $1,580 | $1.91 | 1d | 18 | 0.50mi |
| 285 Uptown Blvd Altamonte Springs, FL | 1.0–3.0 | 1.0–2.0 | 1166 | $2,439 | $2.09 | 0d | 26 | 0.51mi |
| 293 Loraine Dr Altamonte Springs, FL | 1.0–2.0 | 1.0 | 730 | $1,505 | $2.06 | 26d | 1 | 0.76mi |
| 940 Douglas Ave Altamonte Springs, FL | 1.0–2.0 | 1.0–2.0 | 1020 | $1,600 | $1.57 | 13d | 2 | 0.88mi |
| 365 Forestway Cir #306 Altamonte Springs, FL | 1.0 | 1.0 | 644 | $1,350 | $2.10 | 17d | 1 | 0.88mi |
| 365 Forestway Cir Altamonte Springs, FL | 1.0 | 1.0 | 644 | $1,325 | $2.06 | 26d | 2 | 0.88mi |
| 385 Woodside Dr #201 Altamonte Springs, FL | 1.0 | 1.0 | 708 | $1,500 | $2.12 | 26d | 1 | 0.89mi |
| 512 Orange Dr #30 Altamonte Springs, FL | 2.0 | 2.0 | 1002 | $1,645 | $1.64 | 20d | 1 | 0.92mi |
| 351 Lone Hill Dr #306 Altamonte Springs, FL | 1.0 | 1.0 | 644 | $1,350 | $2.10 | 7d | 1 | 0.92mi |
| 568 Orange Dr #48 Altamonte Springs, FL | 2.0 | 2.0 | 1029 | $1,545 | $1.50 | 17d | 1 | 0.93mi |
| 596 Orange Dr #150 Altamonte Springs, FL | 1.0 | 1.0 | 581 | $1,395 | $2.40 | 26d | 1 | 0.93mi |
| 592 Orange Dr #142 Altamonte Springs, FL | 1.0 | 1.0 | 633 | $1,530 | $2.42 | 26d | 1 | 0.95mi |
| 465 Forestway Cir #302 Altamonte Springs, FL | 1.0 | 1.0 | 664 | $1,249 | $1.88 | 4d | 1 | 0.95mi |
| 602 Orange Dr #173 Altamonte Springs, FL | 2.0 | 2.0 | 1029 | $1,675 | $1.63 | 26d | 1 | 0.96mi |
| 300 Lakepointe Dr #204 Altamonte Springs, FL | 1.0 | 1.0 | 712 | $1,225 | $1.72 | 26d | 1 | 0.96mi |
| 390 Lake Placid Ct #303 Altamonte Springs, FL | 1.0 | 1.0 | 644 | $1,350 | $2.10 | 20d | 1 | 0.96mi |
| 524 Orange Dr #21 Altamonte Springs, FL | 2.0 | 2.0 | 1002 | $1,695 | $1.69 | 17d | 1 | 0.96mi |
| 270 Altamonte Bay Club Cir Altamonte Springs, FL | 1.0–2.0 | 1.0–2.0 | 985 | $1,916 | $1.95 | 1d | 8 | 0.97mi |
| 320 Black Oak Ct #207 Altamonte Springs, FL | 1.0 | 1.0 | 712 | $1,350 | $1.90 | 26d | 1 | 0.97mi |
| 370 Lake Tahoe Ct Altamonte Springs, FL | 1.0 | 1.0 | 712 | $1,295 | $1.82 | 20d | 2 | 0.98mi |
| 305 Lakepointe Dr #104 Altamonte Springs, FL | 2.0 | 2.0 | 924 | $1,749 | $1.89 | 7d | 1 | 0.98mi |
| 530 Orange Dr #11 Altamonte Springs, FL | 2.0 | 2.0 | 1002 | $1,795 | $1.79 | 26d | 1 | 1.01mi |
| 614 Orange Dr #200 Altamonte Springs, FL | 1.0 | 1.0 | 633 | $1,550 | $2.45 | 7d | 1 | 1.02mi |
| 380 Lakepointe Dr #204 Altamonte Springs, FL | 1.0 | 1.0 | 712 | $1,345 | $1.89 | 7d | 1 | 1.03mi |
| 599 Calibre Crest Pkwy Altamonte Springs, FL | 1.0–2.0 | 1.0–2.5 | 951 | $2,353 | $2.47 | 0d | 22 | 1.04mi |
| 618 Orange Dr #212 Altamonte Springs, FL | 1.0 | 1.0 | 607 | $1,350 | $2.22 | 1d | 1 | 1.04mi |
| 618 Orange Dr #212 Altamonte Springs, FL | 1.0 | 1.0 | 607 | $1,350 | $2.22 | 4d | 1 | 1.04mi |
| 345 Lakepointe Dr #304 Altamonte Springs, FL | 1.0 | 1.0 | 644 | $1,375 | $2.14 | 1d | 1 | 1.05mi |
| 375 Lake Ontario Ct Altamonte Springs, FL | 1.0 | 1.0 | 678 | $1,322 | $1.95 | 6d | 2 | 1.09mi |
| 200 Maitland Ave Altamonte Springs, FL | 1.0–3.0 | 1.0–2.0 | 1115 | $1,699 | $1.52 | 26d | 3 | 1.15mi |
| 285 Wymore Rd Unit 285-104 Altamonte Springs, FL | 1.0 | 1.0 | 651 | $1,100 | $1.69 | 26d | 1 | 1.15mi |
| 285 Wymore Rd Unit 285-202 Altamonte Springs, FL | 2.0 | 1.0 | 828 | $1,375 | $1.66 | 26d | 1 | 1.15mi |
| 262 Wymore Rd Altamonte Springs, FL | 1.0 | 1.0 | 765 | $1,080 | $1.41 | 15d | 1 | 1.20mi |
| 264 Springs Colony Cir Altamonte Springs, FL | 1.0–3.0 | 1.0–2.0 | 1000 | $1,678 | $1.68 | 5d | 9 | 1.21mi |
HOA detail condo
- Monthly dues
- $443 · $5,316/yr
- Likely covers
- waterelectriclandscaping
- Assessments
- None detected in remarks — confirm with the listing agent.
Listing history 21 events
-
2026-06-22days on market $147,900 Active 116 DOM
-
2026-06-21days on market $147,900 Active 115 DOM
-
2026-06-18days on market $147,900 Active 112 DOM
-
2026-06-17days on market $147,900 Active 111 DOM
-
2026-06-16days on market $147,900 Active 110 DOM
-
2026-06-15days on market $147,900 Active 109 DOM
-
2026-06-13days on market $147,900 Active 107 DOM
-
2026-06-09days on market $147,900 Active 103 DOM
-
2026-06-08pricedays on market $147,900 Active 102 DOM
-
2026-06-07days on market $149,900 Active 101 DOM
-
2026-06-04statusdays on market $149,900 Active 98 DOM
-
2026-05-19status Pending
-
2026-04-20price $149,900
-
2026-03-31price $159,900
-
2026-02-26price $164,900
-
2026-02-10$169,990 Active
-
2025-02-03historical $1,450
-
2024-11-15price $1,450
-
2024-10-29$1,550
-
2022-04-21price $1,550
-
1996-03-07soldstatus $48,000
ⓘ Source: listings_history table (triggers on properties + properties_extension) + one-shot
backfill from property_details.listing_events for pre-trigger history.
Tax reassessment forecast FL · Resets to sale price
- Current annual tax
- $2,232 · $186/mo
- Projected year-2 tax
- $2,232 · $186/mo
- Expected delta
- $0/yr ($0/mo · 0.0%)
ⓘ Screening estimate from a state-policy table — verify with the county assessor before closing.
Climate risk First Street
- Flood 1/10 Low FEMA zone X (unshaded) · 0% chance over 30 yrs
- Wildfire 1/10 Low
- Heat 9/10 Extreme 7 d/yr ≥108°F today · 23 d/yr by 30 yrs out
- Wind 9/10 Extreme 99% chance of damaging wind over 30 yrs
- Air quality 2/10 Low 1 unhealthy d/yr today · 1 by 30 yrs out
Nearby sold comps map
Loading sold comps map…
Walkable amenities ~0.75 mi
Loading nearby amenities…
Taxation est. · year 1
- Rental income
- $21,206
- − Mortgage interest
- −$8,285
- − Property taxes
- −$2,232
- − Insurance
- −$740
- − Repairs & maintenance
- −$1,696
- − Management
- −$1,696
- − HOA
- −$5,316
- − Depreciation
- −$4,303
- Taxable loss
- −$3,062
- Est. tax savings @ 24.0%
- +$735
- After-tax cash flow
- $-107/yr
For passive investors: Depreciation is non-cash, so a rental often shows a tax loss while cash-flowing — sheltering income. Rental losses are passive: they offset passive income freely, and up to $25,000/yr can offset ordinary (W-2) income if you actively participate and your MAGI is under $100k (phasing out to $0 by $150k); unused losses carry forward. On sale, claimed depreciation is recaptured at up to 25%, and gains may owe capital-gains tax (a 1031 exchange can defer both). Figures are a year-1 estimate at your 24.0% rate — not tax advice; consult a CPA.
Schools (NCES district)
- District
- Seminole
- NCES district ID
- 1201710
- Math proficiency
- 57% ▼ -7.00%
- Reading proficiency
- 61% ▼ -1.00%
- Median HH income
- $58,478
- Composite
- 51.05/100
- National rank
- #1769
- State rank
- #13 of 73 in FL
Livability — Altamonte Springs
- Score
- 82/100
- State rank
- #62
- US rank
- #1095
Category grades
Schools grade is shown separately in the Schools card above.
Census & demographics
- Census place
- Altamonte Springs, FL
- County
- Seminole County · 436,154 people
- City population
- 62,497
- Metro
- Orlando-Kissimmee-Sanford, FL
- Population (ZIP)
- 24,592
- Household income
- $62,198
- Rent vs Own
- Severe rent burden
- 1447.0
Population outlook (Seminole County) Hauer SSP2
- Today (2025)
- 515,494 people
- By 2030
- 545,713 · +5.9%
- By 2040
- 598,068 · +16.0%
- By 2050
- 640,663 · +24.3%
- By 2075
- 724,461 · +40.5%
- By 2100
- 755,530 · +46.6%
Race, ethnicity, and origin ACS 2023
- Neighborhood character
- Diverse neighborhood (Simpson 0.67)
- Race & ethnicity
- White 46% Hispanic / Latino 28% Black 19% Two or more races 18% Asian 3%
- Hispanic origin (detail)
- Puerto Rican 16% Cuban 3% Dominican 1%
- Common ancestry
- Lithuanian 2% Romanian 2% Slovak 1%
- Foreign-born
- 15% · Canada, Jamaica
- Languages at home
- 75% English-only · Spanish 19% Other Indo-European 2% Russian/Polish/Slavic 1%
Political lean MEDSL · Seminole
- 2024 margin
- Toss-up / Even · D 47.6% · R 51.1% · Other 1.3%
- 2008→2024 swing
- -0.8pp no change · 2008: -2.8pp · 2024: -3.5pp
- All cycles
- 2024: R+3.5 2020: D+2.8 2016: R+1.6 2012: R+6.5 2008: R+2.8
Not yet ingested
- Civics
- —
Market trends
- HPI YoY
- ▼ -169.27%
- Current HPI
- 323.2703
- Rent YoY
- ▼ -1.52%
- Metro
- Orlando-Kissimmee-Sanford, FL
- State GDP YoY
- ▲ 3.28%
- F500 in state
- 36
Industry mix (Fortune 500 HQ in FL)
| Industry | F500 HQs | Revenue |
|---|---|---|
| Industrial Technology | 2 | $29B |
|
||
| Insurance | 2 | $17B |
|
||
| Retail | 1 | $60B |
|
||
| Technology Distribution | 1 | $58B |
|
||
| Homebuilding | 1 | $35B |
|
||
| Technology Manufacturing | 1 | $35B |
|
||
Price history
+212.3% since first listed10 events — show timeline
- 2026-05-19 Pending — Stellar MLS as Distributed by MLS Grid
- 2026-04-20 Price Changed $149,900 Stellar MLS as Distributed by MLS Grid
- 2026-03-31 Price Changed $159,900 Stellar MLS as Distributed by MLS Grid
- 2026-02-26 Price Changed $164,900 Stellar MLS as Distributed by MLS Grid
- 2026-02-10 Listed $169,990 Stellar MLS as Distributed by MLS Grid
- 2025-02-03 Rental Removed $1,450 STELLARMLS
- 2024-11-15 Price Changed $1,450 STELLARMLS
- 2024-10-29 Listed for Rent $1,550 STELLARMLS
- 2022-04-21 Price Changed $1,550 RENT.
- 1996-03-07 Sold (Public Records) $48,000 Public Records
Property tax history
+10.8%/yrLatest (2025): $2,232 · +8.4% YoY. Source: county tax records.
Cash-flow waterfall
monthlySold comps — $/sqft
last 12 mo · ≤1 miLoading sold comps…