 Multi-family
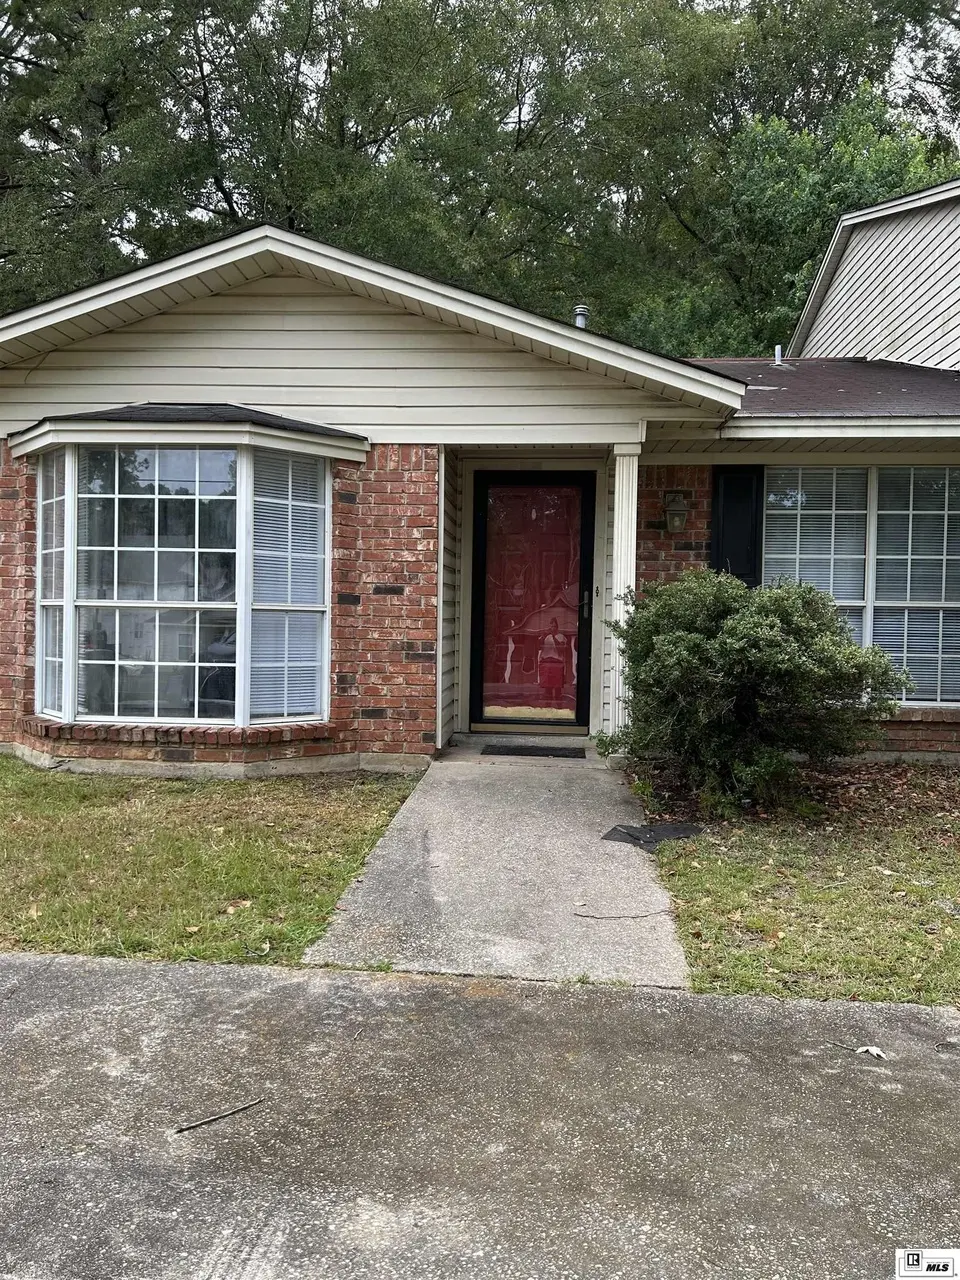
207 S Maple St · Ruston, LA
Flood risk 1/10 · Minimal
- FEMA flood zone
- X (unshaded)
- Chance of flooding over 30 yrs
- 0.0%
- Est. flood insurance / yr
- $507 – $1,088
Fire risk 3/10 · Minor
- Est. fire insurance / yr
- $1,269 – $2,357
Heat risk 7/10 · Major
- Hot days now (above 111°F)
- 7 days/yr
- Hot days in 30 yrs
- 21 days/yr
Wind risk 6/10 · Moderate
- Chance of severe wind over 30 yrs
- 67.0%
Air-quality risk 1/10 · Minimal
- Unhealthy air days now
- 0 days/yr
- Unhealthy air days in 30 yrs
- 0 days/yr
Risk factors via First Street. Map © Google.
Why this score? — see what drove the B+ grade
The composite is a weighted blend of 9 inputs, each scored 0–100. Each bar is that input's sub-score; the figure is the points it added to the 100-point composite (weight × sub-score).
- Cash flow +30.0/30.0
- ARV discount +15.0/15.0
- 1% rule +10.0/10.0
- DSCR +10.0/10.0
- Rent growth +4.2/5.0
- Livability +3.4/5.0
- Schools +3.3/10.0
- Condition / age +2.5/5.0
- Appreciation +0.0/10.0
$125,000
🖨 Deal sheet (PDF) 📄 Offer letter ✓ Due diligence
Multi-family units
County records classify this as Multi-Family (2-4 Unit). Listing-text estimate: 1 unit. estimate disagrees with records
Listing remarks MLS
This one story has 2 bedrooms, 1 bath. It is located near Tech.
Key facts
- 6,098 sq ft lot
- Built 1986
- Listed 438 days
Neighborhood map
What this means for you Summary
Snapshot
- This is a 2-bed/1.0-bath multifamily listed at $125k.
Deal economics
- At list price, monthly cash flow is $749 ($9k/yr) — positive.
- The deal already cash-flows at list — no discount required.
- Meets the 1% rule at list price ($2k rent vs $125k).
- Recommended offer: $110k (12.0% below list) — sets the bar for market timing.
- Cap rate 13.5% vs local median 3.2% in Ruston — top-decile yield for the area; either an underpriced asset or a hidden risk that comps aren't pricing in. Stress-test before assuming the spread holds.
Location & tenants
- Location reads 68/100 on livability (#86 in LA) — a middle-class / working-renter tenant base. Strengths: cost of living A+, health & safety A+; Watch: amenities C-, crime F, commute F.
- Lincoln Parish (town): math 35% / reading 45% proficiency, ranked #24 of 98 in LA (top 24%) — families likely to look elsewhere, expect single-tenant / working-renter base with shorter leases; 62% free/reduced lunch — lower-income household profile, screen leases tightly.
- Zoned schools: Glen View Elementary School (487 students, 69% FRL); Ruston Junior High School (math 23% / reading 38%, grade F, #112 of 218 statewide, top 52%, 558 students, 60% FRL); Ruston High School (math 53% / reading 60%, grade C, #26 of 265 statewide, top 10%, 1,310 students, 50% FRL) — zoned schools at 59% FRL track the district average.
- Market conditions: Rents rising fast (+6.6%/yr); 277 active listings in the ZIP; 2 comparable units currently listed for rent nearby; lower-income renter base — watch delinquency; 171 units permitted in Lincoln Parish in 2024 (0 in 5+ unit buildings).
- At $1,899/mo this rent would consume 62% of the median local household income ($37k/yr) (locally 2476% of renters already pay >50% of income on rent) — very limited rent-growth headroom before tenants either downsize or default.
Forward outlook
- Local home prices are declining (-3.0%/yr); year-one equity from $864 of loan paydown is wiped out by about $4k of value loss. Plan a longer hold.
- Lincoln County population projected at +15% by 2050 — long-run rental-demand tailwind backs the buy-and-hold thesis.
- At projected returns (-3.0% appreciation + 6.6% rent growth), your $35k cash investment doubles in ~5 years — after that, you're playing with house money.
Negotiation context
- It's been on market 439 days — a 12% lower offer ($110k) is reasonable based on typical stale-listing flexibility.
- 3 sale attempts since 5y ago; this cycle's ask is 14186% above the opening price — seller raised mid-cycle; expect resistance to lowballs.
- Current owner paid $67k; list at $125k implies a 87% gain — meaningful room to come down on a strong offer.
Risks & watch-outs
- Climate carrying-cost: major wind risk, 67% chance of damaging wind over 30y; extreme-heat days projected 7→21/yr by 2055 (HVAC capex compounding) — expect insurance premiums to compound above CPI over the hold.
Questions for the listing agent
- It's been on market 439 days. Have you received any prior offers? Is the seller open to a 12% concession, seller financing, or rate buy-down credit?
- Why hasn't it sold? Are there any deal-killer items the seller is aware of (foundation, flood, title, zoning, code violations)?
- Is there a deadline driving the sale (1031 exchange, divorce, estate, relocation)? That informs how much negotiation room exists.
- Schools are B-rated — typically a magnet for longer-tenancy family renters. What's the average tenant stay here, and is there a school-zone premium baked into asking?
- Crime grade is F in this area — have there been break-ins, vandalism, or insurance claims at this property in the last 3 years? What carrier currently insures it and at what premium?
- What's the average days-on-market for RENTAL listings here right now (not sales)? A rising rental-DOM trend means longer vacancies and softer asking-rent achievability than the comps imply.
- What's the recent tenant-quality profile in this submarket — average credit score on applications, eviction rate, late-payment / NSF rate, and stable-employment percentage? A property-management company in the area should have these aggregated.
- How much new apartment / multifamily construction is in the pipeline within 1–3 miles? Heavy new supply (>2% of stock underway) typically softens rents 12–24 months out; light construction supports rent growth.
Investment metrics
- 1% rule
- 1.52% ✓
- Cap rate
- 13.48%
- Cash-on-cash
- 25.67%
- DSCR
- 2.14
- GRM
- 5.5
CMA / ARV
- ARV (median comp)
- $180,121
- List price
- $125,000
- Delta
- -30.60%
- Verdict
- UNDERPRICED
- Comps
- 11 within 1.0 mi
Projected returns pro-forma
-3.0% appreciation · 6.6% rent growth · sell at horizon
- IRR
- 23.0%
- Equity multiple
- 1.99×
- Total profit
- $34,514
- Equity at exit
- $18,638
- IRR
- 33.1%
- Equity multiple
- 4.51×
- Total profit
- $122,785
- Equity at exit
- $10,808
Cash invested: $35,000 (down + closing). Projections, not guarantees.
Landlord ↔ Tenant lean methodology
- Overall (STATE)
- 90 Strongly Landlord-Friendly
- State Louisiana
- 90 Strongly Landlord-Friendly · R+12
- County
- — inherits STATE
- City
- — inherits STATE
ZIP-level market 71270
- Home prices YoY
- -16.1%
- Rents YoY
- 6.6%
- Active inventory
- 277
- Price-to-rent
- 11.0×
Monthly cashflow live
- Estimated rent
- $1,899 medium interval (Pro) →
- Mortgage (P&I)
- −$656
- Tax from tax record
- −$44 /mo · $527/yr
- Insurance
- −$52
- HOA
- −$0
- Vacancy / Maint / Mgmt
- −$399
- Net cashflow
- $749
Break-even live
Sensitivity live
| Price | -10% $819 | -5% $784 | +0% $749 | +5% $713 | +10% $678 |
|---|---|---|---|---|---|
| Rent | -10% $599 | -5% $674 | +0% $749 | +5% $824 | +10% $899 |
| Rate | -1.0pp $812 | -0.5pp $780 | base $749 | +0.5pp $716 | +1.0pp $683 |
2-unit breakdown (identical units grouped — click to expand)
| Units | Beds | Baths | Est. rent |
|---|---|---|---|
| 2× units | 2 | 1 | $1,900 |
| #1 | 2 | 1 | $950 |
| #2 | 2 | 1 | $950 |
| Total (2 units) | $1,899 | ||
UW: 25.0% down · 7.5% · 30yr · 1.5% tax · 5.0% vac · 8.0% maint · 8.0% mgmt
Financing live
Cash to close
- Down payment
- $31,250
- Closing costs
- $3,750
- Reserves months
- —
- Total cash needed
- —
Loan-product check · same deal, 3 products live
Conventional
25% down · 7.5% · 30yr
- Down + closing
- —
- Monthly P&I
- —
- Monthly cashflow
- —
- DSCR
- —
- Eligible?
- —
Personal DTI + credit; lowest rate.
DSCR
20% down · 8.5% · 30yr
- Down + closing
- —
- Monthly P&I
- —
- Monthly cashflow
- —
- DSCR
- —
- Eligible?
- —
No personal income docs; deal must DSCR.
Hard money
10% down · 12.0% · 12mo
- Down + closing
- —
- Monthly P&I
- —
- Monthly cashflow
- —
- DSCR
- —
- Eligible?
- —
Short-term bridge; refi at stabilization.
Rent comps 2 comps
| Address | Beds | Baths | Sqft | Rent | $/sqft | DOM | Units | Dist |
|---|---|---|---|---|---|---|---|---|
| 402 Kennon Ln Unit K05 Ruston, LA | 2.0 | 2.0 | 866 | $850 | $0.98 | 45d | 1 | 0.39mi |
| 1033 Saratoga St Ruston, LA | 3.0 | 1.0 | 872 | $950 | $1.09 | 45d | 1 | 0.60mi |
Listing history 17 events
-
2026-06-15days on market $125,000 Active 439 DOM
-
2026-06-14days on market $125,000 Active 437 DOM
-
2026-06-12days on market $125,000 Active 436 DOM
-
2026-06-09days on market $125,000 Active 433 DOM
-
2026-06-08days on market $125,000 Active 432 DOM
-
2026-06-07days on market $125,000 Active 431 DOM
-
2026-06-05days on market $125,000 Active 428 DOM
-
2026-06-03days on market $125,000 Active 427 DOM
-
2026-06-02days on market $125,000 Active 426 DOM
-
2026-06-01days on market $125,000 Active 425 DOM
-
2026-05-31days on market $125,000 Active 424 DOM
-
2026-05-30days on market $125,000 Active 423 DOM
-
2026-04-24$875
-
2025-04-02$125,000 Active 63-char remark
Show marketing remark (63 chars)
This one story has 2 bedrooms, 1 bath. It is located near Tech.
-
2022-01-12soldstatus
-
2021-11-29$93,000
-
2004-03-02soldstatus $67,000
ⓘ Source: listings_history table (triggers on properties + properties_extension) + one-shot
backfill from property_details.listing_events for pre-trigger history.
Tax reassessment forecast LA · Resets to sale price
- Current annual tax
- $527 · $44/mo
- Projected year-2 tax
- $688 · $57/mo
- Expected delta
- +$160/yr (+$13/mo · 30.3%)
ⓘ Screening estimate from a state-policy table — verify with the county assessor before closing.
Climate risk First Street
- Flood 1/10 Low FEMA zone X (unshaded) · 0% chance over 30 yrs
- Wildfire 3/10 Moderate
- Heat 7/10 Severe 7 d/yr ≥111°F today · 21 d/yr by 30 yrs out
- Wind 6/10 Major 67% chance of damaging wind over 30 yrs
- Air quality 1/10 Low 0 unhealthy d/yr today · 0 by 30 yrs out
Nearby sold comps map
Loading sold comps map…
Walkable amenities ~0.75 mi
Loading nearby amenities…
Taxation est. · year 1
- Rental income
- $22,788
- − Mortgage interest
- −$7,002
- − Property taxes
- −$527
- − Insurance
- −$625
- − Repairs & maintenance
- −$1,823
- − Management
- −$1,823
- − Depreciation
- −$3,636
- Taxable income
- $7,351
- Est. tax owed @ 24.0%
- −$1,764
- After-tax cash flow
- $7,220/yr
For passive investors: Depreciation is non-cash, so a rental often shows a tax loss while cash-flowing — sheltering income. Rental losses are passive: they offset passive income freely, and up to $25,000/yr can offset ordinary (W-2) income if you actively participate and your MAGI is under $100k (phasing out to $0 by $150k); unused losses carry forward. On sale, claimed depreciation is recaptured at up to 25%, and gains may owe capital-gains tax (a 1031 exchange can defer both). Figures are a year-1 estimate at your 24.0% rate — not tax advice; consult a CPA.
Schools (NCES district)
- District
- Lincoln Parish
- NCES district ID
- 2200990
- Math proficiency
- 35% ▼ -32.00%
- Reading proficiency
- 45% ▼ -27.00%
- Median HH income
- $33,901
- Composite
- 32.92/100
- National rank
- #5599
- State rank
- #24 of 98 in LA
Livability — Ruston
- Score
- 68/100
- State rank
- #86
- US rank
- #9522
Category grades
Schools grade is shown separately in the Schools card above.
Census & demographics
- Census place
- Ruston, LA
- County
- Lincoln Parish · 32,885 people
- City population
- 32,885
- Metro
- Ruston, LA
- Population (ZIP)
- 32,885
- Household income
- $36,791
- Rent vs Own
- Severe rent burden
- 2476.0
Population outlook (Lincoln County) Hauer SSP2
- Today (2025)
- 49,595 people
- By 2030
- 50,954 · +2.7%
- By 2040
- 53,601 · +8.1%
- By 2050
- 57,178 · +15.3%
- By 2075
- 69,580 · +40.3%
- By 2100
- 79,862 · +61.0%
Race, ethnicity, and origin ACS 2023
- Neighborhood character
- Diverse neighborhood (Simpson 0.60)
- Race & ethnicity
- White 51% Black 38% Two or more races 6% Hispanic / Latino 4% Asian 2% Native American 1%
- Common ancestry
- Lithuanian 4% Slovak 2% Serbian 1%
- Foreign-born
- 3% · Canada, Vietnam
- Languages at home
- 95% English-only · Spanish 2% Other Indo-European 1% Arabic 1%
Political lean MEDSL · Lincoln
- 2024 margin
- Strong R (+25.4) · D 36.5% · R 62.0% · Other 1.6%
- 2008→2024 swing
- -13.0pp toward R · 2008: -12.5pp · 2024: -25.4pp
- All cycles
- 2024: R+25.4 2020: R+19.5 2016: R+19.6 2012: R+14.7 2008: R+12.5
Not yet ingested
- Civics
- —
Market trends
- HPI YoY
- ▼ -40.69%
- Current HPI
- 212.8211
- Rent YoY
- ▲ 6.60%
- Metro
- Ruston, LA
- State GDP YoY
- ▲ 3.29%
- F500 in state
- 10
Industry mix (Fortune 500 HQ in LA)
| Industry | F500 HQs | Revenue |
|---|---|---|
| Telecommunications | 2 | $23B |
|
||
| Utilities | 1 | $12B |
|
||
| Wholesale / Distribution | 1 | $5B |
|
||
| Advertising | 1 | $2B |
|
||
Price history
+86.6% since first listed5 events — show timeline
- 2026-04-24 Listed for Rent $875 BUILDIUM
- 2025-04-02 Listed $125,000 NELABOR
- 2022-01-12 Sold (MLS) — NELABOR
- 2021-11-29 Listed $93,000 NELABOR
- 2004-03-02 Sold (Public Records) $67,000 Public Records
Property tax history
-2.3%/yrLatest (2025): $527 · +0.0% YoY. Source: county tax records.
Cash-flow waterfall
monthlySold comps — $/sqft
last 12 mo · ≤1 miLoading sold comps…