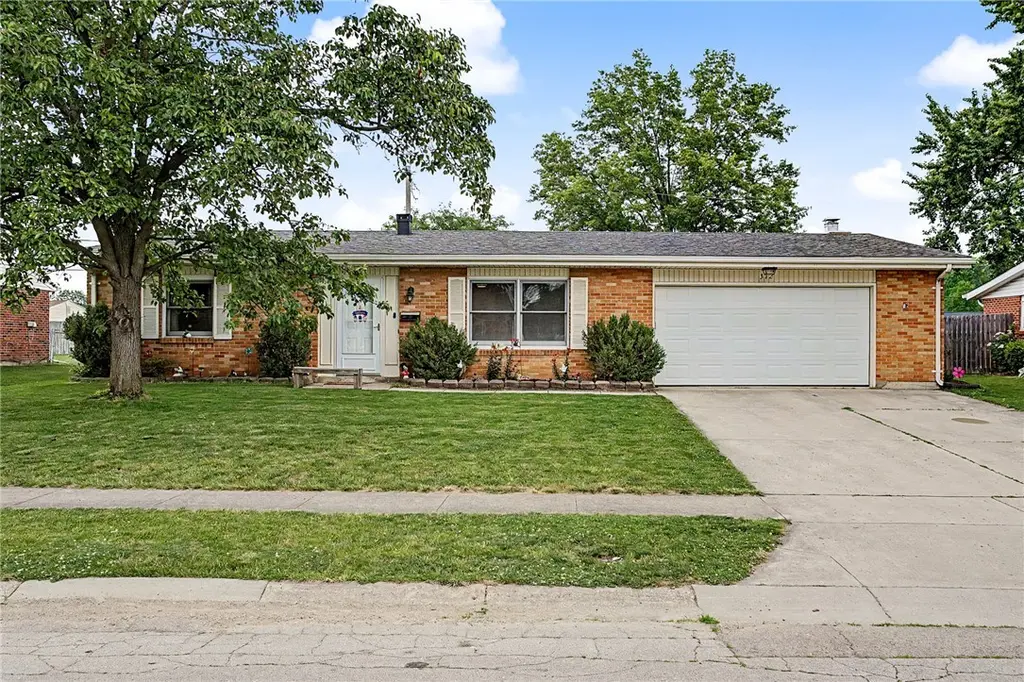
312 Highland Dr · Englewood, OH
Flood risk 1/10 · Minimal
- FEMA flood zone
- X (unshaded)
- Chance of flooding over 30 yrs
- 0.0%
- Est. flood insurance / yr
- $507 – $1,088
Fire risk 1/10 · Minimal
- Est. fire insurance / yr
- $713 – $1,323
Heat risk 3/10 · Minor
- Hot days now (above 101°F)
- 7 days/yr
- Hot days in 30 yrs
- 18 days/yr
Wind risk 2/10 · Minimal
- Chance of severe wind over 30 yrs
- —
Air-quality risk 2/10 · Minimal
- Unhealthy air days now
- 1 days/yr
- Unhealthy air days in 30 yrs
- 2 days/yr
Risk factors via First Street. Map © Google.
Why this score? — see what drove the D+ grade
The composite is a weighted blend of 9 inputs, each scored 0–100. Each bar is that input's sub-score; the figure is the points it added to the 100-point composite (weight × sub-score).
- Cash flow +13.1/30.0
- ARV discount +12.7/15.0
- Schools +5.0/10.0
- 1% rule +3.9/10.0
- DSCR +3.9/10.0
- Livability +3.5/5.0
- Condition / age +2.5/5.0
- Rent growth +2.4/5.0
- Appreciation +0.0/10.0
$214,900
🖨 Deal sheet (PDF) 📄 Offer letter ✓ Due diligence
Listing remarks MLS
Excellent opportunity to get a move-in ready house with tons of additional upside potential. House could use a few cosmetic updates and paint, but has had a number of full or partial system updates already done over the past several years. Perfect for an investor looking for a quick flip or landlord investor as rental or owner occupant willing to put in some cosmetic work in return for great equity. You can easily add substantial value. Priced at as-is cash price point. Seller has never occupied property and makes no representations.
Key facts
- Galley kitchen
- All brick ranch
- Natural light
Tags
Property features AI
Finance
- Financial info: Property is for sale
Exterior
- Parking: Attached two-car garage with garage door opener and storage
- Utilities: Public water; Sewer available; Natural gas available
- Home design: Single-story home; Brick and vinyl siding exterior; Residential zoning
- Construction: Slab foundation
- Exterior features: Fenced yard; Porch; Patio; Storage shed
Interior
- Kitchen: Dishwasher; Range; Refrigerator; Kitchen island; Pantry; Kitchen open to family room
- Bedrooms: Bedroom (Main level) — 12 x 10; Bedroom (Main level) — 12 x 9
- Bathrooms: 1 full bathroom; 1 half bathroom
- Interior features: Ceiling fans; High-speed internet; Kitchen island; Kitchen-family room combo; Pantry; Double-pane windows; Wood-burning fireplace with insert
- Laundry & utility: Washer; Dryer; Utility room (Main level) — 7 x 5; Gas water heater
Neighborhood map
What this means for you Summary
Snapshot
- This is a 3-bed/1.5-bath single-family listed at $215k.
Deal economics
- At list price, monthly cash flow is $-7 ($-79/yr) — negative.
- To cash-flow at today's rent, offer at most $214k (0.5% below list).
- To meet the 1% rule (rent ≥ 1% of price), the offer needs to be $190k (11.4% below list).
- Recommended offer: $190k (11.4% below list) — sets the bar for 1% rule.
Location & tenants
- Location reads 69/100 on livability (#517 in OH) — a middle-class / working-renter tenant base. Strengths: cost of living A+, housing A+, schools A; Watch: employment C-, amenities F, commute F.
- Northmont City (suburban): math 52% / reading 62% proficiency, ranked #318 of 656 in OH (top 48%) — acceptable for families but not a draw, mixed tenant base, ~2y average lease.
- Market conditions: Rents soft (-0.5%/yr); 88 active listings in the ZIP; 8 comparable units currently listed for rent nearby; rentals at typical pace (median 15d on market — plan ~3-4 weeks tenant-placement turnaround); solid renter incomes; 907 units permitted in Montgomery County in 2024 (416 in 5+ unit buildings).
- This rent runs 30% of the median local income ($75k/yr) — at the standard rent-burdened threshold; future hikes will face affordability resistance.
Forward outlook
- Local home prices are declining (-3.0%/yr); year-one equity from $1k of loan paydown is wiped out by about $6k of value loss. Plan a longer hold.
- Montgomery County population projected at -10% by 2050 — secular population decline; favor cash flow + early exit over multi-decade hold.
Negotiation context
- Only 8 days on market — expect competitive offers; lowballing is unlikely to land.
- 4 sale attempts since 16y ago with the ask held roughly flat each time — persistent listings suggest the price (not the market) is what's stuck; bring a comps-based counter.
- Current owner paid $143k; list at $215k implies a 50% gain — meaningful room to come down on a strong offer.
Questions for the listing agent
- What do current leases actually rent for vs. the listed asking? Can we see a recent rent roll and the last 12 months of T-12 income?
- Built in 1971 — when were the roof, HVAC, electrical panel, plumbing, and water heater last replaced?
- Is there a deadline driving the sale (1031 exchange, divorce, estate, relocation)? That informs how much negotiation room exists.
- Schools are A-rated — typically a magnet for longer-tenancy family renters. What's the average tenant stay here, and is there a school-zone premium baked into asking?
- The area grade is low — what's the realistic commute time and amenity access for the typical tenant pool here? Any planned neighborhood developments (good or bad) we should know about?
- What's the average days-on-market for RENTAL listings here right now (not sales)? A rising rental-DOM trend means longer vacancies and softer asking-rent achievability than the comps imply.
- What's the recent tenant-quality profile in this submarket — average credit score on applications, eviction rate, late-payment / NSF rate, and stable-employment percentage? A property-management company in the area should have these aggregated.
- How much new for-sale + rental construction is in the pipeline within 1–3 miles? Heavy new supply typically softens prices + rents 12–24 months out; constrained supply supports both.
Investment metrics
- 1% rule
- 0.89% ✗
- Cap rate
- 6.26%
- Cash-on-cash
- -0.13%
- DSCR
- 0.99
- GRM
- 9.4
CMA / ARV
- ARV (on-the-fly)
- $243,040
- Comps found
- 12
Show comp detail 12 sales within ~0.75 mi
| Address | Dist | Beds/Ba | Sqft | Sold | Price | $/sf | Match |
|---|---|---|---|---|---|---|---|
| 313 Highland Dr | 0.03mi | 3/2.0 | 1,568 (0%) | 2mo | $200,000 | $128 | 95 |
| 804 Treherne Ln | 0.25mi | 3/1.5 | 1,449 (-8%) | 1mo | $215,000 | $148 | 75 |
| 7039 Monte Carlo Dr | 0.44mi | 3/1.5 | 1,470 (-6%) | 0mo | $230,000 | $156 | 69 |
| 189 Katy Ln | 0.71mi | 3/1.5 | 1,568 (0%) | 0mo | $210,000 | $134 | 67 |
| 440 Katy Ln | 0.28mi | 4/2.0 (+1) | 1,709 (+9%) | 0mo | $249,000 | $146 | 65 |
| 1003 Heathwood Dr | 0.43mi | 3/2.0 | 1,448 (-8%) | 1mo | $220,750 | $152 | 64 |
| 1011 Hazel Ave | 0.46mi | 4/1.5 (+1) | 1,448 (-8%) | 0mo | $210,000 | $145 | 61 |
| 4006 Loop Dr | 0.39mi | 3/2.0 | 1,779 (+14%) | 0mo | $276,500 | $155 | 57 |
| 104 Overla Blvd | 0.59mi | 3/2.0 | 1,440 (-8%) | 1mo | $237,000 | $165 | 56 |
| 211 Katy Ln | 0.67mi | 4/2.0 (+1) | 1,617 (+3%) | 2mo | $268,000 | $166 | 55 |
| 1028 Hazel Ave | 0.54mi | 3/2.0 | 1,386 (-12%) | 1mo | $227,000 | $164 | 53 |
| 6925 Park Vista Rd | 0.70mi | 3/2.0 | 1,719 (+10%) | 1mo | $275,000 | $160 | 48 |
Match score weights: distance 35% · size 25% · config 20% · recency 20%. Top-matched comps best support the ARV.
Projected returns pro-forma
-3.0% appreciation · 0.0% rent growth · sell at horizon
- IRR
- -20.0%
- Equity multiple
- 0.32×
- Total profit
- $-40,775
- Equity at exit
- $32,042
- IRR
- -21.4%
- Equity multiple
- 0.05×
- Total profit
- $-57,425
- Equity at exit
- $18,581
Cash invested: $60,172 (down + closing). Projections, not guarantees.
Landlord ↔ Tenant lean methodology
- Overall (STATE)
- 73 Landlord-Friendly
- State Ohio
- 73 Landlord-Friendly · R+6
- County
- — inherits STATE
- City
- — inherits STATE
ZIP-level market 45322
- Rents YoY
- -0.5%
- Active inventory
- 88
- Price-to-rent
- 9.4×
Monthly cashflow live
- Estimated rent
- $1,904 high interval (Pro) →
- Mortgage (P&I)
- −$1,127
- Tax from tax record
- −$294 /mo · $3,528/yr
- Insurance
- −$90
- HOA
- −$0
- Vacancy / Maint / Mgmt
- −$400
- Net cashflow
- $-7
Break-even live
Sensitivity live
| Price | -10% $115 | -5% $54 | +0% $-7 | +5% $-67 | +10% $-128 |
|---|---|---|---|---|---|
| Rent | -10% $-157 | -5% $-82 | +0% $-7 | +5% $69 | +10% $144 |
| Rate | -1.0pp $102 | -0.5pp $48 | base $-7 | +0.5pp $-62 | +1.0pp $-119 |
UW: 25.0% down · 7.5% · 30yr · 1.5% tax · 5.0% vac · 8.0% maint · 8.0% mgmt
Financing live
Cash to close
- Down payment
- $53,725
- Closing costs
- $6,447
- Reserves months
- —
- Total cash needed
- —
Loan-product check · same deal, 3 products live
Conventional
25% down · 7.5% · 30yr
- Down + closing
- —
- Monthly P&I
- —
- Monthly cashflow
- —
- DSCR
- —
- Eligible?
- —
Personal DTI + credit; lowest rate.
DSCR
20% down · 8.5% · 30yr
- Down + closing
- —
- Monthly P&I
- —
- Monthly cashflow
- —
- DSCR
- —
- Eligible?
- —
No personal income docs; deal must DSCR.
Hard money
10% down · 12.0% · 12mo
- Down + closing
- —
- Monthly P&I
- —
- Monthly cashflow
- —
- DSCR
- —
- Eligible?
- —
Short-term bridge; refi at stabilization.
Rent comps 8 comps
| Address | Beds | Baths | Sqft | Rent | $/sqft | DOM | Units | Dist |
|---|---|---|---|---|---|---|---|---|
| 421 Porter Dr Englewood, OH | 2.0 | 2.0 | 1371 | $1,650 | $1.20 | 15d | 1 | 0.20mi |
| 321 Lauren Circle Dr Englewood, OH | 3.0 | 2.0 | 1400 | $1,700 | $1.21 | 15d | 1 | 0.22mi |
| 416 W Wenger Rd Englewood, OH | 3.0 | 1.5 | 1249 | $2,000 | $1.60 | 3d | 1 | 0.47mi |
| 1222 Sunset Dr Englewood, OH | 3.0 | 2.5 | 1880 | $2,175 | $1.16 | 15d | 1 | 0.52mi |
| 603 Rolice Ct Englewood, OH | 3.0 | 2.0 | 1449 | $2,000 | $1.38 | 22d | 1 | 0.66mi |
| 5011 Scothills Dr Englewood, OH | 3.0 | 2.0 | 1060 | $1,595 | $1.50 | 3d | 1 | 0.80mi |
| 6844 Union Rd Englewood, OH | 3.0 | 2.0 | 1700 | $2,100 | $1.24 | 3d | 1 | 0.88mi |
| 124 Chestnut St Unit 203 Englewood, OH | 2.0 | 2.0 | 1125 | $895 | $0.80 | 44d | 1 | 1.32mi |
Listing history 7 events
-
2026-06-18status $214,900 Pending 8 DOM
-
2026-06-18days on market $214,900 Active 8 DOM
-
2026-06-17days on market $214,900 Active 7 DOM
-
2026-06-16days on market $214,900 Active 6 DOM
-
2026-06-15days on market $214,900 Active 5 DOM
-
2026-06-14remarks 699-char remark
-
2026-06-14$214,900 Active 3 DOM
ⓘ Source: listings_history table (triggers on properties + properties_extension) + one-shot
backfill from property_details.listing_events for pre-trigger history.
Tax reassessment forecast OH · Partial reset (capped growth)
- Current annual tax
- $3,528 · $294/mo
- Projected year-2 tax
- $3,528 · $294/mo
- Expected delta
- $0/yr ($0/mo · 0.0%)
ⓘ Screening estimate from a state-policy table — verify with the county assessor before closing.
Climate risk First Street
- Flood 1/10 Low FEMA zone X (unshaded) · 0% chance over 30 yrs
- Wildfire 1/10 Low
- Heat 3/10 Moderate 7 d/yr ≥101°F today · 18 d/yr by 30 yrs out
- Wind 2/10 Low
- Air quality 2/10 Low 1 unhealthy d/yr today · 2 by 30 yrs out
Nearby sold comps map
Loading sold comps map…
Walkable amenities ~0.75 mi
Loading nearby amenities…
Taxation est. · year 1
- Rental income
- $22,845
- − Mortgage interest
- −$12,038
- − Property taxes
- −$3,528
- − Insurance
- −$1,074
- − Repairs & maintenance
- −$1,828
- − Management
- −$1,828
- − Depreciation
- −$6,252
- Taxable loss
- −$3,702
- Est. tax savings @ 24.0%
- +$889
- After-tax cash flow
- $810/yr
For passive investors: Depreciation is non-cash, so a rental often shows a tax loss while cash-flowing — sheltering income. Rental losses are passive: they offset passive income freely, and up to $25,000/yr can offset ordinary (W-2) income if you actively participate and your MAGI is under $100k (phasing out to $0 by $150k); unused losses carry forward. On sale, claimed depreciation is recaptured at up to 25%, and gains may owe capital-gains tax (a 1031 exchange can defer both). Figures are a year-1 estimate at your 24.0% rate — not tax advice; consult a CPA.
Schools (NCES district)
- District
- Northmont City
- NCES district ID
- 3904872
- Math proficiency
- 52% ▼ -15.00%
- Reading proficiency
- 62% ▼ -8.00%
- Median HH income
- $60,230
- Composite
- 49.53/100
- National rank
- #1995
- State rank
- #318 of 656 in OH
Livability — Englewood
- Score
- 69/100
- State rank
- #517
- US rank
- #8768
Category grades
Schools grade is shown separately in the Schools card above.
Census & demographics
- Census place
- Englewood, OH
- County
- Montgomery County · 459,541 people
- City population
- 20,884
- Metro
- Dayton-Kettering, OH
- Population (ZIP)
- 20,884
- Household income
- $75,349
- Rent vs Own
- Severe rent burden
- 357.0
Population outlook (Montgomery County) Hauer SSP2
- Today (2025)
- 523,241 people
- By 2030
- 514,948 · -1.6%
- By 2040
- 493,378 · -5.7%
- By 2050
- 469,639 · -10.2%
- By 2075
- 418,360 · -20.0%
- By 2100
- 353,315 · -32.5%
Race, ethnicity, and origin ACS 2023
- Neighborhood character
- Predominantly White (80%)
- Race & ethnicity
- White 80% Black 11% Two or more races 6% Hispanic / Latino 3% Asian 1%
- Common ancestry
- Lithuanian 2% Slovak 2% Romanian 1%
- Foreign-born
- 3% · China, Canada
- Languages at home
- 96% English-only · Spanish 2%
Political lean MEDSL · Montgomery
- 2024 margin
- Toss-up / Even · D 49.8% · R 49.3%
- 2008→2024 swing
- -5.8pp toward R · 2008: 6.2pp · 2024: 0.5pp
- All cycles
- 2024: D+0.5 2020: D+2.2 2016: R+1.2 2012: D+3.1 2008: D+6.2
Not yet ingested
- Civics
- —
Market trends
- HPI YoY
- ▼ -176.42%
- Current HPI
- 218.5409
- Rent YoY
- ▼ -0.45%
- Metro
- Dayton-Kettering, OH
- State GDP YoY
- ▲ 1.98%
- F500 in state
- 48
Industry mix (Fortune 500 HQ in OH)
| Industry | F500 HQs | Revenue |
|---|---|---|
| Insurance | 3 | $145B |
|
||
| Industrial Machinery | 3 | $49B |
|
||
| Financial Services | 3 | $24B |
|
||
| Consumer Goods | 2 | $93B |
|
||
| Aerospace / Defense | 2 | $47B |
|
||
| Utilities | 2 | $33B |
|
||
Price history
+273.7% since first listed17 events — show timeline
- 2026-06-09 Listed $214,900 Dayton MLS
- 2021-03-05 Sold (MLS) $142,900 Dayton MLS
- 2021-03-05 Sold (MLS) $142,900 Dayton MLS
- 2021-01-28 Contingent — Dayton MLS
- 2021-01-19 Price Changed $134,900 Dayton MLS
- 2021-01-12 Price Changed $137,900 Dayton MLS
- 2021-01-04 Listed $139,900 Dayton MLS
- 2010-11-12 Sold (Public Records) $85,000 Public Records
- 2010-11-05 Sold (MLS) $85,000 Dayton MLS
- 2010-11-05 Sold (MLS) $85,000 Dayton MLS
- 2010-10-18 Listing Removed — Dayton MLS
- 2010-08-05 Listed $85,000 Dayton MLS
- 2010-07-31 Listing Removed — Dayton MLS
- 2010-02-01 Listed $95,000 Dayton MLS
- 2007-01-18 Sold (Public Records) $127,500 Public Records
- 2004-10-27 Sold (Public Records) $120,000 Public Records
- 1986-11-04 Sold (Public Records) $57,500 Public Records
Property tax history
+2.7%/yrLatest (2025): $3,528 · +5.7% YoY. Source: county tax records.
Cash-flow waterfall
monthlySold comps — $/sqft
last 12 mo · ≤1 miLoading sold comps…