 🏗️ New Construction
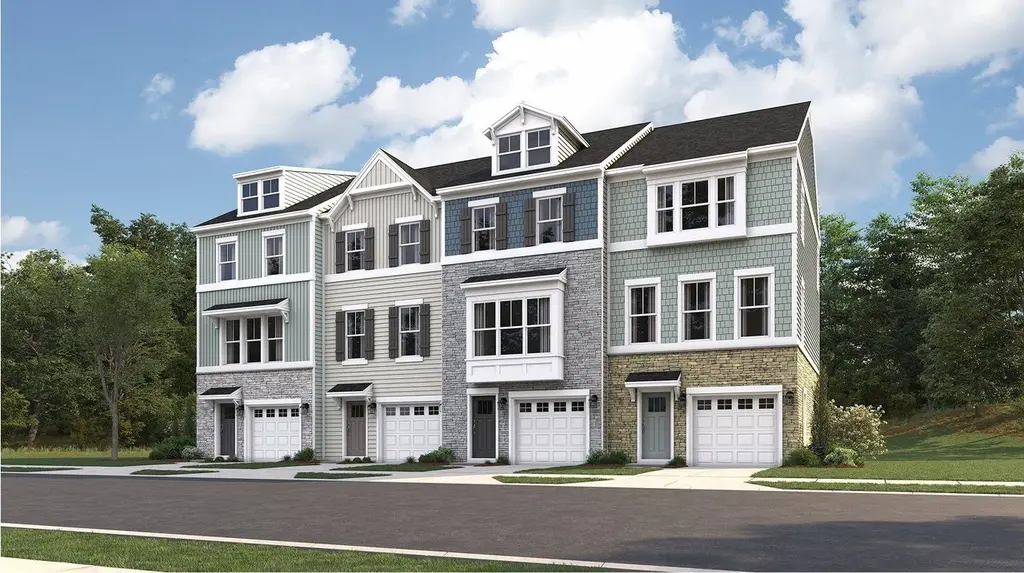
Baylor Front Load Garage Plan · Waldorf, MD
Flood risk No data
- FEMA flood zone
- —
- Chance of flooding over 30 yrs
- —
- Est. flood insurance / yr
- —
Fire risk No data
- Est. fire insurance / yr
- —
Heat risk No data
- Hot days now (above threshold)
- —
- Hot days in 30 yrs
- —
Wind risk No data
- Chance of severe wind over 30 yrs
- —
Air-quality risk No data
- Unhealthy air days now
- —
- Unhealthy air days in 30 yrs
- —
Risk factors via First Street. Map © Google.
Why this score? — see what drove the D- grade
The composite is a weighted blend of 9 inputs, each scored 0–100. Each bar is that input's sub-score; the figure is the points it added to the 100-point composite (weight × sub-score).
- Cash flow +10.7/30.0
- ARV discount +7.5/15.0
- Condition / age +4.0/5.0
- Livability +3.6/5.0
- 1% rule +3.1/10.0
- DSCR +3.1/10.0
- Rent growth +2.5/5.0
- Schools +2.3/10.0
- Appreciation +0.0/10.0
$361,990
🖨 Deal sheet (PDF) 📄 Offer letter ✓ Due diligence
Listing remarks MLS
This three-story home features a first-floor flex space ready to be transformed off the entrance. Upstairs is an open concept living room/dining room with a kitchen and breakfast room, along with an optional deck. The top floor features the owner's suite with vaulted ceilings and an extra bedroom.
Key facts
- Optional deck
- Owner's suite
- Vaulted ceilings
Tags
Neighborhood map
What this means for you Summary
Snapshot
- This is a 2-bed/2.5-bath townhouse listed at $362k. Condition is rated good.
Deal economics
- At list price, monthly cash flow is $-187 ($-2k/yr) — negative.
- The deal already cash-flows at list — no discount required.
- To meet the 1% rule (rent ≥ 1% of price), the offer needs to be $319k (11.9% below list).
- Recommended offer: $319k (11.9% below list) — sets the bar for 1% rule.
Location & tenants
- Location reads 72/100 on livability (#141 in MD) — a middle-class / working-renter tenant base. Strengths: commute A+, employment A+, housing A+; Watch: crime D-, amenities F, cost of living F.
- Charles County Public Schools (suburban): math 13% / reading 29% proficiency, ranked #14 of 24 in MD (top 58%) — low school quality limits family demand, transient renter base, plan for 1-2y turnover.
- Zoned schools: Dr. Gustavus Brown Elementary (math 2% / reading 12%, grade F, #699 of 860 statewide, top 84%, 413 students, 73% FRL); Milton M. Somers Middle School (math 15% / reading 36%, grade F, #97 of 225 statewide, top 46%, 666 students, 39% FRL); St. Charles High School (math 26% / reading 41%, grade F, #148 of 222 statewide, top 67%, 1,569 students, 48% FRL) — zoned schools average 53% FRL vs 28% district-wide (26 pts higher); higher-poverty schools than district average — tighter screening recommended.
- Market conditions: 244 active listings in the ZIP; 14 comparable units currently listed for rent nearby; rentals at typical pace (median 24d on market — plan ~3-4 weeks tenant-placement turnaround); high-income renter base; 1,542 units permitted in Charles County in 2024 (516 in 5+ unit buildings).
Forward outlook
- Local home prices are declining (-3.0%/yr); year-one equity from $3k of loan paydown is wiped out by about $12k of value loss. Plan a longer hold.
- Charles County population projected at +27% by 2050 — long-run rental-demand tailwind backs the buy-and-hold thesis.
Negotiation context
- It's been on market 108 days — a 9% lower offer ($329k) is reasonable based on typical stale-listing flexibility.
Questions for the listing agent
- What do current leases actually rent for vs. the listed asking? Can we see a recent rent roll and the last 12 months of T-12 income?
- It's been on market 108 days. Have you received any prior offers? Is the seller open to a 12% concession, seller financing, or rate buy-down credit?
- Why hasn't it sold? Are there any deal-killer items the seller is aware of (foundation, flood, title, zoning, code violations)?
- Is there a deadline driving the sale (1031 exchange, divorce, estate, relocation)? That informs how much negotiation room exists.
- Schools are D-rated, which usually means shorter tenancies and higher turnover. Who's the typical renter profile here, and what's been the actual vacancy rate?
- Crime grade is D in this area — have there been break-ins, vandalism, or insurance claims at this property in the last 3 years? What carrier currently insures it and at what premium?
- The area grade is low — what's the realistic commute time and amenity access for the typical tenant pool here? Any planned neighborhood developments (good or bad) we should know about?
- What's the average days-on-market for RENTAL listings here right now (not sales)? A rising rental-DOM trend means longer vacancies and softer asking-rent achievability than the comps imply.
- What's the recent tenant-quality profile in this submarket — average credit score on applications, eviction rate, late-payment / NSF rate, and stable-employment percentage? A property-management company in the area should have these aggregated.
- How much new for-sale + rental construction is in the pipeline within 1–3 miles? Heavy new supply typically softens prices + rents 12–24 months out; constrained supply supports both.
Investment metrics
- 1% rule
- 0.81% ✗
- Cap rate
- 5.72%
- Cash-on-cash
- -2.04%
- DSCR
- 0.91
- GRM
- 10.2
CMA / ARV
- ARV (median comp)
- $391,721
- List price
- $361,990
- Delta
- -7.59%
- Verdict
- FAIR
- Comps
- 20 within 1.0 mi
Show comp detail 12 sales within ~0.75 mi
| Address | Dist | Beds/Ba | Sqft | Sold | Price | $/sf | Match |
|---|---|---|---|---|---|---|---|
| 5627 Ludlow Pl | 0.40mi | 2/3.5 | 1,829 (0%) | 1mo | $379,990 | $208 | 77 |
| 5556 Marksburg Pl | 0.40mi | 2/3.5 | 1,829 (0%) | 1mo | $372,990 | $204 | 77 |
| 5640 Ludlow Pl | 0.38mi | 2/3.5 | 1,871 (+2%) | 1mo | $379,990 | $203 | 74 |
| 5515 Aberdeen Pl | 0.50mi | 2/3.0 | 1,837 (+0%) | 1mo | $369,990 | $201 | 73 |
| 5582 Ludlow Pl | 0.46mi | 3/3.0 (+1) | 1,837 (+0%) | 1mo | $379,990 | $207 | 70 |
| 5580 Ludlow Pl | 0.46mi | 2/3.5 | 1,886 (+3%) | 1mo | $377,990 | $200 | 68 |
| 5558 Marksburg Pl | 0.40mi | 3/3.5 (+1) | 1,871 (+2%) | 1mo | $379,990 | $203 | 68 |
| 5639 Ludlow Pl | 0.38mi | 3/3.5 (+1) | 1,886 (+3%) | 1mo | $379,990 | $201 | 68 |
| 5638 Ludlow Pl | 0.38mi | 3/3.5 (+1) | 1,886 (+3%) | 1mo | $376,990 | $200 | 67 |
| 5616 Ludlow Pl | 0.42mi | 3/3.5 (+1) | 1,871 (+2%) | 1mo | $379,990 | $203 | 67 |
| 5527 Aberdeen Pl | 0.46mi | 3/3.0 (+1) | 1,880 (+3%) | 1mo | $399,990 | $213 | 66 |
| 5511 Aberdeen Pl | 0.51mi | 3/0.5 (+1) | 1,896 (+4%) | 1mo | $399,990 | $211 | 57 |
Match score weights: distance 35% · size 25% · config 20% · recency 20%. Top-matched comps best support the ARV.
Projected returns pro-forma
-3.0% appreciation · 3.0% rent growth · sell at horizon
- IRR
- -19.7%
- Equity multiple
- 0.31×
- Total profit
- $-75,313
- Equity at exit
- $58,407
- IRR
- -12.5%
- Equity multiple
- 0.26×
- Total profit
- $-80,690
- Equity at exit
- $33,869
Cash invested: $109,682 (down + closing). Projections, not guarantees.
Landlord ↔ Tenant lean methodology
- Overall (STATE)
- 27 Tenant-Leaning
- State Maryland
- 27 Tenant-Leaning · D+14
- County
- — inherits STATE
- City
- — inherits STATE
ZIP-level market 20695
- Home prices YoY
- -5.3%
- Active inventory
- 244
- Price-to-rent
- 9.5×
Monthly cashflow live
- Estimated rent
- $3,190 high interval (Pro) →
- Mortgage (P&I)
- −$2,054
- Tax est. 1.5%
- −$490 /mo · $5,876/yr
- Insurance
- −$163
- HOA
- −$0
- Vacancy / Maint / Mgmt
- −$670
- Net cashflow
- $-187
Break-even live
Sensitivity live
| Price | -10% $84 | -5% $-51 | +0% $-187 | +5% $-322 | +10% $-457 |
|---|---|---|---|---|---|
| Rent | -10% $-439 | -5% $-313 | +0% $-187 | +5% $-61 | +10% $65 |
| Rate | -1.0pp $11 | -0.5pp $-87 | base $-187 | +0.5pp $-288 | +1.0pp $-391 |
UW: 25.0% down · 7.5% · 30yr · 1.5% tax · 5.0% vac · 8.0% maint · 8.0% mgmt
Financing live
Cash to close
- Down payment
- $97,930
- Closing costs
- $11,752
- Reserves months
- —
- Total cash needed
- —
Loan-product check · same deal, 3 products live
Conventional
25% down · 7.5% · 30yr
- Down + closing
- —
- Monthly P&I
- —
- Monthly cashflow
- —
- DSCR
- —
- Eligible?
- —
Personal DTI + credit; lowest rate.
DSCR
20% down · 8.5% · 30yr
- Down + closing
- —
- Monthly P&I
- —
- Monthly cashflow
- —
- DSCR
- —
- Eligible?
- —
No personal income docs; deal must DSCR.
Hard money
10% down · 12.0% · 12mo
- Down + closing
- —
- Monthly P&I
- —
- Monthly cashflow
- —
- DSCR
- —
- Eligible?
- —
Short-term bridge; refi at stabilization.
Rent comps 14 comps
| Address | Beds | Baths | Sqft | Rent | $/sqft | DOM | Units | Dist |
|---|---|---|---|---|---|---|---|---|
| 11180 Conway Pl White Plains, MD | 3.0 | 2.5 | 1765 | $3,258 | $1.85 | 7d | 7 | 0.14mi |
| 5692 Glencoe Pl White Plains, MD | 3.0 | 2.5 | 1842 | $3,332 | $1.81 | 0d | 2 | 0.15mi |
| 4165 Brodie Pl White Plains, MD | 3.0 | 3.5 | 2544 | $3,000 | $1.18 | 19d | 1 | 0.15mi |
| 10939 Drummond Pl White Plains, MD | 3.0 | 2.5 | 2192 | $3,500 | $1.60 | 26d | 1 | 0.34mi |
| 10933 Drummond Pl Unit 10933 White Plains, MD | 3.0 | 3.0 | 2300 | $3,500 | $1.52 | 7d | 1 | 0.34mi |
| 10893 Drummond Pl White Plains, MD | 3.0 | 2.5 | 2192 | $3,250 | $1.48 | 24d | 1 | 0.35mi |
| 5527 Aberdeen Pl White Plains, MD | 3.0 | 4.0 | 1880 | $3,000 | $1.60 | 14d | 1 | 0.45mi |
| 5527 Aberdeen Pl White Plains, MD | 3.0 | 4.0 | 1880 | $3,000 | $1.60 | 0d | 1 | 0.45mi |
| 3908 Glacier Bay Pl White Plains, MD | 3.0 | 2.5 | 2388 | $3,200 | $1.34 | 26d | 1 | 0.54mi |
| 5754 Frederick Douglas Pl White Plains, MD | 3.0 | 3.5 | 2220 | $3,500 | $1.58 | 45d | 1 | 0.73mi |
| 5525 Peanuts Ln Waldorf, MD | 3.0 | 4.0 | 2160 | $3,400 | $1.57 | 45d | 1 | 1.17mi |
| 11761 Nationals Ln Unit 11761 Waldorf, MD | 3.0 | 2.5 | 2160 | $3,200 | $1.48 | 14d | 1 | 1.28mi |
| 11761 Nationals Ln Unit 11761 Waldorf, MD | 3.0 | 2.5 | 2160 | $3,200 | $1.48 | 26d | 1 | 1.28mi |
| 5423 Saint Rita Dr Waldorf, MD | 3.0 | 2.5 | 2268 | $3,000 | $1.32 | 45d | 1 | 1.37mi |
Listing history 15 events
-
2026-06-21days on market $361,990 Active 108 DOM
-
2026-06-18days on market $361,990 Active 105 DOM
-
2026-06-17days on market $361,990 Active 104 DOM
-
2026-06-16days on market $361,990 Active 103 DOM
-
2026-06-15days on market $361,990 Active 102 DOM
-
2026-06-13days on market $361,990 Active 100 DOM
-
2026-06-10days on market $361,990 Active 96 DOM
-
2026-06-08days on market $361,990 Active 95 DOM
-
2026-06-07days on market $361,990 Active 94 DOM
-
2026-06-04days on market $361,990 Active 91 DOM
-
2026-06-03days on market $361,990 Active 90 DOM
-
2026-06-02days on market $361,990 Active 89 DOM
-
2026-06-01days on market $361,990 Active 88 DOM
-
2026-05-31days on market $361,990 Active 87 DOM
-
2026-03-05$361,990 Active 298-char remark
Show marketing remark (298 chars)
This three-story home features a first-floor flex space ready to be transformed off the entrance. Upstairs is an open concept living room/dining room with a kitchen and breakfast room, along with an optional deck. The top floor features the owner's suite with vaulted ceilings and an extra bedroom.
ⓘ Source: listings_history table (triggers on properties + properties_extension) + one-shot
backfill from property_details.listing_events for pre-trigger history.
Nearby sold comps map
Loading sold comps map…
Walkable amenities ~0.75 mi
Loading nearby amenities…
Taxation est. · year 1
- Rental income
- $38,286
- − Mortgage interest
- −$21,942
- − Property taxes
- −$5,876
- − Insurance
- −$1,959
- − Repairs & maintenance
- −$3,063
- − Management
- −$3,063
- − Depreciation
- −$11,396
- Taxable loss
- −$9,012
- Est. tax savings @ 24.0%
- +$2,163
- After-tax cash flow
- $-76/yr
For passive investors: Depreciation is non-cash, so a rental often shows a tax loss while cash-flowing — sheltering income. Rental losses are passive: they offset passive income freely, and up to $25,000/yr can offset ordinary (W-2) income if you actively participate and your MAGI is under $100k (phasing out to $0 by $150k); unused losses carry forward. On sale, claimed depreciation is recaptured at up to 25%, and gains may owe capital-gains tax (a 1031 exchange can defer both). Figures are a year-1 estimate at your 24.0% rate — not tax advice; consult a CPA.
Condition & rehab AI · 9 photos
This three-story townhouse is in excellent condition with no visible repairs needed. It offers a good balance of modern amenities and curb appeal, making it a solid investment.
Value-add opportunities
- Both Painting the exterior — Enhances curb appeal and value
- Both Landscaping improvements — Enhances curb appeal and value
- Both Add a smart home system — Improves convenience and adds value
Renovation cost estimate screening
Value-add ROI direction
- Both Painting the exterior — Enhances curb appeal and value ↑
- Both Landscaping improvements — Enhances curb appeal and value ↑
- Both Add a smart home system — Improves convenience and adds value ↑
ⓘ Cost ranges are severity-bucket heuristics (US national rule-of-thumb). Get contractor quotes + a written scope before underwriting a rehab budget.
Schools (NCES district)
- District
- Charles County Public Schools
- NCES district ID
- 2400270
- Math proficiency
- 13% ▼ -19.00%
- Reading proficiency
- 29% ▼ -13.00%
- Median HH income
- $90,389
- Composite
- 22.54/100
- National rank
- #8087
- State rank
- #14 of 24 in MD
Livability — Waldorf
- Score
- 72/100
- State rank
- #141
- US rank
- #6083
Category grades
Schools grade is shown separately in the Schools card above.
Census & demographics
- Census place
- Waldorf, MD
- County
- Charles County · 103,527 people
- City population
- 103,527
- Metro
- Washington-Arlington-Alexandria, DC-VA-MD-WV
- Population (ZIP)
- 16,407
- Household income
- $141,959
- Rent vs Own
- Severe rent burden
- 311.0
Population outlook (Charles County) Hauer SSP2
- Today (2025)
- 176,616 people
- By 2030
- 186,471 · +5.6%
- By 2040
- 206,472 · +16.9%
- By 2050
- 224,883 · +27.3%
- By 2075
- 272,101 · +54.1%
- By 2100
- 303,564 · +71.9%
Race, ethnicity, and origin ACS 2023
- Neighborhood character
- Diverse neighborhood (Simpson 0.58)
- Race & ethnicity
- Black 61% White 23% Two or more races 9% Hispanic / Latino 4% Asian 2%
- Common ancestry
- Slovak 1% Italian 1% Lithuanian 1%
- Foreign-born
- 9% · Canada, South Korea
- Languages at home
- 91% English-only · Spanish 4% Tagalog/Filipino 1% French/Haitian/Cajun 1%
Political lean MEDSL · Charles
- 2024 margin
- Solid D (+40.7) · D 69.2% · R 28.5% · Other 2.2%
- 2008→2024 swing
- +15.2pp toward D · 2008: 25.5pp · 2024: 40.7pp
- All cycles
- 2024: D+40.7 2020: D+40.9 2016: D+30.2 2012: D+31.3 2008: D+25.5
Not yet ingested
- Civics
- —
Market trends
- HPI YoY
- ▼ -12.63%
- Current HPI
- 226.972
- Rent YoY
- —
- Metro
- Washington-Arlington-Alexandria, DC-VA-MD-WV
- State GDP YoY
- ▲ 2.97%
- F500 in state
- 12
Industry mix (Fortune 500 HQ in MD)
| Industry | F500 HQs | Revenue |
|---|---|---|
| Aerospace / Defense | 1 | $71B |
|
||
| Utilities | 1 | $25B |
|
||
| Hotels | 1 | $24B |
|
||
| Consumer Goods | 1 | $7B |
|
||
| Real Estate | 1 | $6B |
|
||
| Chemicals | 1 | $2B |
|
||
Price history
1 event — show timeline
- 2026-03-05 Listed $361,990 Zillow
Cash-flow waterfall
monthlySold comps — $/sqft
last 12 mo · ≤1 miLoading sold comps…