1105 S Golden Ave · Springfield, MO
Flood risk 1/10 · Minimal
- FEMA flood zone
- X (unshaded)
- Chance of flooding over 30 yrs
- 0.0%
- Est. flood insurance / yr
- $507 – $1,088
Fire risk 1/10 · Minimal
- Est. fire insurance / yr
- $1,054 – $1,958
Heat risk 5/10 · Moderate
- Hot days now (above 104°F)
- 7 days/yr
- Hot days in 30 yrs
- 18 days/yr
Wind risk 2/10 · Minimal
- Chance of severe wind over 30 yrs
- 0.0%
Air-quality risk 2/10 · Minimal
- Unhealthy air days now
- 1 days/yr
- Unhealthy air days in 30 yrs
- 2 days/yr
Risk factors via First Street. Map © Google.
Why this score? — see what drove the B grade
The composite is a weighted blend of 9 inputs, each scored 0–100. Each bar is that input's sub-score; the figure is the points it added to the 100-point composite (weight × sub-score).
- Cash flow +30.0/30.0
- 1% rule +10.0/10.0
- DSCR +10.0/10.0
- ARV discount +7.5/15.0
- Livability +3.8/5.0
- Rent growth +3.7/5.0
- Schools +3.2/10.0
- Condition / age +2.5/5.0
- Appreciation +0.0/10.0
$80,000
🖨 Deal sheet (PDF) 📄 Offer letter ✓ Due diligence
Listing remarks
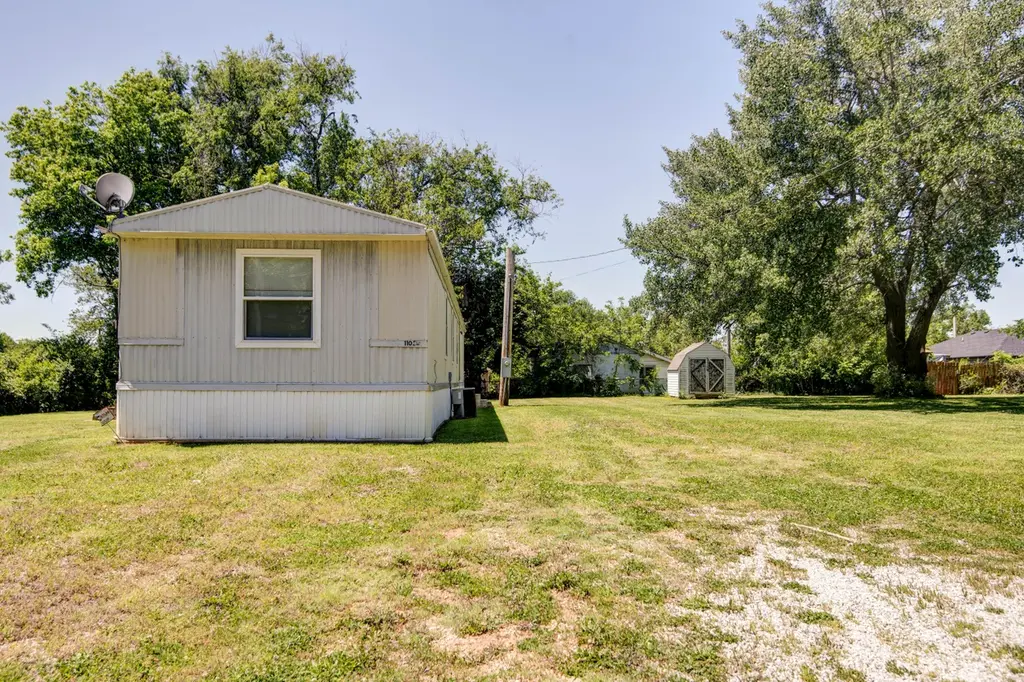
Affordable 3-bedroom, 2-bath manufactured home offering spacious living on a spacious lot in Springfield with additional lot. This home features a functional layout with comfortable living areas and great potential for owner-occupants or investors alike. Conveniently located near shopping, schools, dining Excellent opportunity for affordable homeownership with plenty of outdoor space to enjoy. Home is sold as-is
Key facts
- Spacious lot
- Functional layout
- Outdoor space
Tags
Property features AI
Exterior
- Utilities: Public water; Septic tank sewer
- Home design: Residential single-wide mobile home
- Construction: Built as a single-wide mobile home
- Exterior features: Shed(s) on the property; 0.27-acre lot; Additional parcel included
Interior
- Kitchen: Dishwasher
- Bathrooms: 2 full bathrooms
- Heating & cooling: Central air conditioning; Electric central heating
- Interior features: Insulated windows; Window coverings and blinds; Double-pane windows; Dishwasher
Neighborhood map
What this means for you Summary
Snapshot
- This is a 3-bed/2.0-bath land listed at $80k.
Deal economics
- At list price, monthly cash flow is $544 ($7k/yr) — positive.
- The deal already cash-flows at list — no discount required.
- Meets the 1% rule at list price ($1k rent vs $80k).
- Cap rate 14.5% vs local median 4.6% in Springfield — top-decile yield for the area; either an underpriced asset or a hidden risk that comps aren't pricing in. Stress-test before assuming the spread holds.
Location & tenants
- Location reads 75/100 on livability (#57 in MO, #4,121 nationally) — a middle-class / working-renter tenant base. Strengths: commute A+, cost of living A+, housing A+; Watch: crime F, employment F.
- Springfield R-XII (urban): math 32% / reading 46% proficiency, ranked #174 of 324 in MO (top 54%) — families likely to look elsewhere, expect single-tenant / working-renter base with shorter leases.
- Zoned schools: Westport Middle School (math 12% / reading 29%, grade F, #344 of 391 statewide, top 88%, 433 students, 87% FRL); Parkview High (math 11% / reading 40%, grade F, #433 of 521 statewide, top 83%, 1,234 students, 62% FRL) — zoned schools average 75% FRL vs 46% district-wide (28 pts higher); higher-poverty schools than district average — tighter screening recommended.
- Zoned-school proficiency averages 23% at this address vs 39% district-wide (-16 pts) — the specific schools serving this property underperform the Springfield R-XII average; the district grade overstates school quality for this exact location.
- Market conditions: Rents rising fast (+4.8%/yr); 520 active listings in the ZIP; 19 comparable units currently listed for rent nearby; rentals at typical pace (median 15d on market — plan ~3-4 weeks tenant-placement turnaround); 1,302 units permitted in Greene County in 2024 (250 in 5+ unit buildings).
Forward outlook
- Local home prices are declining (-3.0%/yr); year-one equity from $553 of loan paydown is wiped out by about $2k of value loss. Plan a longer hold.
- Greene County population projected at +25% by 2050 — long-run rental-demand tailwind backs the buy-and-hold thesis.
- At projected returns (-3.0% appreciation + 4.8% rent growth), your $22k cash investment doubles in ~4 years — after that, you're playing with house money.
Negotiation context
- Only 10 days on market — expect competitive offers; lowballing is unlikely to land.
Risks & watch-outs
- Climate carrying-cost: extreme-heat days projected 7→18/yr by 2055 (HVAC capex compounding) — expect insurance premiums to compound above CPI over the hold.
Questions for the listing agent
- Is there a deadline driving the sale (1031 exchange, divorce, estate, relocation)? That informs how much negotiation room exists.
- Crime grade is F in this area — have there been break-ins, vandalism, or insurance claims at this property in the last 3 years? What carrier currently insures it and at what premium?
- What's the average days-on-market for RENTAL listings here right now (not sales)? A rising rental-DOM trend means longer vacancies and softer asking-rent achievability than the comps imply.
- What's the recent tenant-quality profile in this submarket — average credit score on applications, eviction rate, late-payment / NSF rate, and stable-employment percentage? A property-management company in the area should have these aggregated.
- How much new for-sale + rental construction is in the pipeline within 1–3 miles? Heavy new supply typically softens prices + rents 12–24 months out; constrained supply supports both.
Investment metrics
- 1% rule
- 1.61% ✓
- Cap rate
- 14.46%
- Cash-on-cash
- 29.15%
- DSCR
- 2.30
- GRM
- 5.2
CMA / ARV
No comps found within radius.
Projected returns pro-forma
-3.0% appreciation · 4.82% rent growth · sell at horizon
- IRR
- 25.4%
- Equity multiple
- 2.07×
- Total profit
- $24,075
- Equity at exit
- $11,928
- IRR
- 34.2%
- Equity multiple
- 4.38×
- Total profit
- $75,732
- Equity at exit
- $6,917
Cash invested: $22,400 (down + closing). Projections, not guarantees.
Landlord ↔ Tenant lean methodology
- Overall (STATE)
- 81 Strongly Landlord-Friendly
- State Missouri
- 81 Strongly Landlord-Friendly · R+10
- County
- — inherits STATE
- City
- — inherits STATE
ZIP-level market 65802
- Home prices YoY
- -31.9%
- Rents YoY
- 4.8%
- Active inventory
- 520
- Price-to-rent
- 5.2×
Monthly cashflow live
- Estimated rent
- $1,291 high interval (Pro) →
- Mortgage (P&I)
- −$420
- Tax from tax record
- −$23 /mo · $274/yr
- Insurance
- −$33
- HOA
- −$0
- Vacancy / Maint / Mgmt
- −$271
- Net cashflow
- $544
Break-even live
Sensitivity live
| Price | -10% $589 | -5% $567 | +0% $544 | +5% $522 | +10% $499 |
|---|---|---|---|---|---|
| Rent | -10% $442 | -5% $493 | +0% $544 | +5% $595 | +10% $646 |
| Rate | -1.0pp $584 | -0.5pp $565 | base $544 | +0.5pp $523 | +1.0pp $502 |
UW: 25.0% down · 7.5% · 30yr · 1.5% tax · 5.0% vac · 8.0% maint · 8.0% mgmt
Financing live
Cash to close
- Down payment
- $20,000
- Closing costs
- $2,400
- Reserves months
- —
- Total cash needed
- —
Loan-product check · same deal, 3 products live
Conventional
25% down · 7.5% · 30yr
- Down + closing
- —
- Monthly P&I
- —
- Monthly cashflow
- —
- DSCR
- —
- Eligible?
- —
Personal DTI + credit; lowest rate.
DSCR
20% down · 8.5% · 30yr
- Down + closing
- —
- Monthly P&I
- —
- Monthly cashflow
- —
- DSCR
- —
- Eligible?
- —
No personal income docs; deal must DSCR.
Hard money
10% down · 12.0% · 12mo
- Down + closing
- —
- Monthly P&I
- —
- Monthly cashflow
- —
- DSCR
- —
- Eligible?
- —
Short-term bridge; refi at stabilization.
Rent comps 19 comps
| Address | Beds | Baths | Sqft | Rent | $/sqft | DOM | Units | Dist |
|---|---|---|---|---|---|---|---|---|
| 1152 S Hillcrest Ave Springfield, MO | 3.0 | 1.5 | 1240 | $1,300 | $1.05 | 45d | 1 | 0.21mi |
| 1365 S Scenic Ave Springfield, MO | 3.0 | 2.0 | 1328 | $1,550 | $1.17 | 15d | 1 | 0.62mi |
| 547 S Hilton Ave Springfield, MO | 3.0 | 1.0 | 1008 | $1,175 | $1.17 | 45d | 1 | 0.64mi |
| 1040 S Clifton Ave Springfield, MO | 2.0 | 2.0 | 1010 | $945 | $0.94 | 15d | 1 | 0.69mi |
| 1020 S Clifton Ave Springfield, MO | 2.0 | 2.0 | 1010 | $950 | $0.94 | 25d | 1 | 0.70mi |
| 3002 W Elm St Springfield, MO | 3.0 | 2.0 | 1128 | $1,295 | $1.15 | 22d | 1 | 0.77mi |
| 3028 W Walnut St Springfield, MO | 2.0 | 1.0 | 975 | $850 | $0.87 | 22d | 1 | 0.83mi |
| 2854 W Walnut St Springfield, MO | 3.0 | 1.0 | 945 | $995 | $1.05 | 22d | 1 | 0.87mi |
| 250 N Hilton Ave Springfield, MO | 2.0 | 2.0 | 1153 | $628 | $0.54 | 15d | 1 | 0.96mi |
| 2541 W Lincoln St Springfield, MO | 2.0 | 1.0 | 1034 | $975 | $0.94 | 45d | 1 | 1.01mi |
| 2204 W Madison St Springfield, MO | 3.0 | 1.0 | 960 | $1,095 | $1.14 | 15d | 1 | 1.07mi |
| 2412 W Lincoln St Springfield, MO | 3.0 | 1.0 | 1260 | $1,295 | $1.03 | 25d | 1 | 1.09mi |
| 2602 W College St Springfield, MO | 2.0 | 1.0 | 1350 | $995 | $0.74 | 15d | 1 | 1.11mi |
| 412 S Duke Ave Springfield, MO | 3.0 | 1.0 | 1400 | $1,585 | $1.13 | 15d | 1 | 1.12mi |
| 1623 S Burks Ave Springfield, MO | 3.0 | 2.0 | 1656 | $1,895 | $1.14 | 45d | 1 | 1.28mi |
| 1625 S Marion Ave Springfield, MO | 1.0–2.0 | 1.0–2.0 | 900 | $1,321 | $1.47 | 15d | 5 | 1.29mi |
| 3861 W University St Springfield, MO | 2.0 | 1.0–2.0 | 700 | $1,250 | $1.79 | 15d | 9 | 1.31mi |
| 1015 S Meteor Ave Springfield, MO | 3.0 | 2.0 | 1310 | $1,800 | $1.37 | 15d | 1 | 1.32mi |
| 1634 S Marion Ave Springfield, MO | 3.0 | 1.0–2.0 | 845 | $1,662 | $1.97 | 15d | 23 | 1.41mi |
Listing history 1 events
-
2026-05-13$80,000 Active 415-char remark
ⓘ Source: listings_history table (triggers on properties + properties_extension) + one-shot
backfill from property_details.listing_events for pre-trigger history.
Tax reassessment forecast MO · Resets to sale price
- Current annual tax
- $274 · $23/mo
- Projected year-2 tax
- $776 · $65/mo
- Expected delta
- +$502/yr (+$42/mo · 183.1%)
ⓘ Screening estimate from a state-policy table — verify with the county assessor before closing.
Climate risk First Street
- Flood 1/10 Low FEMA zone X (unshaded) · 0% chance over 30 yrs
- Wildfire 1/10 Low
- Heat 5/10 Major 7 d/yr ≥104°F today · 18 d/yr by 30 yrs out
- Wind 2/10 Low 0% chance of damaging wind over 30 yrs
- Air quality 2/10 Low 1 unhealthy d/yr today · 2 by 30 yrs out
Nearby sold comps map
Loading sold comps map…
Walkable amenities ~0.75 mi
Loading nearby amenities…
Taxation est. · year 1
- Rental income
- $15,492
- − Mortgage interest
- −$4,481
- − Property taxes
- −$274
- − Insurance
- −$400
- − Repairs & maintenance
- −$1,239
- − Management
- −$1,239
- − Depreciation
- −$2,327
- Taxable income
- $5,531
- Est. tax owed @ 24.0%
- −$1,327
- After-tax cash flow
- $5,203/yr
For passive investors: Depreciation is non-cash, so a rental often shows a tax loss while cash-flowing — sheltering income. Rental losses are passive: they offset passive income freely, and up to $25,000/yr can offset ordinary (W-2) income if you actively participate and your MAGI is under $100k (phasing out to $0 by $150k); unused losses carry forward. On sale, claimed depreciation is recaptured at up to 25%, and gains may owe capital-gains tax (a 1031 exchange can defer both). Figures are a year-1 estimate at your 24.0% rate — not tax advice; consult a CPA.
Schools (NCES district)
- District
- Springfield R-XII
- NCES district ID
- 2928860
- Math proficiency
- 32% ▼ -2.00%
- Reading proficiency
- 46% ▼ -3.00%
- Median HH income
- $37,886
- Composite
- 32.45/100
- National rank
- #5717
- State rank
- #174 of 324 in MO
Livability — Springfield
- Score
- 75/100
- State rank
- #57
- US rank
- #4121
Category grades
Schools grade is shown separately in the Schools card above.
Census & demographics
- County
- Greene County · 244,327 people
- City population
- 223,044
- Metro
- Springfield, MO
- Population (ZIP)
- 46,739
- Household income
- $55,019
- Rent vs Own
- Severe rent burden
- 1818.0
Population outlook (Greene County) Hauer SSP2
- Today (2025)
- 319,054 people
- By 2030
- 335,135 · +5.0%
- By 2040
- 366,186 · +14.8%
- By 2050
- 397,431 · +24.6%
- By 2075
- 477,035 · +49.5%
- By 2100
- 520,828 · +63.2%
Race, ethnicity, and origin ACS 2023
- Neighborhood character
- Predominantly White (81%)
- Race & ethnicity
- White 81% Two or more races 8% Hispanic / Latino 5% Black 4% Asian 2%
- Common ancestry
- Slovak 2% Lithuanian 2% Italian 2%
- Foreign-born
- 3% · Canada, Vietnam
- Languages at home
- 95% English-only · Spanish 2% Vietnamese 1% Other Indo-European 1%
Political lean MEDSL · Greene
- 2024 margin
- Strong R (+20.8) · D 38.9% · R 59.7% · Other 1.4%
- 2008→2024 swing
- -5.0pp toward R · 2008: -15.8pp · 2024: -20.8pp
- All cycles
- 2024: R+20.8 2020: R+20.1 2016: R+27.4 2012: R+24.4 2008: R+15.8
Not yet ingested
- Civics
- —
Market trends
- HPI YoY
- ▼ -99.72%
- Current HPI
- 212.9826
- Rent YoY
- ▲ 4.82%
- Metro
- Springfield, MO
- State GDP YoY
- ▲ 1.84%
- F500 in state
- 20
Industry mix (Fortune 500 HQ in MO)
| Industry | F500 HQs | Revenue |
|---|---|---|
| Healthcare | 1 | $163B |
|
||
| Insurance | 1 | $21B |
|
||
| Industrial Technology | 1 | $17B |
|
||
| Retail | 1 | $16B |
|
||
| Industrial Distribution | 1 | $10B |
|
||
| Utilities | 1 | $9B |
|
||
Price history
2 events — show timeline
- 2026-05-23 Pending — SOMO
- 2026-05-13 Listed $80,000 SOMO
Property tax history
+4.6%/yrLatest (2025): $274 · +36.3% YoY. Source: county tax records.
Cash-flow waterfall
monthlySold comps — $/sqft
last 12 mo · ≤1 miLoading sold comps…