 Triplex
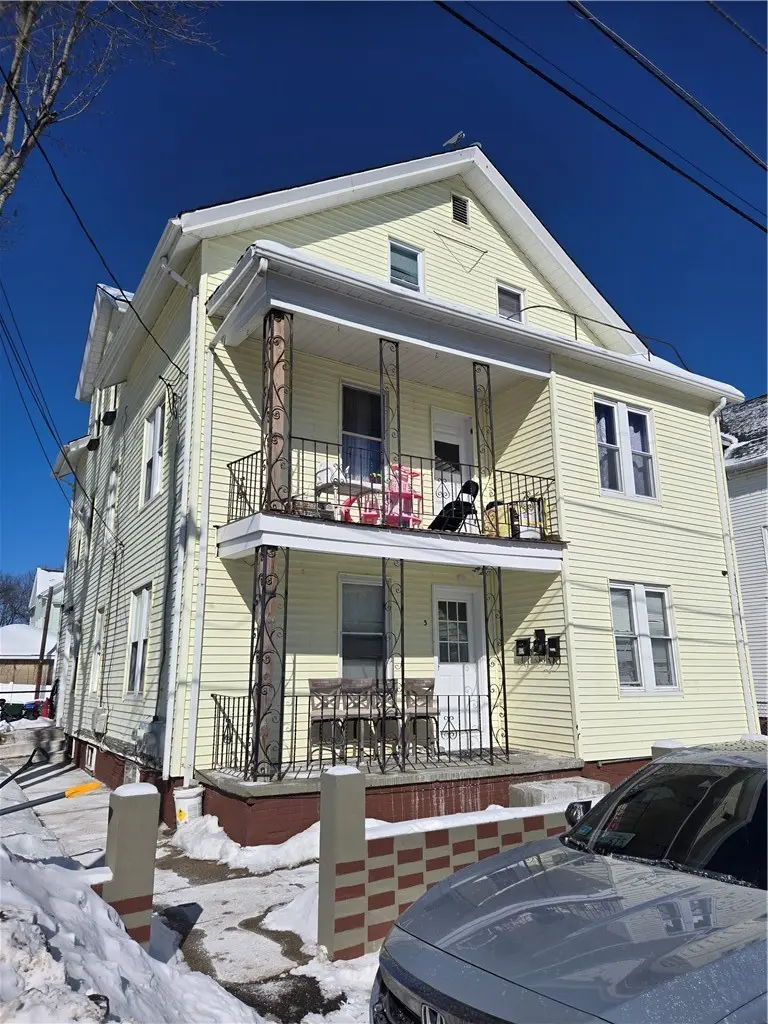
3 Barrett St · Valley Falls, RI
Flood risk 1/10 · Minimal
- FEMA flood zone
- X (unshaded)
- Chance of flooding over 30 yrs
- 0.0%
- Est. flood insurance / yr
- $507 – $1,088
Fire risk 1/10 · Minimal
- Est. fire insurance / yr
- $835 – $1,551
Heat risk 5/10 · Moderate
- Hot days now (above 96°F)
- 7 days/yr
- Hot days in 30 yrs
- 15 days/yr
Wind risk 6/10 · Moderate
- Chance of severe wind over 30 yrs
- 68.0%
Air-quality risk 2/10 · Minimal
- Unhealthy air days now
- 1 days/yr
- Unhealthy air days in 30 yrs
- 2 days/yr
Risk factors via First Street. Map © Google.
Why this score? — see what drove the B- grade
The composite is a weighted blend of 9 inputs, each scored 0–100. Each bar is that input's sub-score; the figure is the points it added to the 100-point composite (weight × sub-score).
- Cash flow +30.0/30.0
- DSCR +10.0/10.0
- 1% rule +7.9/10.0
- ARV discount +7.8/15.0
- Schools +4.2/10.0
- Livability +3.8/5.0
- Condition / age +2.5/5.0
- Rent growth +2.1/5.0
- Appreciation +0.0/10.0
$639,900
🖨 Deal sheet (PDF) 📄 Offer letter ✓ Due diligence
Multi-family units
County records classify this as Multi-Family (2-4 Unit). Listing-text estimate: 3 units. confirmed
Listing remarks MLS
WELL MAINTAINED 3 FAMILY ON A DEAD END STREET. SPACIOUS LAYOUT WITH GOOD SIZE BEDROOMS. MANY UPDATES THROUGHOUT. FRONT PORCHES TO ENJOY THE SUMMER. VINYL SIDING. NICE YARD WITH PARKING. LOCATED CLOSE TO ALL AMENITIES. BEING SOLD AS IS.
Key facts
- Front porches
- Vinyl siding
- Nice yard
Tags
Neighborhood map
What this means for you Summary
Snapshot
- This is a 3 × 3-bed/1.0-bath units multifamily listed at $640k.
Deal economics
- At list price, monthly cash flow is $3k ($30k/yr) — positive. Per door: $846/mo.
- The deal already cash-flows at list — no discount required.
- Meets the 1% rule at list price ($8k rent vs $640k).
- Recommended offer: $563k (12.0% below list) — sets the bar for market timing.
- Cap rate 11.1% vs local median 3.3% in Valley Falls — top-decile yield for the area; either an underpriced asset or a hidden risk that comps aren't pricing in. Stress-test before assuming the spread holds.
Location & tenants
- Location reads 75/100 on livability (#8 in RI, #4,293 nationally) — a middle-class / working-renter tenant base. Strengths: crime A+, employment A+, housing A+; Watch: amenities F, commute F.
- Cumberland (suburban): math 40% / reading 52% proficiency, ranked #9 of 39 in RI (top 23%) — families likely to look elsewhere, expect single-tenant / working-renter base with shorter leases; only 18% free/reduced lunch — higher-income household profile.
- Zoned schools: Garvin Memorial (math 32% / reading 47%, grade F, #46 of 167 statewide, top 30%, 410 students, 20% FRL); Joseph L. Mccourt Ms (math 25% / reading 30%, grade F, #25 of 57 statewide, top 43%, 436 students, 37% FRL); Cumberland High School (math 35% / reading 58%, grade D-, #15 of 58 statewide, top 26%, 1,446 students, 17% FRL).
- Market conditions: Rents soft (-1.5%/yr); 148 active listings in the ZIP; high-income renter base; 776 units permitted in Providence County in 2024 (229 in 5+ unit buildings).
Forward outlook
- Local home prices are declining (-3.0%/yr); year-one equity from $4k of loan paydown is wiped out by about $19k of value loss. Plan a longer hold.
- Providence County population projected at +5% by 2050 — modest demand growth; plan on rents tracking national, not racing it.
- At projected returns (-3.0% appreciation + 0.0% rent growth), your $179k cash investment doubles in ~10 years — after that, you're playing with house money.
Negotiation context
- It's been on market 139 days — a 12% lower offer ($563k) is reasonable based on typical stale-listing flexibility.
- 4 sale attempts since 24y ago with the ask held roughly flat each time — persistent listings suggest the price (not the market) is what's stuck; bring a comps-based counter.
- Current owner paid $540k; 18% above their basis — modest negotiation headroom, anchor on the comps not their cost.
Risks & watch-outs
- Watch-outs: built in 1900 — expect roof / HVAC / electrical / plumbing capex.
- Climate carrying-cost: major wind risk, 68% chance of damaging wind over 30y; extreme-heat days projected 7→15/yr by 2055 (HVAC capex compounding) — expect insurance premiums to compound above CPI over the hold.
Questions for the listing agent
- It's been on market 139 days. Have you received any prior offers? Is the seller open to a 12% concession, seller financing, or rate buy-down credit?
- Can we see the unit-by-unit rent roll, current vacancy, and any below-market leases? What's the average tenancy length?
- What capital expenditures (roof, boiler, parking lot, exteriors) have been made in the last 5 years, and what's planned in the next 2?
- Built in 1900 — when were the roof, HVAC, electrical panel, plumbing, and water heater last replaced?
- Why hasn't it sold? Are there any deal-killer items the seller is aware of (foundation, flood, title, zoning, code violations)?
- Is there a deadline driving the sale (1031 exchange, divorce, estate, relocation)? That informs how much negotiation room exists.
- Schools are D-rated, which usually means shorter tenancies and higher turnover. Who's the typical renter profile here, and what's been the actual vacancy rate?
- What's the average days-on-market for RENTAL listings here right now (not sales)? A rising rental-DOM trend means longer vacancies and softer asking-rent achievability than the comps imply.
- What's the recent tenant-quality profile in this submarket — average credit score on applications, eviction rate, late-payment / NSF rate, and stable-employment percentage? A property-management company in the area should have these aggregated.
- How much new apartment / multifamily construction is in the pipeline within 1–3 miles? Heavy new supply (>2% of stock underway) typically softens rents 12–24 months out; light construction supports rent growth.
Investment metrics
- 1% rule
- 1.29% ✓
- Cap rate
- 11.05%
- Cash-on-cash
- 17.00%
- DSCR
- 1.76
- GRM
- 6.5
CMA / ARV
- ARV (median comp)
- $643,690
- List price
- $639,900
- Delta
- -0.59%
- Verdict
- FAIR
- Comps
- 14 within 1.0 mi
Show comp detail 1 sale within ~0.75 mi
| Address | Dist | Beds/Ba | Sqft | Sold | Price | $/sf | Match |
|---|---|---|---|---|---|---|---|
| 987 Mendon Rd | 0.02mi | 7/3.0 (-1) | 3,047 (-0%) | 6mo | $595,000 | $195 | 88 |
Match score weights: distance 35% · size 25% · config 20% · recency 20%. Top-matched comps best support the ARV.
Projected returns pro-forma
-3.0% appreciation · 0.0% rent growth · sell at horizon
- IRR
- 5.0%
- Equity multiple
- 1.19×
- Total profit
- $33,626
- Equity at exit
- $95,411
- IRR
- 11.7%
- Equity multiple
- 1.80×
- Total profit
- $143,305
- Equity at exit
- $55,327
Cash invested: $179,172 (down + closing). Projections, not guarantees.
Landlord ↔ Tenant lean methodology
- Overall (STATE)
- 31 Tenant-Leaning
- State Rhode Island
- 31 Tenant-Leaning · D+8
- County
- — inherits STATE
- City
- — inherits STATE
ZIP-level market 02864
- Rents YoY
- -1.5%
- Active inventory
- 148
- Price-to-rent
- 19.4×
Monthly cashflow live
- Estimated rent
- $8,263 medium interval (Pro) →
- Mortgage (P&I)
- −$3,356
- Tax from tax record
- −$367 /mo · $4,404/yr
- Insurance
- −$267
- HOA
- −$0
- Vacancy / Maint / Mgmt
- −$1,735
- Net cashflow
- $2,538
Break-even live
Sensitivity live
| Price | -10% $2,901 | -5% $2,720 | +0% $2,538 | +5% $2,357 | +10% $2,176 |
|---|---|---|---|---|---|
| Rent | -10% $1,886 | -5% $2,212 | +0% $2,538 | +5% $2,865 | +10% $3,191 |
| Rate | -1.0pp $2,861 | -0.5pp $2,701 | base $2,538 | +0.5pp $2,373 | +1.0pp $2,204 |
3-unit breakdown (identical units grouped — click to expand)
| Units | Beds | Baths | Est. rent |
|---|---|---|---|
| 3× units | 3 | 1 | $8,262 |
| #1 | 3 | 1 | $2,754 |
| #2 | 3 | 1 | $2,754 |
| #3 | 3 | 1 | $2,754 |
| Total (3 units) | $8,263 | ||
UW: 25.0% down · 7.5% · 30yr · 1.5% tax · 5.0% vac · 8.0% maint · 8.0% mgmt
Financing live
Cash to close
- Down payment
- $159,975
- Closing costs
- $19,197
- Reserves months
- —
- Total cash needed
- —
Loan-product check · same deal, 3 products live
Conventional
25% down · 7.5% · 30yr
- Down + closing
- —
- Monthly P&I
- —
- Monthly cashflow
- —
- DSCR
- —
- Eligible?
- —
Personal DTI + credit; lowest rate.
DSCR
20% down · 8.5% · 30yr
- Down + closing
- —
- Monthly P&I
- —
- Monthly cashflow
- —
- DSCR
- —
- Eligible?
- —
No personal income docs; deal must DSCR.
Hard money
10% down · 12.0% · 12mo
- Down + closing
- —
- Monthly P&I
- —
- Monthly cashflow
- —
- DSCR
- —
- Eligible?
- —
Short-term bridge; refi at stabilization.
Listing history 29 events
-
2026-06-21days on market $639,900 Active 139 DOM
-
2026-06-18days on market $639,900 Active 136 DOM
-
2026-06-17days on market $639,900 Active 135 DOM
-
2026-06-16days on market $639,900 Active 134 DOM
-
2026-06-15days on market $639,900 Active 133 DOM
-
2026-06-13days on market $639,900 Active 131 DOM
-
2026-06-09days on market $639,900 Active 127 DOM
-
2026-06-08days on market $639,900 Active 126 DOM
-
2026-06-07days on market $639,900 Active 125 DOM
-
2026-06-05days on market $639,900 Active 122 DOM
-
2026-06-03days on market $639,900 Active 121 DOM
-
2026-06-02days on market $639,900 Active 120 DOM
-
2026-06-01days on market $639,900 Active 119 DOM
-
2026-05-31days on market $639,900 Active 118 DOM
-
2026-02-02$639,900 Active 235-char remark
Show marketing remark (235 chars)
WELL MAINTAINED 3 FAMILY ON A DEAD END STREET. SPACIOUS LAYOUT WITH GOOD SIZE BEDROOMS. MANY UPDATES THROUGHOUT. FRONT PORCHES TO ENJOY THE SUMMER. VINYL SIDING. NICE YARD WITH PARKING. LOCATED CLOSE TO ALL AMENITIES. BEING SOLD AS IS.
-
2023-08-08soldstatus $540,500 Closed 266-char remark
Show marketing remark (266 chars)
Amazing opportunity for an investor or owner occupied buyer! This is a super spacious and charming three family on a lovely lot in a super convenient location off Mendon Road. The units are bright and sizable! And the property is in compliance with fire safety code.
-
2023-08-08soldstatus $540,500
Show marketing remark (266 chars)
Amazing opportunity for an investor or owner occupied buyer! This is a super spacious and charming three family on a lovely lot in a super convenient location off Mendon Road. The units are bright and sizable! And the property is in compliance with fire safety code.
-
2023-06-03status Pending 266-char remark
Show marketing remark (266 chars)
Amazing opportunity for an investor or owner occupied buyer! This is a super spacious and charming three family on a lovely lot in a super convenient location off Mendon Road. The units are bright and sizable! And the property is in compliance with fire safety code.
-
2023-05-21$479,900 Active 266-char remark
Show marketing remark (266 chars)
Amazing opportunity for an investor or owner occupied buyer! This is a super spacious and charming three family on a lovely lot in a super convenient location off Mendon Road. The units are bright and sizable! And the property is in compliance with fire safety code.
-
2022-09-06status Pending
-
2022-09-06historical
-
2022-08-19price $425,000
-
2022-07-25$449,900 Active
-
2019-09-20price $269,900
-
2019-03-08soldstatus $345,000
-
2003-07-23soldstatus $275,000
-
2003-07-23soldstatus $275,000
-
2003-05-20historical
-
2002-11-07$289,900
ⓘ Source: listings_history table (triggers on properties + properties_extension) + one-shot
backfill from property_details.listing_events for pre-trigger history.
Tax reassessment forecast RI · Partial reset (capped growth)
- Current annual tax
- $4,404 · $367/mo
- Projected year-2 tax
- $7,417 · $618/mo
- Expected delta
- +$3,013/yr (+$251/mo · 68.4%)
ⓘ Screening estimate from a state-policy table — verify with the county assessor before closing.
Climate risk First Street
- Flood 1/10 Low FEMA zone X (unshaded) · 0% chance over 30 yrs
- Wildfire 1/10 Low
- Heat 5/10 Major 7 d/yr ≥96°F today · 15 d/yr by 30 yrs out
- Wind 6/10 Major 68% chance of damaging wind over 30 yrs
- Air quality 2/10 Low 1 unhealthy d/yr today · 2 by 30 yrs out
Nearby sold comps map
Loading sold comps map…
Walkable amenities ~0.75 mi
Loading nearby amenities…
Taxation est. · year 1
- Rental income
- $99,156
- − Mortgage interest
- −$35,844
- − Property taxes
- −$4,404
- − Insurance
- −$3,200
- − Repairs & maintenance
- −$7,932
- − Management
- −$7,932
- − Depreciation
- −$18,615
- Taxable income
- $21,228
- Est. tax owed @ 24.0%
- −$5,095
- After-tax cash flow
- $25,367/yr
For passive investors: Depreciation is non-cash, so a rental often shows a tax loss while cash-flowing — sheltering income. Rental losses are passive: they offset passive income freely, and up to $25,000/yr can offset ordinary (W-2) income if you actively participate and your MAGI is under $100k (phasing out to $0 by $150k); unused losses carry forward. On sale, claimed depreciation is recaptured at up to 25%, and gains may owe capital-gains tax (a 1031 exchange can defer both). Figures are a year-1 estimate at your 24.0% rate — not tax advice; consult a CPA.
Schools (NCES district)
- District
- Cumberland
- NCES district ID
- 4400270
- Math proficiency
- 40% ▼ -13.00%
- Reading proficiency
- 52% ▼ -10.00%
- Median HH income
- $75,407
- Composite
- 41.85/100
- National rank
- #3382
- State rank
- #9 of 39 in RI
Livability — Valley Falls
- Score
- 75/100
- State rank
- #8
- US rank
- #4293
Category grades
Schools grade is shown separately in the Schools card above.
Census & demographics
- County
- Providence County · 548,917 people
- Metro
- Providence-Warwick, RI-MA
- Population (ZIP)
- 36,820
- Household income
- $117,522
- Rent vs Own
- Severe rent burden
- 771.0
Population outlook (Providence County) Hauer SSP2
- Today (2025)
- 653,469 people
- By 2030
- 660,819 · +1.1%
- By 2040
- 672,747 · +3.0%
- By 2050
- 683,741 · +4.6%
- By 2075
- 720,435 · +10.2%
- By 2100
- 741,582 · +13.5%
Race, ethnicity, and origin ACS 2023
- Neighborhood character
- Predominantly White (83%)
- Race & ethnicity
- White 83% Hispanic / Latino 6% Two or more races 5% Asian 4% Black 3%
- Hispanic origin (detail)
- Puerto Rican 2%
- Common ancestry
- Lithuanian 11% Russian 10% Romanian 6%
- Foreign-born
- 11% · Canada, Jamaica, China
- Languages at home
- 83% English-only · Other Indo-European 7% Spanish 4% French/Haitian/Cajun 2%
Political lean MEDSL · Providence
- 2024 margin
- D (+14.4) · D 56.1% · R 41.7% · Other 2.2%
- 2008→2024 swing
- -20.0pp toward R · 2008: 34.4pp · 2024: 14.4pp
- All cycles
- 2024: D+14.4 2020: D+22.9 2016: D+21.2 2012: D+34.9 2008: D+34.4
Not yet ingested
- Civics
- —
Market trends
- HPI YoY
- ▼ -461.15%
- Current HPI
- 313.0341
- Rent YoY
- ▼ -1.48%
- Metro
- Providence-Warwick, RI-MA
- State GDP YoY
- ▲ 2.25%
- F500 in state
- 10
Industry mix (Fortune 500 HQ in RI)
| Industry | F500 HQs | Revenue |
|---|---|---|
| Healthcare | 1 | $373B |
|
||
| Food Distribution | 1 | $31B |
|
||
| Aerospace / Defense | 1 | $14B |
|
||
| Financial Services | 1 | $8B |
|
||
| Consumer Goods | 1 | $4B |
|
||
Price history
+120.7% since first listed15 events — show timeline
- 2026-02-02 Listed $639,900 RIS
- 2023-08-08 Sold (Public Records) $540,500 Public Records
- 2023-08-08 Sold (MLS) $540,500 RIS
- 2023-06-03 Pending — RIS
- 2023-05-21 Listed $479,900 RIS
- 2022-09-06 Pending — RIS
- 2022-09-06 Listing Removed — RIS
- 2022-08-19 Price Changed $425,000 RIS
- 2022-07-25 Listed $449,900 RIS
- 2019-09-20 Price Changed $269,900 RIS
- 2019-03-08 Sold (Public Records) $345,000 Public Records
- 2003-07-23 Sold (Public Records) $275,000 Public Records
- 2003-07-23 Sold (MLS) $275,000 RIS
- 2003-05-20 Listing Removed — RIS
- 2002-11-07 Listed $289,900 RIS
Property tax history
+2.0%/yrLatest (2025): $4,404 · +2.7% YoY. Source: county tax records.
Cash-flow waterfall
monthlySold comps — $/sqft
last 12 mo · ≤1 miLoading sold comps…