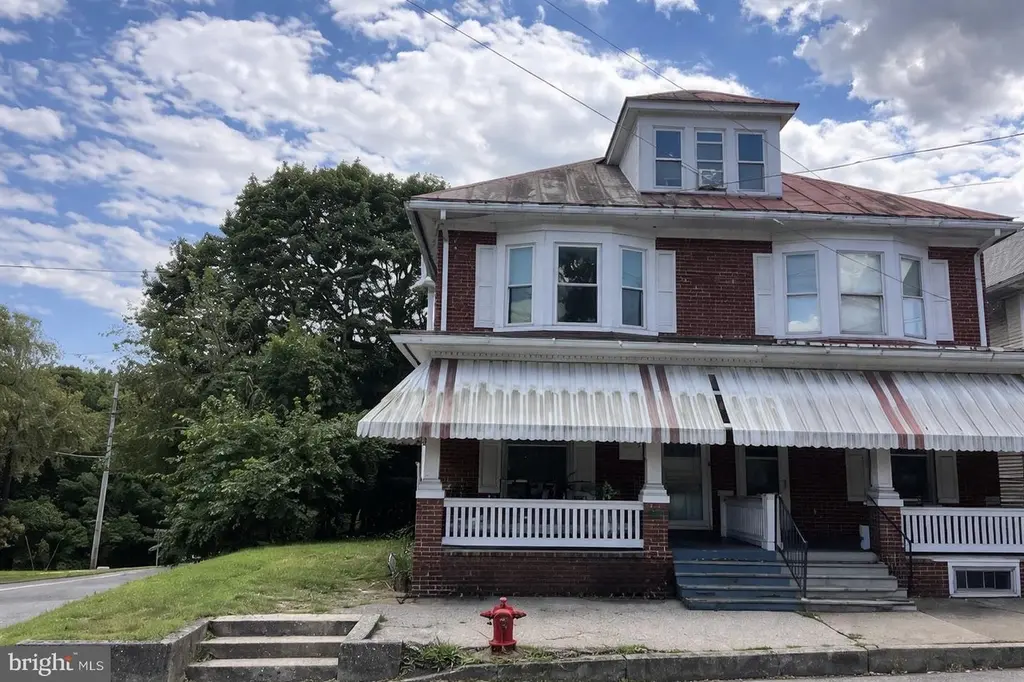
198 Pine St · Millersburg, PA
Flood risk 1/10 · Minimal
- FEMA flood zone
- X (unshaded)
- Chance of flooding over 30 yrs
- 0.0%
- Est. flood insurance / yr
- $473 – $860
Fire risk 2/10 · Minimal
- Est. fire insurance / yr
- $511 – $949
Heat risk 5/10 · Moderate
- Hot days now (above 99°F)
- 7 days/yr
- Hot days in 30 yrs
- 16 days/yr
Wind risk 2/10 · Minimal
- Chance of severe wind over 30 yrs
- 3.0%
Air-quality risk 1/10 · Minimal
- Unhealthy air days now
- 0 days/yr
- Unhealthy air days in 30 yrs
- 0 days/yr
Risk factors via First Street. Map © Google.
Why this score? — see what drove the A- grade
The composite is a weighted blend of 9 inputs, each scored 0–100. Each bar is that input's sub-score; the figure is the points it added to the 100-point composite (weight × sub-score).
- Cash flow +30.0/30.0
- ARV discount +15.0/15.0
- 1% rule +10.0/10.0
- DSCR +10.0/10.0
- Appreciation +5.6/10.0
- Schools +3.7/10.0
- Livability +3.7/5.0
- Rent growth +2.5/5.0
- Condition / age +2.5/5.0
$94,900
🖨 Deal sheet (PDF) 📄 Offer letter ✓ Due diligence
Listing remarks MLS
Wow price reduction, movitated seller. Large 1/2 duplex with over 2000 square feet of living space. Original wood work, floors and doors. Finished basement level with den, bath, and efficiency kitchen. Large bonus room in attic could be office or additional bedroom.
Key facts
- Inviting front porch
- Existing bathroom
- Generous layout
Tags
Neighborhood map
What this means for you Summary
Snapshot
- This is a 3-bed/1.0-bath single-family listed at $95k.
Deal economics
- At list price, monthly cash flow is $469 ($6k/yr) — positive.
- The deal already cash-flows at list — no discount required.
- Meets the 1% rule at list price ($2k rent vs $95k).
- Recommended offer: $92k (3.0% below list) — sets the bar for market timing.
Location & tenants
- Location reads 74/100 on livability (#480 in PA, #4,444 nationally) — a middle-class / working-renter tenant base. Strengths: crime A+, cost of living A+, housing A+; Watch: amenities F, commute F.
- Millersburg Area SD (town): math 36% / reading 51% proficiency, ranked #288 of 539 in PA (top 53%) — families likely to look elsewhere, expect single-tenant / working-renter base with shorter leases.
- Zoned schools: Lenkerville El Sch (math 52% / reading 57%, grade C, #504 of 1,518 statewide, top 37%, 313 students, 49% FRL); Millersburg Area Ms (math 17% / reading 47%, grade F, #362 of 512 statewide, top 71%, 157 students, 39% FRL); Millersburg Area Shs (math 64%, 229 students, 42% FRL).
- Market conditions: 32 active listings in the ZIP; 1 comparable units currently listed for rent nearby; 540 units permitted in Dauphin County in 2024 (194 in 5+ unit buildings).
Forward outlook
- In year one you build about $2k of equity ($656 loan paydown + $1k appreciation (1.2% local appreciation)).
- At projected returns (1.2% appreciation + 3.0% rent growth), your $27k cash investment doubles in ~4 years — after that, you're playing with house money.
Negotiation context
- It's been on market 36 days — a 3% lower offer ($92k) is reasonable based on typical stale-listing flexibility.
- 3 sale attempts since 16y ago; this cycle's ask has dropped $5k (5%) from the opening price — seller is motivated, your offer sets the floor, not the list.
- Current owner paid $52k; list at $95k implies a 84% gain — meaningful room to come down on a strong offer.
Risks & watch-outs
- Watch-outs: property tax is 3.5% of price; built in 1918 — expect roof / HVAC / electrical / plumbing capex.
- Climate carrying-cost: extreme-heat days projected 7→16/yr by 2055 (HVAC capex compounding) — expect insurance premiums to compound above CPI over the hold.
Questions for the listing agent
- It's been on market 36 days. Have you received any prior offers? Is the seller open to a 3% concession, seller financing, or rate buy-down credit?
- Built in 1918 — when were the roof, HVAC, electrical panel, plumbing, and water heater last replaced?
- Property tax is high relative to price — has the assessment been appealed recently, and will the sale trigger a re-assessment?
- Is there a deadline driving the sale (1031 exchange, divorce, estate, relocation)? That informs how much negotiation room exists.
- What's the average days-on-market for RENTAL listings here right now (not sales)? A rising rental-DOM trend means longer vacancies and softer asking-rent achievability than the comps imply.
- What's the recent tenant-quality profile in this submarket — average credit score on applications, eviction rate, late-payment / NSF rate, and stable-employment percentage? A property-management company in the area should have these aggregated.
- How much new for-sale + rental construction is in the pipeline within 1–3 miles? Heavy new supply typically softens prices + rents 12–24 months out; constrained supply supports both.
Investment metrics
- 1% rule
- 1.71% ✓
- Cap rate
- 12.23%
- Cash-on-cash
- 21.20%
- DSCR
- 1.94
- GRM
- 4.9
CMA / ARV
- ARV (on-the-fly)
- $169,728
- Comps found
- 11
Show comp detail 11 sales within ~0.75 mi
| Address | Dist | Beds/Ba | Sqft | Sold | Price | $/sf | Match |
|---|---|---|---|---|---|---|---|
| 285 Union St | 0.15mi | 3/1.5 | 1,644 (+1%) | 11mo | $150,000 | $91 | 81 |
| 306 S Market St | 0.25mi | 3/1.5 | 1,631 (-0%) | 7mo | $165,000 | $101 | 80 |
| 277 Union St | 0.14mi | 3/1.5 | 1,740 (+7%) | 3mo | $175,000 | $101 | 78 |
| 541 Union St | 0.35mi | 4/1.5 (+1) | 1,620 (-1%) | 3mo | $215,000 | $133 | 73 |
| 780 State St | 0.52mi | 3/1.5 | 1,642 (+1%) | 6mo | $159,900 | $97 | 68 |
| 554 Center | 0.38mi | 4/2.0 (+1) | 1,684 (+3%) | 17mo | $204,000 | $121 | 54 |
| 795 State St | 0.54mi | 3/1.5 | 1,462 (-10%) | 6mo | $196,000 | $134 | 50 |
| 868 Union St | 0.67mi | 2/1.0 (-1) | 1,666 (+2%) | 13mo | $172,500 | $104 | 49 |
| 226 Moore St | 0.30mi | 3/1.5 | 1,868 (+14%) | 14mo | $172,000 | $92 | 49 |
| 337 Berry Mountain Rd | 0.75mi | 3/2.0 | 1,863 (+14%) | 4mo | $289,900 | $156 | 35 |
| 320 Berrysburg Rd | 0.63mi | 3/1.0 | 1,394 (-15%) | 19mo | $205,000 | $147 | 30 |
Match score weights: distance 35% · size 25% · config 20% · recency 20%. Top-matched comps best support the ARV.
Projected returns pro-forma
1.2% appreciation · 3.0% rent growth · sell at horizon
- IRR
- 23.8%
- Equity multiple
- 2.23×
- Total profit
- $32,749
- Equity at exit
- $33,410
- IRR
- 26.5%
- Equity multiple
- 4.26×
- Total profit
- $86,518
- Equity at exit
- $45,192
Cash invested: $26,572 (down + closing). Projections, not guarantees.
Landlord ↔ Tenant lean methodology
- Overall (STATE)
- 62 Landlord-Friendly
- State Pennsylvania
- 62 Landlord-Friendly · EVEN
- County
- — inherits STATE
- City
- — inherits STATE
ZIP-level market 17061
- Home prices YoY
- 0.4%
- Active inventory
- 32
- Price-to-rent
- 4.9×
Monthly cashflow live
- Estimated rent
- $1,625 medium interval (Pro) →
- Mortgage (P&I)
- −$498
- Tax from tax record
- −$277 /mo · $3,325/yr
- Insurance
- −$40
- HOA
- −$0
- Vacancy / Maint / Mgmt
- −$341
- Net cashflow
- $469
Break-even live
Sensitivity live
| Price | -10% $523 | -5% $496 | +0% $469 | +5% $443 | +10% $416 |
|---|---|---|---|---|---|
| Rent | -10% $341 | -5% $405 | +0% $469 | +5% $534 | +10% $598 |
| Rate | -1.0pp $517 | -0.5pp $494 | base $469 | +0.5pp $445 | +1.0pp $420 |
UW: 25.0% down · 7.5% · 30yr · 1.5% tax · 5.0% vac · 8.0% maint · 8.0% mgmt
Financing live
Cash to close
- Down payment
- $23,725
- Closing costs
- $2,847
- Reserves months
- —
- Total cash needed
- —
Loan-product check · same deal, 3 products live
Conventional
25% down · 7.5% · 30yr
- Down + closing
- —
- Monthly P&I
- —
- Monthly cashflow
- —
- DSCR
- —
- Eligible?
- —
Personal DTI + credit; lowest rate.
DSCR
20% down · 8.5% · 30yr
- Down + closing
- —
- Monthly P&I
- —
- Monthly cashflow
- —
- DSCR
- —
- Eligible?
- —
No personal income docs; deal must DSCR.
Hard money
10% down · 12.0% · 12mo
- Down + closing
- —
- Monthly P&I
- —
- Monthly cashflow
- —
- DSCR
- —
- Eligible?
- —
Short-term bridge; refi at stabilization.
Rent comps 1 comps
| Address | Beds | Baths | Sqft | Rent | $/sqft | DOM | Units | Dist |
|---|---|---|---|---|---|---|---|---|
| 123 Natures Trl Millersburg, PA | 2.0 | 3.0 | 1440 | $1,625 | $1.13 | 25d | 1 | 1.10mi |
Listing history 12 events
-
2026-04-23status Pending
-
2026-03-31price $94,900
-
2026-03-18$99,900 Active
-
2025-09-09soldstatus $51,500
-
2025-07-21historical
-
2025-07-10$75,000 Active
-
2016-12-02soldstatus $95,000
-
2011-01-19soldstatus $87,000
-
2011-01-14soldstatus $87,000 266-char remark
Show marketing remark (266 chars)
Wow price reduction, movitated seller. Large 1/2 duplex with over 2000 square feet of living space. Original wood work, floors and doors. Finished basement level with den, bath, and efficiency kitchen. Large bonus room in attic could be office or additional bedroom.
-
2010-11-12historical 266-char remark
Show marketing remark (266 chars)
Wow price reduction, movitated seller. Large 1/2 duplex with over 2000 square feet of living space. Original wood work, floors and doors. Finished basement level with den, bath, and efficiency kitchen. Large bonus room in attic could be office or additional bedroom.
-
2010-02-18$89,900 266-char remark
Show marketing remark (266 chars)
Wow price reduction, movitated seller. Large 1/2 duplex with over 2000 square feet of living space. Original wood work, floors and doors. Finished basement level with den, bath, and efficiency kitchen. Large bonus room in attic could be office or additional bedroom.
-
1994-04-20soldstatus $28,000
ⓘ Source: listings_history table (triggers on properties + properties_extension) + one-shot
backfill from property_details.listing_events for pre-trigger history.
Tax reassessment forecast PA · Partial reset (capped growth)
- Current annual tax
- $3,325 · $277/mo
- Projected year-2 tax
- $3,325 · $277/mo
- Expected delta
- $0/yr ($0/mo · 0.0%)
ⓘ Screening estimate from a state-policy table — verify with the county assessor before closing.
Climate risk First Street
- Flood 1/10 Low FEMA zone X (unshaded) · 0% chance over 30 yrs
- Wildfire 2/10 Low
- Heat 5/10 Major 7 d/yr ≥99°F today · 16 d/yr by 30 yrs out
- Wind 2/10 Low 3% chance of damaging wind over 30 yrs
- Air quality 1/10 Low 0 unhealthy d/yr today · 0 by 30 yrs out
Nearby sold comps map
Loading sold comps map…
Walkable amenities ~0.75 mi
Loading nearby amenities…
Taxation est. · year 1
- Rental income
- $19,500
- − Mortgage interest
- −$5,316
- − Property taxes
- −$3,325
- − Insurance
- −$474
- − Repairs & maintenance
- −$1,560
- − Management
- −$1,560
- − Depreciation
- −$2,761
- Taxable income
- $4,504
- Est. tax owed @ 24.0%
- −$1,081
- After-tax cash flow
- $4,553/yr
For passive investors: Depreciation is non-cash, so a rental often shows a tax loss while cash-flowing — sheltering income. Rental losses are passive: they offset passive income freely, and up to $25,000/yr can offset ordinary (W-2) income if you actively participate and your MAGI is under $100k (phasing out to $0 by $150k); unused losses carry forward. On sale, claimed depreciation is recaptured at up to 25%, and gains may owe capital-gains tax (a 1031 exchange can defer both). Figures are a year-1 estimate at your 24.0% rate — not tax advice; consult a CPA.
Schools (NCES district)
- District
- Millersburg Area SD
- NCES district ID
- 4215360
- Math proficiency
- 36% ▼ -16.00%
- Reading proficiency
- 51% ▼ -14.00%
- Median HH income
- $50,625
- Composite
- 37.4/100
- National rank
- #4426
- State rank
- #288 of 539 in PA
Livability — Millersburg
- Score
- 74/100
- State rank
- #480
- US rank
- #4444
Category grades
Schools grade is shown separately in the Schools card above.
Census & demographics
- Census place
- Millersburg, PA
- Population (ZIP)
- 6,825
Population outlook (Dauphin County) Hauer SSP2
- Today (2025)
- 281,628 people
- By 2030
- 283,549 · +0.7%
- By 2040
- 285,385 · +1.3%
- By 2050
- 286,188 · +1.6%
- By 2075
- 291,053 · +3.3%
- By 2100
- 282,374 · +0.3%
Race, ethnicity, and origin ACS 2023
- Neighborhood character
- Predominantly White (89%)
- Race & ethnicity
- White 89% Two or more races 6% Hispanic / Latino 2% Asian 1% Black 1%
- Common ancestry
- Romanian 3% Polish 2% Slovak 1%
- Foreign-born
- 1% · China
- Languages at home
- 94% English-only · German/W. Germanic 4% Other Indo-European 1% Chinese 1%
Political lean MEDSL · Dauphin
- 2024 margin
- Lean D (+5.9) · D 52.4% · R 46.5% · Other 1.1%
- 2008→2024 swing
- -3.1pp toward R · 2008: 9.1pp · 2024: 5.9pp
- All cycles
- 2024: D+5.9 2020: D+8.5 2016: D+2.8 2012: D+6.0 2008: D+9.1
Not yet ingested
- Civics
- —
Market trends
- HPI YoY
- ▲ 1.20%
- Current HPI
- 271.943
- Rent YoY
- —
- Metro
- —
- State GDP YoY
- ▲ 1.68%
- F500 in state
- 34
Industry mix (Fortune 500 HQ in PA)
| Industry | F500 HQs | Revenue |
|---|---|---|
| Healthcare | 2 | $309B |
|
||
| Insurance | 2 | $27B |
|
||
| Telecommunications / Media | 1 | $124B |
|
||
| Industrial Distribution | 1 | $22B |
|
||
| Financial Services | 1 | $20B |
|
||
| Chemicals / Materials | 1 | $18B |
|
||
Price history
+238.9% since first listed12 events — show timeline
- 2026-04-23 Pending — BRIGHT MLS
- 2026-03-31 Price Changed $94,900 BRIGHT MLS
- 2026-03-18 Listed $99,900 BRIGHT MLS
- 2025-09-09 Sold (Public Records) $51,500 Public Records
- 2025-07-21 Listing Removed — BRIGHT MLS
- 2025-07-10 Listed $75,000 BRIGHT MLS
- 2016-12-02 Sold (Public Records) $95,000 Public Records
- 2011-01-19 Sold (Public Records) $87,000 Public Records
- 2011-01-14 Sold (MLS) $87,000 BRIGHT MLS
- 2010-11-12 Listing Removed — BRIGHT MLS
- 2010-02-18 Listed $89,900 BRIGHT MLS
- 1994-04-20 Sold (Public Records) $28,000 Public Records
Property tax history
+4.2%/yrLatest (2026): $3,325 · +11.1% YoY. Source: county tax records.
Cash-flow waterfall
monthlySold comps — $/sqft
last 12 mo · ≤1 miLoading sold comps…