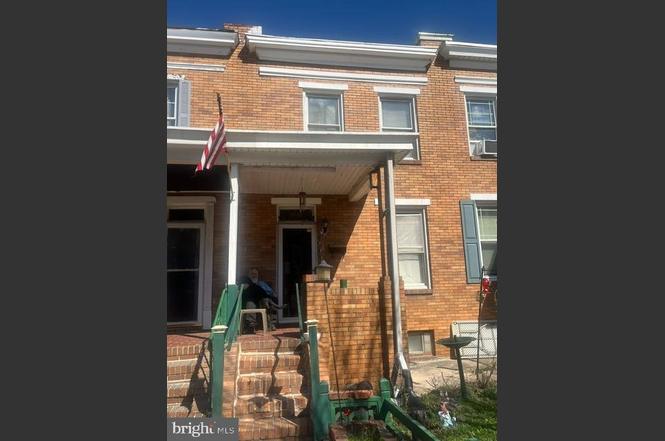
1941 Griffis Ave · Baltimore, MD
Flood risk 1/10 · Minimal
- FEMA flood zone
- X (unshaded)
- Chance of flooding over 30 yrs
- 0.0%
- Est. flood insurance / yr
- $473 – $860
Fire risk 1/10 · Minimal
- Est. fire insurance / yr
- $755 – $1,403
Heat risk 8/10 · Major
- Hot days now (above 103°F)
- 7 days/yr
- Hot days in 30 yrs
- 15 days/yr
Wind risk 6/10 · Moderate
- Chance of severe wind over 30 yrs
- 27.0%
Air-quality risk 4/10 · Minor
- Unhealthy air days now
- 6 days/yr
- Unhealthy air days in 30 yrs
- 7 days/yr
Risk factors via First Street. Map © Google.
Why this score? — see what drove the B- grade
The composite is a weighted blend of 9 inputs, each scored 0–100. Each bar is that input's sub-score; the figure is the points it added to the 100-point composite (weight × sub-score).
- Cash flow +30.0/30.0
- 1% rule +10.0/10.0
- DSCR +10.0/10.0
- ARV discount +7.5/15.0
- Livability +3.8/5.0
- Condition / age +2.5/5.0
- Rent growth +2.2/5.0
- Schools +1.0/10.0
- Appreciation +0.0/10.0
$40,000
🖨 Deal sheet (PDF) 📄 Offer letter ✓ Due diligence
Listing remarks
Calling all investors! Here is the property you have been looking for! 2 bed 1 bath. Nice property with great bones. Roof is 5 years old. Hot water heater is 4 years old. Porch was redone 6 years ago! Inside will need your personal touch. Will make a great flip once your personal touch is added. Or even a rent and hold if that is your interest. Thank You!
Key facts
- Roof is 5 years old
- Built 1925
Tags
Property features AI
Exterior
- Parking: On-street parking
- Utilities: Public water; Public sewer; Cable TV available; Electric service available; Natural gas available
- Home design: Interior townhouse/rowhouse; Fee simple ownership
- Construction: Brick construction; Block foundation; Building not winterized; Above-grade and below-grade structures
- Exterior features: Not in a federal flood zone; Lot approximately 15 x 77 (estimated)
Interior
- Bedrooms: Two bedrooms on the first upper level
- Bathrooms: One full bathroom (all upper levels)
- Heating & cooling: Window air conditioning units (electric); Other heating (fuel: other); Hot water: electric/other
- Interior features: Partially finished basement; Below average property condition; Living area reported by assessor
Neighborhood map
What this means for you Summary
Snapshot
- This is a 2-bed/1.0-bath townhouse listed at $40k.
Deal economics
- At list price, monthly cash flow is $927 ($11k/yr) — positive.
- The deal already cash-flows at list — no discount required.
- Meets the 1% rule at list price ($2k rent vs $40k).
- Cap rate 34.1% vs local median 6.0% in Baltimore — top-decile yield for the area; either an underpriced asset or a hidden risk that comps aren't pricing in. Stress-test before assuming the spread holds.
Location & tenants
- Location reads 76/100 on livability (#90 in MD, #3,396 nationally) — a middle-class / working-renter tenant base. Strengths: amenities A+, commute A+, housing A+; Watch: crime F.
- Baltimore City Public Schools (urban): math 7% / reading 16% proficiency, ranked #24 of 24 in MD (top 100%) — low school quality limits family demand, transient renter base, plan for 1-2y turnover; 79% free/reduced lunch — lower-income household profile, screen leases tightly.
- Zoned schools: Elmer A. Henderson: A Johns Hopkins Partnership (math 2% / reading 16%, grade F, #650 of 860 statewide, top 77%, 642 students, 80% FRL); Baltimore Polytechnic Institute (math 71% / reading 84%, grade A-, #22 of 222 statewide, top 10%, 1,555 students, 43% FRL) — zoned schools average 62% FRL vs 79% district-wide (17 pts lower); this property's tenant base skews higher-income than the district average.
- Zoned-school proficiency averages 43% at this address vs 12% district-wide (+32 pts) — the actual schools serving this property are materially stronger than the Baltimore City Public Schools average implies; a family-tenant draw the district grade alone would hide.
- Market conditions: Rents soft (-1.0%/yr); 363 active listings in the ZIP; 27 comparable units currently listed for rent nearby; rentals at typical pace (median 26d on market — plan ~3-4 weeks tenant-placement turnaround); solid renter incomes; 1,273 units permitted in Baltimore city in 2024 (1,104 in 5+ unit buildings).
Forward outlook
- Local home prices are declining (-3.0%/yr); year-one equity from $277 of loan paydown is wiped out by about $1k of value loss. Plan a longer hold.
- Baltimore County population projected to shrink 4% by 2050 — rents likely to lag national; underwrite the cash flow, not the appreciation.
- At projected returns (-3.0% appreciation + 0.0% rent growth), your $11k cash investment doubles in ~2 years — after that, you're playing with house money.
Negotiation context
- Only 1 days on market — expect competitive offers; lowballing is unlikely to land.
- Current owner paid $27k; 48% above their basis — modest negotiation headroom, anchor on the comps not their cost.
Risks & watch-outs
- Watch-outs: property tax is 3.1% of price; built in 1925 — expect roof / HVAC / electrical / plumbing capex.
- Climate carrying-cost: major wind risk, 27% chance of damaging wind over 30y; extreme-heat days projected 7→15/yr by 2055 (HVAC capex compounding) — expect insurance premiums to compound above CPI over the hold.
Questions for the listing agent
- Built in 1925 — when were the roof, HVAC, electrical panel, plumbing, and water heater last replaced?
- Property tax is high relative to price — has the assessment been appealed recently, and will the sale trigger a re-assessment?
- Is there a deadline driving the sale (1031 exchange, divorce, estate, relocation)? That informs how much negotiation room exists.
- Schools are D-rated, which usually means shorter tenancies and higher turnover. Who's the typical renter profile here, and what's been the actual vacancy rate?
- Crime grade is F in this area — have there been break-ins, vandalism, or insurance claims at this property in the last 3 years? What carrier currently insures it and at what premium?
- What's the average days-on-market for RENTAL listings here right now (not sales)? A rising rental-DOM trend means longer vacancies and softer asking-rent achievability than the comps imply.
- What's the recent tenant-quality profile in this submarket — average credit score on applications, eviction rate, late-payment / NSF rate, and stable-employment percentage? A property-management company in the area should have these aggregated.
- How much new for-sale + rental construction is in the pipeline within 1–3 miles? Heavy new supply typically softens prices + rents 12–24 months out; constrained supply supports both.
Investment metrics
- 1% rule
- 3.98% ✓
- Cap rate
- 34.11%
- Cash-on-cash
- 99.35%
- DSCR
- 5.42
- GRM
- 2.1
CMA / ARV
- ARV (on-the-fly)
- $106,260
- Comps found
- 12
Show comp detail 12 sales within ~0.75 mi
| Address | Dist | Beds/Ba | Sqft | Sold | Price | $/sf | Match |
|---|---|---|---|---|---|---|---|
| 1931 Griffis Ave | 0.01mi | 2/1.0 | 912 (-6%) | 0mo | $120,000 | $132 | 90 |
| 2014 Grinnalds Ave | 0.09mi | 2/2.0 | 1,015 (+5%) | 7mo | $80,000 | $79 | 78 |
| 1926 Griffis Ave | 0.02mi | 3/1.0 (+1) | 1,016 (+5%) | 14mo | $95,000 | $94 | 74 |
| 2149 Harman Ave | 0.22mi | 2/1.0 | 1,050 (+9%) | 2mo | $115,000 | $110 | 74 |
| 2527 Tolley St | 0.23mi | 2/1.0 | 1,050 (+9%) | 6mo | $120,000 | $114 | 70 |
| 1935 Grinnalds Ave | 0.05mi | 3/2.0 (+1) | 1,080 (+12%) | 1mo | $119,000 | $110 | 68 |
| 1919 Grinnalds Ave | 0.05mi | 3/1.0 (+1) | 1,080 (+12%) | 7mo | $130,000 | $120 | 67 |
| 2104 Whistler Ave | 0.21mi | 2/1.0 | 840 (-13%) | 3mo | $82,500 | $98 | 66 |
| 1710 Wickes Ave | 0.42mi | 3/2.0 (+1) | 1,024 (+6%) | 3mo | $150,000 | $146 | 59 |
| 1919 Deering Ave | 0.35mi | 2/1.5 | 864 (-11%) | 11mo | $125,000 | $145 | 55 |
| 2809 Washington Blvd | 0.43mi | 3/1.0 (+1) | 1,110 (+15%) | 3mo | $80,000 | $72 | 47 |
| 2630 Alaska St | 0.70mi | 3/1.5 (+1) | 1,008 (+4%) | 7mo | $85,000 | $84 | 47 |
Match score weights: distance 35% · size 25% · config 20% · recency 20%. Top-matched comps best support the ARV.
Projected returns pro-forma
-3.0% appreciation · 0.0% rent growth · sell at horizon
- IRR
- 96.9%
- Equity multiple
- 5.28×
- Total profit
- $47,966
- Equity at exit
- $5,964
- IRR
- 98.9%
- Equity multiple
- 9.93×
- Total profit
- $100,007
- Equity at exit
- $3,458
Cash invested: $11,200 (down + closing). Projections, not guarantees.
Landlord ↔ Tenant lean methodology
- Overall (CITY)
- 12 Strongly Tenant-Friendly
- State Maryland
- 27 Tenant-Leaning · D+14
- County
- — inherits STATE
- City Baltimore
- 12 Strongly Tenant-Friendly · D+58
ZIP-level market 21230
- Rents YoY
- -1.0%
- Active inventory
- 363
- Price-to-rent
- 2.1×
Monthly cashflow live
- Estimated rent
- $1,593 high interval (Pro) →
- Mortgage (P&I)
- −$210
- Tax from tax record
- −$105 /mo · $1,258/yr
- Insurance
- −$17
- HOA
- −$0
- Vacancy / Maint / Mgmt
- −$335
- Net cashflow
- $927
Break-even live
Sensitivity live
| Price | -10% $950 | -5% $939 | +0% $927 | +5% $916 | +10% $905 |
|---|---|---|---|---|---|
| Rent | -10% $801 | -5% $864 | +0% $927 | +5% $990 | +10% $1,053 |
| Rate | -1.0pp $947 | -0.5pp $937 | base $927 | +0.5pp $917 | +1.0pp $906 |
UW: 25.0% down · 7.5% · 30yr · 1.5% tax · 5.0% vac · 8.0% maint · 8.0% mgmt
Financing live
Cash to close
- Down payment
- $10,000
- Closing costs
- $1,200
- Reserves months
- —
- Total cash needed
- —
Loan-product check · same deal, 3 products live
Conventional
25% down · 7.5% · 30yr
- Down + closing
- —
- Monthly P&I
- —
- Monthly cashflow
- —
- DSCR
- —
- Eligible?
- —
Personal DTI + credit; lowest rate.
DSCR
20% down · 8.5% · 30yr
- Down + closing
- —
- Monthly P&I
- —
- Monthly cashflow
- —
- DSCR
- —
- Eligible?
- —
No personal income docs; deal must DSCR.
Hard money
10% down · 12.0% · 12mo
- Down + closing
- —
- Monthly P&I
- —
- Monthly cashflow
- —
- DSCR
- —
- Eligible?
- —
Short-term bridge; refi at stabilization.
Rent comps 27 comps
| Address | Beds | Baths | Sqft | Rent | $/sqft | DOM | Units | Dist |
|---|---|---|---|---|---|---|---|---|
| 1931 Griffis Ave Baltimore, MD | 2.0 | 1.0 | 912 | $1,349 | $1.48 | 5d | 1 | 0.04mi |
| 2429 Washington Blvd Baltimore, MD | 1.0 | 1.0 | 940 | $600 | $0.64 | 25d | 1 | 0.07mi |
| 1706 Harman Ave Baltimore, MD | 3.0 | 1.0 | 1056 | $1,600 | $1.52 | 0d | 1 | 0.21mi |
| 3004 Elizabeth Ave Unit 1 Baltimore, MD | 3.0 | 1.0 | 1024 | $1,395 | $1.36 | 6d | 1 | 0.80mi |
| 3017 Janice Ave Baltimore, MD | 3.0 | 1.0 | 1024 | $1,995 | $1.95 | 25d | 1 | 0.81mi |
| 2600 W Patapsco Ave Baltimore, MD | 1.0–2.0 | 1.0 | 856 | $1,312 | $1.53 | 0d | 25 | 0.95mi |
| 2657 Lehman St Unit 1 Baltimore, MD | 2.0 | 1.0 | 1056 | $1,000 | $0.95 | 45d | 1 | 1.01mi |
| 1432 Carroll St Baltimore, MD | 2.0 | 1.5 | 912 | $1,900 | $2.08 | 45d | 1 | 1.06mi |
| 2200 W Patapsco Ave Baltimore, MD | 3.0 | 1.0 | 890 | $1,569 | $1.76 | 45d | 1 | 1.07mi |
| 2540 Frederick Ave Baltimore, MD | 3.0 | 1.0 | 1075 | $1,400 | $1.30 | 25d | 1 | 1.16mi |
| 1708 Hall Ave Unit 2 Halethorpe, MD | 2.0 | 1.0 | 845 | $1,625 | $1.92 | 13d | 1 | 1.16mi |
| 332 S Franklintown Rd Unit 2 Baltimore, MD | 2.0 | 1.0 | 776 | $795 | $1.02 | 25d | 1 | 1.18mi |
| 1215 James St Baltimore, MD | 2.0 | 1.0 | 960 | $1,500 | $1.56 | 45d | 1 | 1.31mi |
| 305 S Calhoun St Baltimore, MD | 2.0 | 1.0 | 1000 | $1,300 | $1.30 | 23d | 1 | 1.33mi |
| 1163 Washington Blvd Baltimore, MD | 2.0 | 2.5 | 1012 | $1,700 | $1.68 | 14d | 1 | 1.35mi |
| 1160 Washington Blvd Baltimore, MD | 2.0 | 1.0 | 960 | $1,575 | $1.64 | 25d | 1 | 1.37mi |
| 1712 W Lombard St #4 Baltimore, MD | 1.0 | 1.0 | 550 | $900 | $1.64 | 45d | 1 | 1.38mi |
| 1142 Sargeant St Baltimore, MD | 3.0 | 2.0 | 1080 | $1,601 | $1.48 | 0d | 1 | 1.39mi |
| 1142 Sargeant St Baltimore, MD | 3.0 | 2.0 | 1080 | $1,601 | $1.48 | 3d | 1 | 1.39mi |
| 3392 Saint Benedict St Baltimore, MD | 2.0 | 1.0 | 864 | $1,450 | $1.68 | 25d | 1 | 1.39mi |
| 1127 Sargeant St Baltimore, MD | 2.0 | 1.5 | 1080 | $1,275 | $1.18 | 25d | 1 | 1.39mi |
| 1125 Wicomico St Baltimore, MD | 3.0 | 3.0 | 1068 | $1,955 | $1.83 | 25d | 1 | 1.41mi |
| 2516 Hollins St Baltimore, MD | 3.0 | 2.0 | 1100 | $1,700 | $1.55 | 45d | 1 | 1.42mi |
| 1918 W Baltimore St Baltimore, MD | 2.0–3.0 | 1.0–2.0 | 857 | $1,375 | $1.60 | 45d | 1 | 1.48mi |
| 853 Reinhart St Baltimore, MD | 2.0 | 2.5 | 780 | $1,800 | $2.31 | 45d | 1 | 1.48mi |
| 1324 W Lombard St Unit 1 Baltimore, MD | 2.0 | 2.0 | 1100 | $1,500 | $1.36 | 25d | 1 | 1.49mi |
| 1324 W Lombard St Unit 2 Baltimore, MD | 2.0 | 1.5 | 1100 | $1,450 | $1.32 | 45d | 1 | 1.49mi |
Listing history 4 events
-
2026-06-21status $40,000 Pending 1 DOM
-
2026-06-19remarks 357-char remark
-
2026-06-18remarks 346-char remark
-
2026-06-18$40,000 Active 1 DOM
ⓘ Source: listings_history table (triggers on properties + properties_extension) + one-shot
backfill from property_details.listing_events for pre-trigger history.
Tax reassessment forecast MD · Partial reset (capped growth)
- Current annual tax
- $1,258 · $105/mo
- Projected year-2 tax
- $1,258 · $105/mo
- Expected delta
- $0/yr ($0/mo · 0.0%)
ⓘ Screening estimate from a state-policy table — verify with the county assessor before closing.
Climate risk First Street
- Flood 1/10 Low FEMA zone X (unshaded) · 0% chance over 30 yrs
- Wildfire 1/10 Low
- Heat 8/10 Severe 7 d/yr ≥103°F today · 15 d/yr by 30 yrs out
- Wind 6/10 Major 27% chance of damaging wind over 30 yrs
- Air quality 4/10 Moderate 6 unhealthy d/yr today · 7 by 30 yrs out
Nearby sold comps map
Loading sold comps map…
Walkable amenities ~0.75 mi
Loading nearby amenities…
Taxation est. · year 1
- Rental income
- $19,117
- − Mortgage interest
- −$2,241
- − Property taxes
- −$1,258
- − Insurance
- −$200
- − Repairs & maintenance
- −$1,529
- − Management
- −$1,529
- − Depreciation
- −$1,164
- Taxable income
- $11,196
- Est. tax owed @ 24.0%
- −$2,687
- After-tax cash flow
- $8,440/yr
For passive investors: Depreciation is non-cash, so a rental often shows a tax loss while cash-flowing — sheltering income. Rental losses are passive: they offset passive income freely, and up to $25,000/yr can offset ordinary (W-2) income if you actively participate and your MAGI is under $100k (phasing out to $0 by $150k); unused losses carry forward. On sale, claimed depreciation is recaptured at up to 25%, and gains may owe capital-gains tax (a 1031 exchange can defer both). Figures are a year-1 estimate at your 24.0% rate — not tax advice; consult a CPA.
Schools (NCES district)
- District
- Baltimore City Public Schools
- NCES district ID
- 2400090
- Math proficiency
- 7% ▼ -9.00%
- Reading proficiency
- 16% ▼ -5.00%
- Median HH income
- $42,108
- Composite
- 10.08/100
- National rank
- #9805
- State rank
- #24 of 24 in MD
Livability — Baltimore
- Score
- 76/100
- State rank
- #90
- US rank
- #3396
Category grades
Schools grade is shown separately in the Schools card above.
Census & demographics
- Census place
- Baltimore, MD
- County
- Baltimore City · 558,601 people
- City population
- 588,727
- Metro
- Baltimore-Columbia-Towson, MD
- Population (ZIP)
- 32,977
- Household income
- $91,842
- Rent vs Own
- Severe rent burden
- 1463.0
Population outlook (Baltimore County) Hauer SSP2
- Today (2025)
- 624,249 people
- By 2030
- 621,541 · -0.4%
- By 2040
- 609,756 · -2.3%
- By 2050
- 597,249 · -4.3%
- By 2075
- 552,236 · -11.5%
- By 2100
- 513,934 · -17.7%
Race, ethnicity, and origin ACS 2023
- Neighborhood character
- Diverse neighborhood (Simpson 0.63)
- Race & ethnicity
- White 55% Black 23% Hispanic / Latino 13% Two or more races 6% Asian 4%
- Hispanic origin (detail)
- Mexican 1% Puerto Rican 1%
- Common ancestry
- Romanian 5% Lithuanian 2% Italian 2%
- Foreign-born
- 10% · Canada, China
- Languages at home
- 85% English-only · Spanish 9% Other Indo-European 1% Other Asian/Pacific 1%
Political lean MEDSL · Baltimore
- 2024 margin
- Solid D (+73.0) · D 85.2% · R 12.2% · Other 2.6%
- 2008→2024 swing
- -2.5pp toward R · 2008: 75.5pp · 2024: 73.0pp
- All cycles
- 2024: D+73.0 2020: D+76.6 2016: D+74.6 2012: D+76.4 2008: D+75.5
Not yet ingested
- Civics
- —
Market trends
- HPI YoY
- ▼ -311.43%
- Current HPI
- 284.338
- Rent YoY
- ▼ -1.00%
- Metro
- Baltimore-Columbia-Towson, MD
- State GDP YoY
- ▲ 2.97%
- F500 in state
- 12
Industry mix (Fortune 500 HQ in MD)
| Industry | F500 HQs | Revenue |
|---|---|---|
| Aerospace / Defense | 1 | $71B |
|
||
| Utilities | 1 | $25B |
|
||
| Hotels | 1 | $24B |
|
||
| Consumer Goods | 1 | $7B |
|
||
| Real Estate | 1 | $6B |
|
||
| Chemicals | 1 | $2B |
|
||
Price history
+48.1% since first listed2 events — show timeline
- 2026-06-18 Listed $40,000 BRIGHT MLS
- 1981-01-20 Sold (Public Records) $27,000 Public Records
Property tax history
-3.0%/yrLatest (2025): $1,258 · +5.3% YoY. Source: county tax records.
Cash-flow waterfall
monthlySold comps — $/sqft
last 12 mo · ≤1 miLoading sold comps…