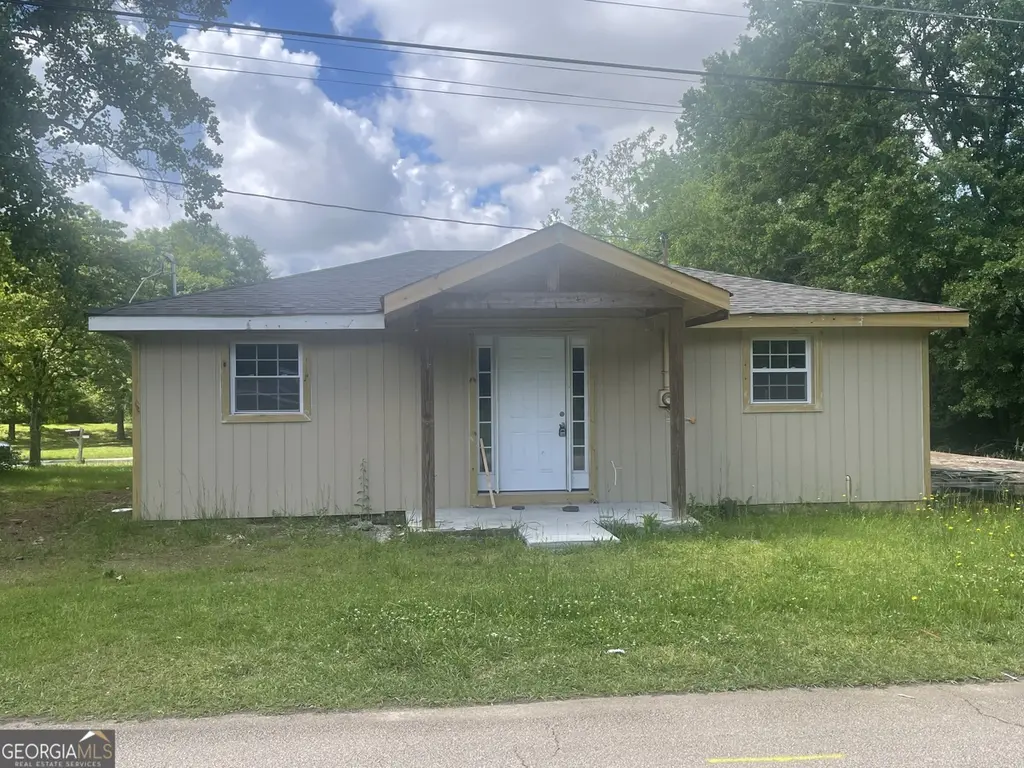
34 Cherry St · McDonough, GA
Flood risk 1/10 · Minimal
- FEMA flood zone
- X (unshaded)
- Chance of flooding over 30 yrs
- 0.0%
- Est. flood insurance / yr
- $507 – $1,088
Fire risk 3/10 · Minor
- Est. fire insurance / yr
- $963 – $1,789
Heat risk 6/10 · Moderate
- Hot days now (above 106°F)
- 7 days/yr
- Hot days in 30 yrs
- 18 days/yr
Wind risk 6/10 · Moderate
- Chance of severe wind over 30 yrs
- 27.0%
Air-quality risk 4/10 · Minor
- Unhealthy air days now
- 4 days/yr
- Unhealthy air days in 30 yrs
- 8 days/yr
Risk factors via First Street. Map © Google.
Why this score? — see what drove the B grade
The composite is a weighted blend of 9 inputs, each scored 0–100. Each bar is that input's sub-score; the figure is the points it added to the 100-point composite (weight × sub-score).
- Cash flow +30.0/30.0
- ARV discount +11.1/15.0
- DSCR +10.0/10.0
- 1% rule +9.4/10.0
- Livability +3.2/5.0
- Schools +2.6/10.0
- Condition / age +2.5/5.0
- Rent growth +2.4/5.0
- Appreciation +0.0/10.0
$115,000
🖨 Deal sheet (PDF) 📄 Offer letter ✓ Due diligence
Listing remarks MLS
Distress property which has been partially remodeled with new roof, siding, windows, and some electrical & plumbing completed. Bring your best offer!!
Key facts
- Some electrical
- New siding
- Some plumbing
Tags
Neighborhood map
What this means for you Summary
Snapshot
- This is a 2-bed/1.0-bath single-family listed at $115k.
Deal economics
- At list price, monthly cash flow is $536 ($6k/yr) — positive.
- The deal already cash-flows at list — no discount required.
- Meets the 1% rule at list price ($2k rent vs $115k).
- Recommended offer: $105k (9.0% below list) — sets the bar for market timing.
- Cap rate 11.9% vs local median 3.9% in McDonough — top-decile yield for the area; either an underpriced asset or a hidden risk that comps aren't pricing in. Stress-test before assuming the spread holds.
Location & tenants
- Location reads 63/100 on livability (#279 in GA) — a middle-class / working-renter tenant base. Strengths: cost of living A+, housing A+, employment B; Watch: schools D, crime D, amenities F.
- Henry County (rural): math 24% / reading 33% proficiency, ranked #89 of 174 in GA (top 51%) — low school quality limits family demand, transient renter base, plan for 1-2y turnover.
- Market conditions: Rents soft (-0.3%/yr); 663 active listings in the ZIP; 23 comparable units currently listed for rent nearby; rentals leasing fast (median 4d on market — plan ~1-2 weeks tenant-placement turnaround); solid renter incomes; 1,989 units permitted in Henry County in 2024 (92 in 5+ unit buildings).
Forward outlook
- Local home prices are declining (-3.0%/yr); year-one equity from $795 of loan paydown is wiped out by about $3k of value loss. Plan a longer hold.
- Henry County population projected at +29% by 2050 — long-run rental-demand tailwind backs the buy-and-hold thesis.
- At projected returns (-3.0% appreciation + 0.0% rent growth), your $32k cash investment doubles in ~8 years — after that, you're playing with house money.
Negotiation context
- It's been on market 100 days — a 9% lower offer ($105k) is reasonable based on typical stale-listing flexibility.
- 8 sale attempts since 7y ago; this cycle's ask has dropped $10k (8%) from the opening price — seller is motivated, your offer sets the floor, not the list.
- Current owner paid $85k; 35% above their basis — modest negotiation headroom, anchor on the comps not their cost.
Risks & watch-outs
- Watch-outs: built in 1940 — expect roof / HVAC / electrical / plumbing capex.
- Climate carrying-cost: major wind risk, 27% chance of damaging wind over 30y; extreme-heat days projected 7→18/yr by 2055 (HVAC capex compounding) — expect insurance premiums to compound above CPI over the hold.
Questions for the listing agent
- It's been on market 100 days. Have you received any prior offers? Is the seller open to a 9% concession, seller financing, or rate buy-down credit?
- Built in 1940 — when were the roof, HVAC, electrical panel, plumbing, and water heater last replaced?
- Why hasn't it sold? Are there any deal-killer items the seller is aware of (foundation, flood, title, zoning, code violations)?
- Is there a deadline driving the sale (1031 exchange, divorce, estate, relocation)? That informs how much negotiation room exists.
- Schools are D-rated, which usually means shorter tenancies and higher turnover. Who's the typical renter profile here, and what's been the actual vacancy rate?
- Crime grade is D in this area — have there been break-ins, vandalism, or insurance claims at this property in the last 3 years? What carrier currently insures it and at what premium?
- What's the average days-on-market for RENTAL listings here right now (not sales)? A rising rental-DOM trend means longer vacancies and softer asking-rent achievability than the comps imply.
- What's the recent tenant-quality profile in this submarket — average credit score on applications, eviction rate, late-payment / NSF rate, and stable-employment percentage? A property-management company in the area should have these aggregated.
- How much new for-sale + rental construction is in the pipeline within 1–3 miles? Heavy new supply typically softens prices + rents 12–24 months out; constrained supply supports both.
Investment metrics
- 1% rule
- 1.44% ✓
- Cap rate
- 11.88%
- Cash-on-cash
- 19.96%
- DSCR
- 1.89
- GRM
- 5.8
CMA / ARV
- ARV (median comp)
- $125,107
- List price
- $115,000
- Delta
- -8.08%
- Verdict
- FAIR
- Comps
- 13 within 1.0 mi
Show comp detail 2 sales within ~0.75 mi
| Address | Dist | Beds/Ba | Sqft | Sold | Price | $/sf | Match |
|---|---|---|---|---|---|---|---|
| 329 Hampton St | 0.36mi | 3/1.0 (+1) | 912 (+12%) | 1mo | $191,000 | $209 | 57 |
| 205 Old Griffin Rd | 0.45mi | 2/1.0 | 924 (+14%) | 24mo | $210,000 | $227 | 36 |
Match score weights: distance 35% · size 25% · config 20% · recency 20%. Top-matched comps best support the ARV.
Projected returns pro-forma
-3.0% appreciation · 0.0% rent growth · sell at horizon
- IRR
- 8.7%
- Equity multiple
- 1.33×
- Total profit
- $10,642
- Equity at exit
- $17,147
- IRR
- 15.3%
- Equity multiple
- 2.07×
- Total profit
- $34,508
- Equity at exit
- $9,943
Cash invested: $32,200 (down + closing). Projections, not guarantees.
Landlord ↔ Tenant lean methodology
- Overall (STATE)
- 90 Strongly Landlord-Friendly
- State Georgia
- 90 Strongly Landlord-Friendly · R+3
- County
- — inherits STATE
- City
- — inherits STATE
ZIP-level market 30253
- Home prices YoY
- -29.4%
- Rents YoY
- -0.3%
- Active inventory
- 663
- Price-to-rent
- 5.8×
Monthly cashflow live
- Estimated rent
- $1,653 high interval (Pro) →
- Mortgage (P&I)
- −$603
- Tax from tax record
- −$120 /mo · $1,435/yr
- Insurance
- −$48
- HOA
- −$0
- Vacancy / Maint / Mgmt
- −$347
- Net cashflow
- $536
Break-even live
Sensitivity live
| Price | -10% $601 | -5% $568 | +0% $536 | +5% $503 | +10% $470 |
|---|---|---|---|---|---|
| Rent | -10% $405 | -5% $470 | +0% $536 | +5% $601 | +10% $666 |
| Rate | -1.0pp $594 | -0.5pp $565 | base $536 | +0.5pp $506 | +1.0pp $475 |
UW: 25.0% down · 7.5% · 30yr · 1.5% tax · 5.0% vac · 8.0% maint · 8.0% mgmt
Financing live
Cash to close
- Down payment
- $28,750
- Closing costs
- $3,450
- Reserves months
- —
- Total cash needed
- —
Loan-product check · same deal, 3 products live
Conventional
25% down · 7.5% · 30yr
- Down + closing
- —
- Monthly P&I
- —
- Monthly cashflow
- —
- DSCR
- —
- Eligible?
- —
Personal DTI + credit; lowest rate.
DSCR
20% down · 8.5% · 30yr
- Down + closing
- —
- Monthly P&I
- —
- Monthly cashflow
- —
- DSCR
- —
- Eligible?
- —
No personal income docs; deal must DSCR.
Hard money
10% down · 12.0% · 12mo
- Down + closing
- —
- Monthly P&I
- —
- Monthly cashflow
- —
- DSCR
- —
- Eligible?
- —
Short-term bridge; refi at stabilization.
Rent comps 23 comps
| Address | Beds | Baths | Sqft | Rent | $/sqft | DOM | Units | Dist |
|---|---|---|---|---|---|---|---|---|
| 102 Sable Chase Blvd McDonough, GA | 1.0–3.0 | 1.0–2.0 | 980 | $1,388 | $1.42 | 3d | 22 | 0.44mi |
| 205 Bridges Rd McDonough, GA | 1.0–3.0 | 1.0–2.0 | 1083 | $1,768 | $1.63 | 3d | 31 | 0.64mi |
| 100 Crossing Blvd #1403 McDonough, GA | 1.0–2.0 | 1.0–2.0 | 1030 | $2,042 | $1.98 | 19d | 10 | 0.77mi |
| 122 Samanthas Way McDonough, GA | 3.0 | 2.0 | 1118 | $1,600 | $1.43 | 44d | 1 | 0.84mi |
| 570 McDonough Pkwy McDonough, GA | 1.0–3.0 | 1.0–2.0 | 1066 | $1,632 | $1.53 | 1d | 27 | 0.87mi |
| 300 Rogers St McDonough, GA | 2.0 | 1.0 | 730 | $1,350 | $1.85 | 5d | 1 | 0.89mi |
| 300 Rogers St McDonough, GA | 2.0 | 1.0 | 730 | $1,350 | $1.85 | 44d | 1 | 0.89mi |
| 820 Hampton Rd McDonough, GA | 1.0–3.0 | 1.0–2.0 | 1149 | $1,567 | $1.36 | 2d | 15 | 0.99mi |
| 575 McDonough Pkwy McDonough, GA | 1.0–2.0 | 1.0–2.5 | 960 | $1,900 | $1.98 | 2d | 15 | 0.99mi |
| 1116 Whisper Wind Dr McDonough, GA | 3.0 | 2.0 | 1118 | $1,890 | $1.69 | 44d | 1 | 1.00mi |
| 130 Jonesboro St Unit H McDonough, GA | 1.0 | 1.0 | 600 | $1,500 | $2.50 | 44d | 1 | 1.05mi |
| 745 Georgia 42 McDonough, GA | 1.0 | 1.0 | 880 | $1,716 | $1.95 | 15d | 1 | 1.11mi |
| 1000 Overton LOOP McDonough, GA | 1.0–3.0 | 1.0–2.0 | 1076 | $1,783 | $1.66 | 2d | 28 | 1.15mi |
| 100 Preston Creek Dr McDonough, GA | 1.0–3.0 | 1.0–2.0 | 1117 | $1,974 | $1.77 | 44d | 13 | 1.19mi |
| 100 Preston Creek Dr McDonough, GA | 1.0–3.0 | 1.0–2.0 | 1117 | $1,666 | $1.49 | 3d | 17 | 1.19mi |
| 740 McDonough Pkwy McDonough, GA | 1.0–3.0 | 1.0–2.0 | 1128 | $1,704 | $1.51 | 2d | 17 | 1.25mi |
| 532 Epris Ln McDonough, GA | 2.0 | 2.0 | 1070 | $1,400 | $1.31 | 5d | 1 | 1.29mi |
| 14 Brannan St McDonough, GA | 2.0 | 1.0 | 1100 | $1,295 | $1.18 | 44d | 1 | 1.30mi |
| 235 Jonesboro Rd McDonough, GA | 1.0–3.0 | 1.0–2.0 | 996 | $1,699 | $1.71 | 2d | 3 | 1.31mi |
| 155 Cola Welch Pkwy McDonough, GA | 1.0–3.0 | 1.0–2.0 | 901 | $1,424 | $1.58 | 3d | 9 | 1.33mi |
| 190 Rosewood Dr McDonough, GA | 3.0 | 2.0 | 1055 | $1,592 | $1.51 | 24d | 1 | 1.33mi |
| 1000 Columns Dr McDonough, GA | 1.0–2.0 | 1.0–2.0 | 1036 | $1,790 | $1.73 | 3d | 19 | 1.35mi |
| 100 Woodlawn Park Dr McDonough, GA | 1.0–3.0 | 1.0–2.0 | 1029 | $1,596 | $1.55 | 2d | 19 | 1.39mi |
Listing history 34 events
-
2026-06-18days on market $115,000 Active 100 DOM
-
2026-06-17days on market $115,000 Active 99 DOM
-
2026-06-16days on market $115,000 Active 98 DOM
-
2026-06-15days on market $115,000 Active 97 DOM
-
2026-06-13days on market $115,000 Active 95 DOM
-
2026-06-09days on market $115,000 Active 91 DOM
-
2026-06-08days on market $115,000 Active 90 DOM
-
2026-06-07days on market $115,000 Active 89 DOM
-
2026-06-04days on market $115,000 Active 86 DOM
-
2026-06-03days on market $115,000 Active 85 DOM
-
2026-06-02days on market $115,000 Active 84 DOM
-
2026-06-01days on market $115,000 Active 83 DOM
-
2026-05-31days on market $115,000 Active 82 DOM
-
2026-04-07price $115,000 155-char remark
Show marketing remark (155 chars)
Distress property which has been partially remodeled with new roof, siding, windows, and some electrical & plumbing completed. Bring your best offer!!
-
2026-03-10$125,000 New 155-char remark
Show marketing remark (155 chars)
Distress property which has been partially remodeled with new roof, siding, windows, and some electrical & plumbing completed. Bring your best offer!!
-
2025-12-31historical
-
2025-05-14$170,000 New
-
2024-11-06soldstatus $85,000 Sold
-
2024-11-04soldstatus $85,000 Closed
-
2024-08-30status Pending
-
2024-08-30status Under Contract
-
2024-08-11status Active
-
2024-08-11status Back On Market
-
2024-07-17status Pending
-
2024-07-17status Under Contract
-
2024-05-25$95,000 New
-
2024-05-25$95,000 Active
-
2020-03-11soldstatus $45,000
-
2019-06-25soldstatus $40,000 Closed
-
2019-06-25soldstatus $40,000 Sold
-
2019-06-05status Under Contract
-
2019-06-05status Pending
-
2019-05-31$40,000 Active
-
2019-05-31$40,000 New
ⓘ Source: listings_history table (triggers on properties + properties_extension) + one-shot
backfill from property_details.listing_events for pre-trigger history.
Tax reassessment forecast GA · Resets to sale price
- Current annual tax
- $1,435 · $120/mo
- Projected year-2 tax
- $1,435 · $120/mo
- Expected delta
- $0/yr ($0/mo · 0.0%)
ⓘ Screening estimate from a state-policy table — verify with the county assessor before closing.
Climate risk First Street
- Flood 1/10 Low FEMA zone X (unshaded) · 0% chance over 30 yrs
- Wildfire 3/10 Moderate
- Heat 6/10 Major 7 d/yr ≥106°F today · 18 d/yr by 30 yrs out
- Wind 6/10 Major 27% chance of damaging wind over 30 yrs
- Air quality 4/10 Moderate 4 unhealthy d/yr today · 8 by 30 yrs out
Nearby sold comps map
Loading sold comps map…
Walkable amenities ~0.75 mi
Loading nearby amenities…
Taxation est. · year 1
- Rental income
- $19,840
- − Mortgage interest
- −$6,442
- − Property taxes
- −$1,435
- − Insurance
- −$575
- − Repairs & maintenance
- −$1,587
- − Management
- −$1,587
- − Depreciation
- −$3,345
- Taxable income
- $4,869
- Est. tax owed @ 24.0%
- −$1,169
- After-tax cash flow
- $5,259/yr
For passive investors: Depreciation is non-cash, so a rental often shows a tax loss while cash-flowing — sheltering income. Rental losses are passive: they offset passive income freely, and up to $25,000/yr can offset ordinary (W-2) income if you actively participate and your MAGI is under $100k (phasing out to $0 by $150k); unused losses carry forward. On sale, claimed depreciation is recaptured at up to 25%, and gains may owe capital-gains tax (a 1031 exchange can defer both). Figures are a year-1 estimate at your 24.0% rate — not tax advice; consult a CPA.
Schools (NCES district)
- District
- Henry County
- NCES district ID
- 1302820
- Math proficiency
- 24% ▼ -9.00%
- Reading proficiency
- 33% ▼ -7.00%
- Median HH income
- $62,594
- Composite
- 26.13/100
- National rank
- #7279
- State rank
- #89 of 174 in GA
Livability — McDonough
- Score
- 63/100
- State rank
- #279
- US rank
- #14962
Category grades
Schools grade is shown separately in the Schools card above.
Census & demographics
- Census place
- McDonough, GA
- County
- Henry County · 316,359 people
- City population
- 114,333
- Metro
- Atlanta-Sandy Springs-Alpharetta, GA
- Population (ZIP)
- 64,779
- Household income
- $81,892
- Rent vs Own
- Severe rent burden
- 2591.0
Population outlook (Henry County) Hauer SSP2
- Today (2025)
- 249,041 people
- By 2030
- 264,369 · +6.2%
- By 2040
- 294,459 · +18.2%
- By 2050
- 322,249 · +29.4%
- By 2075
- 392,310 · +57.5%
- By 2100
- 437,836 · +75.8%
Race, ethnicity, and origin ACS 2023
- Neighborhood character
- Diverse neighborhood (Simpson 0.57)
- Race & ethnicity
- Black 61% White 22% Two or more races 7% Hispanic / Latino 7% Asian 3%
- Hispanic origin (detail)
- Mexican 3%
- Common ancestry
- Hispanic 1% Lithuanian 1% Slovak 1%
- Foreign-born
- 10% · Canada, China, Vietnam
- Languages at home
- 89% English-only · Spanish 5% French/Haitian/Cajun 1% Vietnamese 1%
Political lean MEDSL · Henry
- 2024 margin
- Strong D (+29.7) · D 64.5% · R 34.9%
- 2008→2024 swing
- +37.1pp toward D · 2008: -7.5pp · 2024: 29.7pp
- All cycles
- 2024: D+29.7 2020: D+20.5 2016: D+4.3 2012: R+3.2 2008: R+7.5
Not yet ingested
- Civics
- —
Market trends
- HPI YoY
- ▼ -87.51%
- Current HPI
- 210.679
- Rent YoY
- ▼ -0.35%
- Metro
- Atlanta-Sandy Springs-Alpharetta, GA
- State GDP YoY
- ▲ 2.66%
- F500 in state
- 28
Industry mix (Fortune 500 HQ in GA)
| Industry | F500 HQs | Revenue |
|---|---|---|
| Paper / Packaging | 2 | $29B |
|
||
| Retail | 1 | $160B |
|
||
| Transportation / Logistics | 1 | $91B |
|
||
| Airlines | 1 | $62B |
|
||
| Consumer Goods | 1 | $47B |
|
||
| Utilities | 1 | $25B |
|
||
Price history
+187.5% since first listed21 events — show timeline
- 2026-04-07 Price Changed $115,000 GAMLS
- 2026-03-10 Listed $125,000 GAMLS
- 2025-12-31 Listing Removed — GAMLS
- 2025-05-14 Listed $170,000 GAMLS
- 2024-11-06 Sold (MLS) $85,000 GAMLS
- 2024-11-04 Sold (MLS) $85,000 FMLS
- 2024-08-30 Pending — FMLS
- 2024-08-30 Pending — GAMLS
- 2024-08-11 Relisted — FMLS
- 2024-08-11 Relisted — GAMLS
- 2024-07-17 Pending — FMLS
- 2024-07-17 Pending — GAMLS
- 2024-05-25 Listed $95,000 FMLS
- 2024-05-25 Listed $95,000 GAMLS
- 2020-03-11 Sold (Public Records) $45,000 Public Records
- 2019-06-25 Sold (MLS) $40,000 GAMLS
- 2019-06-25 Sold (MLS) $40,000 FMLS
- 2019-06-05 Pending — GAMLS
- 2019-06-05 Pending — FMLS
- 2019-05-31 Listed $40,000 GAMLS
- 2019-05-31 Listed $40,000 FMLS
Property tax history
+3.6%/yrLatest (2025): $1,435 · +11.5% YoY. Source: county tax records.
Cash-flow waterfall
monthlySold comps — $/sqft
last 12 mo · ≤1 miLoading sold comps…