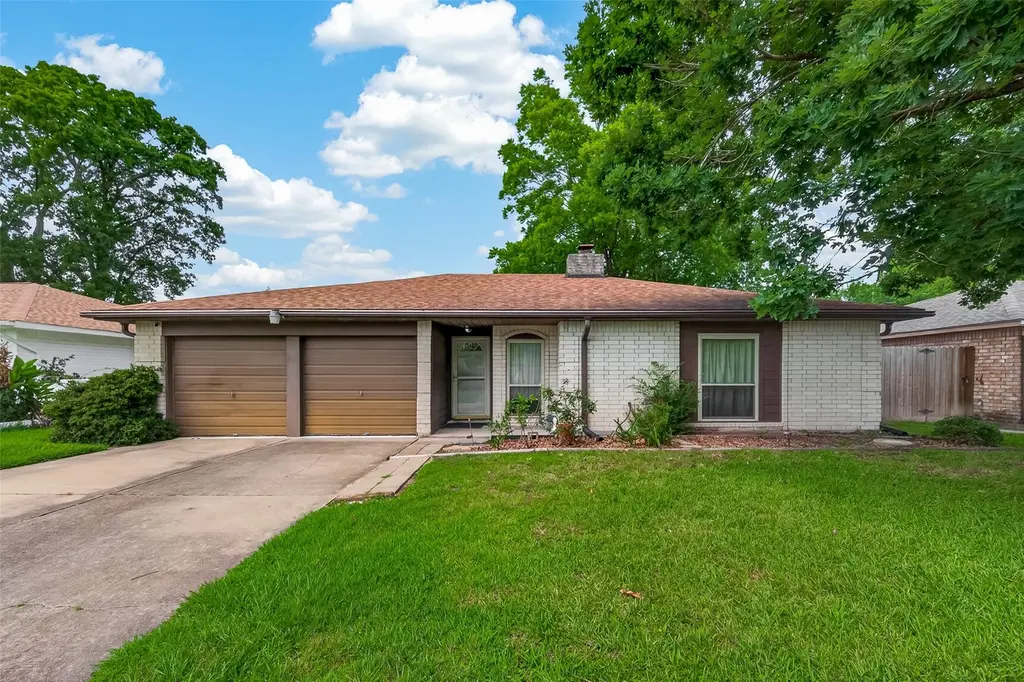
7742 Willow Mint Ln · Houston, TX
Flood risk 4/10 · Minor
- FEMA flood zone
- X (unshaded)
- Chance of flooding over 30 yrs
- 0.2%
- Est. flood insurance / yr
- $507 – $1,088
Fire risk 1/10 · Minimal
- Est. fire insurance / yr
- $1,222 – $2,270
Heat risk 9/10 · Severe
- Hot days now (above 110°F)
- 7 days/yr
- Hot days in 30 yrs
- 22 days/yr
Wind risk 9/10 · Severe
- Chance of severe wind over 30 yrs
- 99.0%
Air-quality risk 3/10 · Minor
- Unhealthy air days now
- 3 days/yr
- Unhealthy air days in 30 yrs
- 4 days/yr
Risk factors via First Street. Map © Google.
Why this score? — see what drove the C+ grade
The composite is a weighted blend of 9 inputs, each scored 0–100. Each bar is that input's sub-score; the figure is the points it added to the 100-point composite (weight × sub-score).
- Cash flow +16.7/30.0
- ARV discount +15.0/15.0
- 1% rule +6.2/10.0
- Appreciation +5.8/10.0
- DSCR +5.2/10.0
- Schools +4.1/10.0
- Livability +3.7/5.0
- Condition / age +2.5/5.0
- Rent growth +2.2/5.0
$169,000
🖨 Deal sheet (PDF) 📄 Offer letter ✓ Due diligence
Listing remarks
Welcome home to this spacious 3-bedroom, 2-bathroom retreat nestled in a well-established neighborhood. Just a short stroll from popular dining and shopping destinations, everyday convenience is right at your doorstep. This charming property is brimming with potential — the perfect canvas for buyers who love putting their personal stamp on a home and building equity along the way. Whether you're envisioning a modern refresh or a thoughtful renovation, the bones are here and the possibilities are endless. A rare opportunity to own in a sought-after location at an accessible price point.
Key facts
- 6,825 sq ft lot
- 2 garage spots
- Community pool
Property features AI
Finance
- HOA & community: Community managed by SBB Management; Annual association fee of $369; Community pool
Exterior
- Parking: Attached 2-car garage
- Utilities: Public water; Public sewer
- Home design: Residential property; Built in 1972; Slab foundation; Composition roof
- Construction: Brick and wood siding construction
- Exterior features: Concrete road access; Subdivision lot
Interior
- Kitchen: Dishwasher; Electric oven; Electric range
- Bedrooms: Primary bedroom on the first floor (14 x 12); Bedroom on the first floor (10 x 9); Bedroom on the first floor (10 x 8)
- Flooring: Carpet; Laminate
- Bathrooms: 2 full bathrooms
- Heating & cooling: Central heating (electric); Central air conditioning (electric)
- Interior features: One fireplace; Carpet and laminate flooring; 4 total rooms
- Laundry & utility: Washer included
Neighborhood map
What this means for you Summary
Snapshot
- This is a 4-bed/2.0-bath single-family listed at $169k.
Deal economics
- At list price, monthly cash flow is $106 ($1k/yr) — positive.
- The deal already cash-flows at list — no discount required.
- Meets the 1% rule at list price ($2k rent vs $169k).
- Cap rate 7.0% vs local median 3.1% in Houston — top-decile yield for the area; either an underpriced asset or a hidden risk that comps aren't pricing in. Stress-test before assuming the spread holds.
Location & tenants
- Location reads 74/100 on livability (#184 in TX, #4,771 nationally) — a middle-class / working-renter tenant base. Strengths: amenities A+, cost of living A+, housing A+; Watch: crime F.
- Klein ISD (suburban): math 41% / reading 48% proficiency, ranked #213 of 826 in TX (top 26%) — families likely to look elsewhere, expect single-tenant / working-renter base with shorter leases.
- Zoned schools: Epps Island El (math 28% / reading 34%, grade F, #2,429 of 4,322 statewide, top 57%, 541 students, 85% FRL); Klein Int (math 22% / reading 30%, grade F, #1,222 of 1,662 statewide, top 74%, 1,062 students, 86% FRL); Klein H S (math 58% / reading 67%, grade B-, #234 of 1,632 statewide, top 14%, 3,352 students, 45% FRL) — zoned schools average 72% FRL vs 37% district-wide (35 pts higher); higher-poverty schools than district average — tighter screening recommended.
- Market conditions: Rents soft (-1.2%/yr); 79 active listings in the ZIP; 8 comparable units currently listed for rent nearby; rentals lingering (median 46d on market — plan ~5-8 weeks vacancy on turnover, expect pricing pressure); 50% of comp listings sitting > 30 days — soft ceiling on asking rent; 29,883 units permitted in Harris County in 2024 (8,621 in 5+ unit buildings).
- This rent runs 39% of the median local income ($58k/yr) — at the standard rent-burdened threshold; future hikes will face affordability resistance.
Forward outlook
- In year one you build about $4k of equity ($1k loan paydown + $3k appreciation (1.6% local appreciation)).
- Harris County population projected at +47% by 2050 — long-run rental-demand tailwind backs the buy-and-hold thesis.
- At projected returns (1.6% appreciation + 0.0% rent growth), your $47k cash investment doubles in ~10 years — after that, you're playing with house money.
- By year 9, paydown + projected appreciation supports a ~$34k cash-out refi (75% LTV) — recoverable capital for the next deal without selling this one.
Negotiation context
- Only 7 days on market — expect competitive offers; lowballing is unlikely to land.
Risks & watch-outs
- Watch-outs: property tax is 2.9% of price.
- Climate carrying-cost: severe wind risk, 99% chance of damaging wind over 30y; extreme-heat days projected 7→22/yr by 2055 (HVAC capex compounding) — expect insurance premiums to compound above CPI over the hold.
Questions for the listing agent
- Built in 1972 — when were the roof, HVAC, electrical panel, plumbing, and water heater last replaced?
- Property tax is high relative to price — has the assessment been appealed recently, and will the sale trigger a re-assessment?
- What does the HOA fee cover, when was the last increase, and are there any pending special assessments or reserve-fund shortfalls?
- Is there a deadline driving the sale (1031 exchange, divorce, estate, relocation)? That informs how much negotiation room exists.
- Schools are D-rated, which usually means shorter tenancies and higher turnover. Who's the typical renter profile here, and what's been the actual vacancy rate?
- Crime grade is F in this area — have there been break-ins, vandalism, or insurance claims at this property in the last 3 years? What carrier currently insures it and at what premium?
- What's the average days-on-market for RENTAL listings here right now (not sales)? A rising rental-DOM trend means longer vacancies and softer asking-rent achievability than the comps imply.
- What's the recent tenant-quality profile in this submarket — average credit score on applications, eviction rate, late-payment / NSF rate, and stable-employment percentage? A property-management company in the area should have these aggregated.
- How much new for-sale + rental construction is in the pipeline within 1–3 miles? Heavy new supply typically softens prices + rents 12–24 months out; constrained supply supports both.
Investment metrics
- 1% rule
- 1.12% ✓
- Cap rate
- 7.04%
- Cash-on-cash
- 2.68%
- DSCR
- 1.12
- GRM
- 7.4
CMA / ARV
- ARV (median comp)
- $213,597
- List price
- $169,000
- Delta
- -20.88%
- Verdict
- UNDERPRICED
- Comps
- 20 within 1.0 mi
Show comp detail 12 sales within ~0.75 mi
| Address | Dist | Beds/Ba | Sqft | Sold | Price | $/sf | Match |
|---|---|---|---|---|---|---|---|
| 7807 Willow Mint Ln | 0.08mi | 3/2.0 (-1) | 1,322 (-1%) | 8mo | $229,000 | $173 | 83 |
| 9710 Wind Flower Ln | 0.23mi | 4/2.0 | 1,386 (+4%) | 1mo | $225,000 | $162 | 82 |
| 7810 Willow Mint Ln | 0.08mi | 4/2.0 | 1,209 (-10%) | 1mo | $224,000 | $185 | 79 |
| 7718 Woodnettle Ln | 0.08mi | 3/2.0 (-1) | 1,464 (+10%) | 2mo | $239,000 | $163 | 74 |
| 9627 Crooked Wood Ln | 0.18mi | 3/2.0 (-1) | 1,308 (-2%) | 11mo | $218,900 | $167 | 74 |
| 7831 Martin Wood Ln | 0.16mi | 3/2.0 (-1) | 1,498 (+12%) | 0mo | $229,000 | $153 | 67 |
| 7810 Bunker Wood Ln | 0.42mi | 3/2.0 (-1) | 1,310 (-2%) | 11mo | $219,500 | $168 | 63 |
| 9607 Rumbling Wood Ln | 0.26mi | 3/2.0 (-1) | 1,177 (-12%) | 3mo | $245,000 | $208 | 60 |
| 9411 Sutter Park Ln | 0.71mi | 3/2.0 (-1) | 1,373 (+3%) | 8mo | $240,000 | $175 | 51 |
| 7646 Winkle Wood Ln | 0.49mi | 3/2.0 (-1) | 1,488 (+11%) | 5mo | $199,900 | $134 | 50 |
| 13506 Blue Swallow Dr | 0.53mi | 3/2.0 (-1) | 1,485 (+11%) | 10mo | $255,000 | $172 | 43 |
| 7671 Bubbling Spring Ln | 0.62mi | 3/2.0 (-1) | 1,488 (+11%) | 6mo | $212,000 | $142 | 42 |
Match score weights: distance 35% · size 25% · config 20% · recency 20%. Top-matched comps best support the ARV.
Projected returns pro-forma
1.6% appreciation · 0.0% rent growth · sell at horizon
- IRR
- 3.9%
- Equity multiple
- 1.20×
- Total profit
- $9,509
- Equity at exit
- $63,021
- IRR
- 5.9%
- Equity multiple
- 1.72×
- Total profit
- $34,232
- Equity at exit
- $88,036
Cash invested: $47,320 (down + closing). Projections, not guarantees.
Landlord ↔ Tenant lean methodology
- Overall (STATE)
- 87 Strongly Landlord-Friendly
- State Texas
- 87 Strongly Landlord-Friendly · R+5
- County
- — inherits STATE
- City
- — inherits STATE
ZIP-level market 77086
- Home prices YoY
- 0.6%
- Rents YoY
- -1.2%
- Active inventory
- 79
- Price-to-rent
- 7.4×
Monthly cashflow live
- Estimated rent
- $1,892 high interval (Pro) →
- Mortgage (P&I)
- −$886
- Tax from tax record
- −$402 /mo · $4,821/yr
- Insurance
- −$70
- HOA
- −$31
- Vacancy / Maint / Mgmt
- −$397
- Net cashflow
- $106
Break-even live
Sensitivity live
| Price | -10% $201 | -5% $153 | +0% $106 | +5% $58 | +10% $10 |
|---|---|---|---|---|---|
| Rent | -10% $-44 | -5% $31 | +0% $106 | +5% $180 | +10% $255 |
| Rate | -1.0pp $191 | -0.5pp $149 | base $106 | +0.5pp $62 | +1.0pp $17 |
UW: 25.0% down · 7.5% · 30yr · 1.5% tax · 5.0% vac · 8.0% maint · 8.0% mgmt
Financing live
Cash to close
- Down payment
- $42,250
- Closing costs
- $5,070
- Reserves months
- —
- Total cash needed
- —
Loan-product check · same deal, 3 products live
Conventional
25% down · 7.5% · 30yr
- Down + closing
- —
- Monthly P&I
- —
- Monthly cashflow
- —
- DSCR
- —
- Eligible?
- —
Personal DTI + credit; lowest rate.
DSCR
20% down · 8.5% · 30yr
- Down + closing
- —
- Monthly P&I
- —
- Monthly cashflow
- —
- DSCR
- —
- Eligible?
- —
No personal income docs; deal must DSCR.
Hard money
10% down · 12.0% · 12mo
- Down + closing
- —
- Monthly P&I
- —
- Monthly cashflow
- —
- DSCR
- —
- Eligible?
- —
Short-term bridge; refi at stabilization.
Rent comps 8 comps
| Address | Beds | Baths | Sqft | Rent | $/sqft | DOM | Units | Dist |
|---|---|---|---|---|---|---|---|---|
| 7750 Water Park Ln Houston, TX | 4.0 | 2.0 | 1209 | $1,900 | $1.57 | 45d | 1 | 0.15mi |
| 9526 Golden Wood Ln Houston, TX | 3.0 | 2.0 | 1687 | $1,850 | $1.10 | 45d | 1 | 0.26mi |
| 12752 N Houston Rosslyn Rd Houston, TX | 1.0–3.0 | 1.0–2.0 | 922 | $1,963 | $2.13 | 1d | 13 | 0.84mi |
| 9410 Fairbanks North Houston Rd Houston, TX | 3.0 | 2.0 | 1331 | $1,733 | $1.30 | 3d | 1 | 1.16mi |
| 9410 Fairbanks North Houston Rd Houston, TX | 3.0 | 2.0 | 1331 | $1,733 | $1.30 | 7d | 1 | 1.16mi |
| 12626 Atwood Grove Ln Houston, TX | 3.0 | 2.0 | 1672 | $1,900 | $1.14 | 45d | 1 | 1.24mi |
| 5113 Caldera Ct Houston, TX | 3.0 | 2.5 | 1847 | $1,811 | $0.98 | 1d | 1 | 1.37mi |
| 11430 Hackmatack Way Houston, TX | 3.0 | 3.0 | 1644 | $2,200 | $1.34 | 45d | 1 | 1.46mi |
HOA detail
- Monthly dues
- $31 · $372/yr
Listing history 2 events
-
2026-05-14$169,000 Active 598-char remark
-
1988-01-02soldstatus
ⓘ Source: listings_history table (triggers on properties + properties_extension) + one-shot
backfill from property_details.listing_events for pre-trigger history.
Tax reassessment forecast TX · Resets to sale price
- Current annual tax
- $4,821 · $402/mo
- Projected year-2 tax
- $4,821 · $402/mo
- Expected delta
- $0/yr ($0/mo · 0.0%)
ⓘ Screening estimate from a state-policy table — verify with the county assessor before closing.
Climate risk First Street
- Flood 4/10 Moderate FEMA zone X (unshaded) · 20% chance over 30 yrs
- Wildfire 1/10 Low
- Heat 9/10 Extreme 7 d/yr ≥110°F today · 22 d/yr by 30 yrs out
- Wind 9/10 Extreme 99% chance of damaging wind over 30 yrs
- Air quality 3/10 Moderate 3 unhealthy d/yr today · 4 by 30 yrs out
Nearby sold comps map
Loading sold comps map…
Walkable amenities ~0.75 mi
Loading nearby amenities…
Taxation est. · year 1
- Rental income
- $22,709
- − Mortgage interest
- −$9,467
- − Property taxes
- −$4,821
- − Insurance
- −$845
- − Repairs & maintenance
- −$1,817
- − Management
- −$1,817
- − HOA
- −$372
- − Depreciation
- −$4,916
- Taxable loss
- −$1,346
- Est. tax savings @ 24.0%
- +$323
- After-tax cash flow
- $1,590/yr
For passive investors: Depreciation is non-cash, so a rental often shows a tax loss while cash-flowing — sheltering income. Rental losses are passive: they offset passive income freely, and up to $25,000/yr can offset ordinary (W-2) income if you actively participate and your MAGI is under $100k (phasing out to $0 by $150k); unused losses carry forward. On sale, claimed depreciation is recaptured at up to 25%, and gains may owe capital-gains tax (a 1031 exchange can defer both). Figures are a year-1 estimate at your 24.0% rate — not tax advice; consult a CPA.
Schools (NCES district)
- District
- Klein ISD
- NCES district ID
- 4825740
- Math proficiency
- 41% ▼ -12.00%
- Reading proficiency
- 48% ▼ -3.00%
- Median HH income
- $78,288
- Composite
- 40.91/100
- National rank
- #3615
- State rank
- #213 of 826 in TX
Livability — Houston
- Score
- 74/100
- State rank
- #184
- US rank
- #4771
Category grades
Schools grade is shown separately in the Schools card above.
Census & demographics
- County
- Harris County · 4,702,590 people
- City population
- 3,226,434
- Metro
- Houston-The Woodlands-Sugar Land, TX
- Population (ZIP)
- 28,653
- Household income
- $58,200
- Rent vs Own
- Severe rent burden
- 1323.0
Population outlook (Harris County) Hauer SSP2
- Today (2025)
- 5,571,493 people
- By 2030
- 6,089,821 · +9.3%
- By 2040
- 7,142,806 · +28.2%
- By 2050
- 8,185,864 · +46.9%
- By 2075
- 10,574,329 · +89.8%
- By 2100
- 12,109,958 · +117.4%
Race, ethnicity, and origin ACS 2023
- Neighborhood character
- Diverse neighborhood (Simpson 0.55)
- Race & ethnicity
- Hispanic / Latino 63% Two or more races 26% Black 19% Asian 9% White 7%
- Hispanic origin (detail)
- Mexican 47%
- Common ancestry
- Slovak 1%
- Foreign-born
- 34% · Canada, Vietnam
- Languages at home
- 38% English-only · Spanish 54% Vietnamese 6% Other Asian/Pacific 1%
Political lean MEDSL · Harris
- 2024 margin
- Lean D (+5.5) · D 52.0% · R 46.4% · Other 1.6%
- 2008→2024 swing
- +3.9pp toward D · 2008: 1.6pp · 2024: 5.5pp
- All cycles
- 2024: D+5.5 2020: D+13.3 2016: D+12.4 2012: D+0.1 2008: D+1.6
Not yet ingested
- Civics
- —
Market trends
- HPI YoY
- ▲ 1.60%
- Current HPI
- 281.0065
- Rent YoY
- ▼ -1.19%
- Metro
- Houston-The Woodlands-Sugar Land, TX
- State GDP YoY
- ▲ 3.95%
- F500 in state
- 110
Industry mix (Fortune 500 HQ in TX)
| Industry | F500 HQs | Revenue |
|---|---|---|
| Energy | 16 | $1,198B |
|
||
| Technology | 5 | $198B |
|
||
| Engineering / Construction | 4 | $72B |
|
||
| Energy Services | 3 | $60B |
|
||
| Utilities | 3 | $41B |
|
||
| Healthcare | 2 | $330B |
|
||
Price history
3 events — show timeline
- 2026-05-21 Pending — HARMLS
- 2026-05-14 Listed $169,000 HARMLS
- 1988-01-02 Sold (Public Records) — Public Records
Property tax history
+6.1%/yrLatest (2025): $4,821 · +16.6% YoY. Source: county tax records.
Cash-flow waterfall
monthlySold comps — $/sqft
last 12 mo · ≤1 miLoading sold comps…