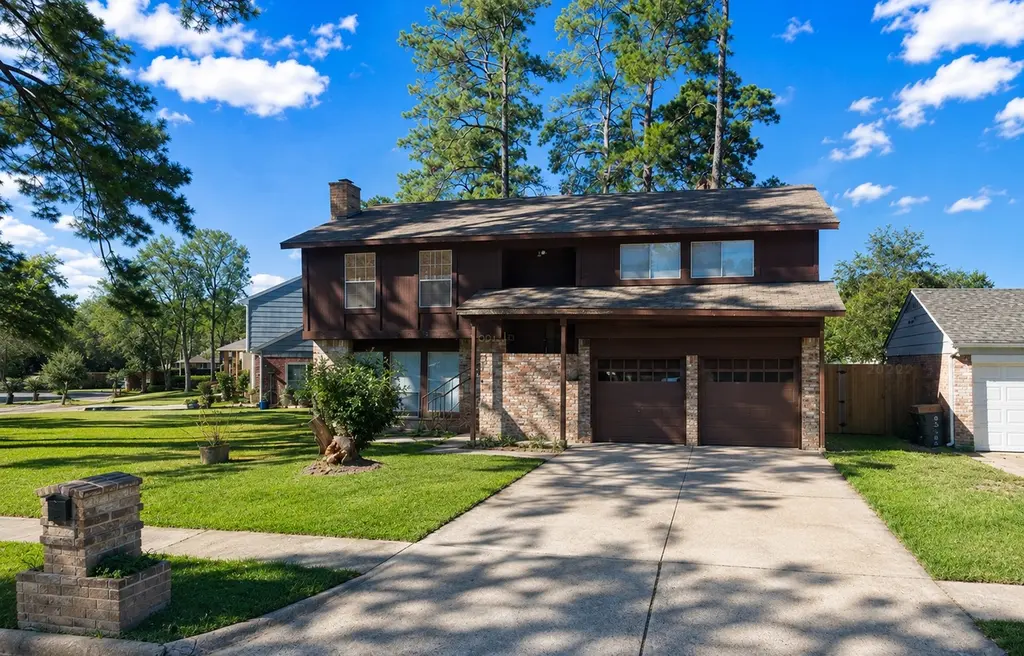
23005 Apple Arbor Dr · Spring, TX
Flood risk 3/10 · Minor
- FEMA flood zone
- X (unshaded)
- Chance of flooding over 30 yrs
- 0.2%
- Est. flood insurance / yr
- $507 – $1,088
Fire risk 3/10 · Minor
- Est. fire insurance / yr
- $1,222 – $2,270
Heat risk 9/10 · Severe
- Hot days now (above 110°F)
- 7 days/yr
- Hot days in 30 yrs
- 24 days/yr
Wind risk 8/10 · Major
- Chance of severe wind over 30 yrs
- 99.0%
Air-quality risk 3/10 · Minor
- Unhealthy air days now
- 3 days/yr
- Unhealthy air days in 30 yrs
- 3 days/yr
Risk factors via First Street. Map © Google.
Why this score? — see what drove the D+ grade
The composite is a weighted blend of 9 inputs, each scored 0–100. Each bar is that input's sub-score; the figure is the points it added to the 100-point composite (weight × sub-score).
- Cash flow +18.3/30.0
- 1% rule +8.2/10.0
- ARV discount +7.5/15.0
- DSCR +5.8/10.0
- Livability +3.3/5.0
- Condition / age +2.5/5.0
- Rent growth +2.4/5.0
- Schools +2.0/10.0
- Appreciation +0.0/10.0
$150,000
🖨 Deal sheet 📄 Offer letter ✓ Due diligence
Listing remarks
AS-IS corner home in the desirable Timber Lane area featuring a unique 70’s split-level layout with 4 bedrooms, 2 bathrooms, mature trees, and endless potential to renovate and modernize. Home is in need of a significant amount of repairs. Spacious floor plan, great curb appeal, and priced to sell quickly. Conveniently located near major highways, shopping, and schools in Spring ISD. Don’t miss this opportunity!
Key facts
- Shopping
- Conveniently located
- Timber lane area
Tags
Property features AI
Finance
- HOA & community: Timber Lane CIA homeowners association; Annual association fee of $520 covering common areas
Exterior
- Parking: Attached 2-car garage
- Utilities: Public water; Public sewer
- Home design: Residential property; Built in 1974; Slab foundation; Composition roof
- Construction: Brick and cement siding construction
- Exterior features: Corner lot in a subdivision; Concrete road surface
Interior
- Bedrooms: Primary bedroom on the first floor; Three additional bedrooms on the second floor
- Bathrooms: 2 full bathrooms
- Heating & cooling: Central heating (electric); Central air conditioning (electric)
- Interior features: One fireplace; Total of 4 rooms
Neighborhood map
What this means for you Summary
Snapshot
- This is a 3-bed/2.0-bath single-family listed at $150k.
Deal economics
- At list price, monthly cash flow is $138 ($2k/yr) — positive.
- The deal already cash-flows at list — no discount required.
- Meets the 1% rule at list price ($2k rent vs $150k).
- Cap rate 7.4% vs local median 4.5% in Spring — top-decile yield for the area; either an underpriced asset or a hidden risk that comps aren't pricing in. Stress-test before assuming the spread holds.
Location & tenants
- Location reads 66/100 on livability (#635 in TX) — a middle-class / working-renter tenant base. Strengths: cost of living A+, housing A+, employment B; Watch: crime D, amenities F, commute F.
- Spring ISD (suburban): math 19% / reading 26% proficiency, ranked #730 of 826 in TX (top 88%) — low school quality limits family demand, transient renter base, plan for 1-2y turnover; 66% free/reduced lunch — lower-income household profile, screen leases tightly.
- Zoned schools: Pearl M Hirsch El (math 15% / reading 28%, grade F, #3,470 of 4,322 statewide, top 81%, 647 students, 86% FRL); Twin Creeks Middle (math 23% / reading 24%, grade F, #1,317 of 1,662 statewide, top 80%, 973 students, 83% FRL); Spring H S (math 12% / reading 21%, grade F, #1,497 of 1,632 statewide, top 92%, 2,760 students, 72% FRL).
- Market conditions: Rents soft (-0.3%/yr); 595 active listings in the ZIP; 5 comparable units currently listed for rent nearby; rentals leasing fast (median 13d on market — plan ~1-2 weeks tenant-placement turnaround); solid renter incomes; 29,883 units permitted in Harris County in 2024 (8,621 in 5+ unit buildings).
Forward outlook
- Local home prices are declining (-3.0%/yr); year-one equity from $1k of loan paydown is wiped out by about $4k of value loss. Plan a longer hold.
- Harris County population projected at +47% by 2050 — long-run rental-demand tailwind backs the buy-and-hold thesis.
Negotiation context
- Only 14 days on market — expect competitive offers; lowballing is unlikely to land.
Risks & watch-outs
- Watch-outs: property tax is 4.2% of price.
- Climate carrying-cost: severe wind risk, 99% chance of damaging wind over 30y; extreme-heat days projected 7→24/yr by 2055 (HVAC capex compounding) — expect insurance premiums to compound above CPI over the hold.
Questions for the listing agent
- Built in 1974 — when were the roof, HVAC, electrical panel, plumbing, and water heater last replaced?
- Property tax is high relative to price — has the assessment been appealed recently, and will the sale trigger a re-assessment?
- What does the HOA fee cover, when was the last increase, and are there any pending special assessments or reserve-fund shortfalls?
- Is there a deadline driving the sale (1031 exchange, divorce, estate, relocation)? That informs how much negotiation room exists.
- Crime grade is D in this area — have there been break-ins, vandalism, or insurance claims at this property in the last 3 years? What carrier currently insures it and at what premium?
- The area grade is low — what's the realistic commute time and amenity access for the typical tenant pool here? Any planned neighborhood developments (good or bad) we should know about?
- What's the average days-on-market for RENTAL listings here right now (not sales)? A rising rental-DOM trend means longer vacancies and softer asking-rent achievability than the comps imply.
- What's the recent tenant-quality profile in this submarket — average credit score on applications, eviction rate, late-payment / NSF rate, and stable-employment percentage? A property-management company in the area should have these aggregated.
- How much new for-sale + rental construction is in the pipeline within 1–3 miles? Heavy new supply typically softens prices + rents 12–24 months out; constrained supply supports both.
Investment metrics
- 1% rule
- 1.32% ✓
- Cap rate
- 7.40%
- Cash-on-cash
- 3.95%
- DSCR
- 1.18
- GRM
- 6.3
CMA / ARV
- ARV (on-the-fly)
- $310,010
- Comps found
- 2
Show comp detail 2 sales within ~0.75 mi
| Address | Dist | Beds/Ba | Sqft | Sold | Price | $/sf | Match |
|---|---|---|---|---|---|---|---|
| 22811 Briarcreek Blvd | 0.23mi | 3/2.0 | 1,960 (-8%) | 21mo | $285,000 | $145 | 58 |
| 2351 Loyanne Dr | 0.74mi | 4/2.5 (+1) | 2,125 (-1%) | 8mo | $190,000 | $89 | 51 |
Match score weights: distance 35% · size 25% · config 20% · recency 20%. Top-matched comps best support the ARV.
Projected returns pro-forma
-3.0% appreciation · 0.0% rent growth · sell at horizon
- IRR
- -14.5%
- Equity multiple
- 0.50×
- Total profit
- $-21,033
- Equity at exit
- $22,365
- IRR
- -14.3%
- Equity multiple
- 0.33×
- Total profit
- $-28,283
- Equity at exit
- $12,969
Cash invested: $42,000 (down + closing). Projections, not guarantees.
Landlord ↔ Tenant lean methodology
- Overall (STATE)
- 87 Strongly Landlord-Friendly
- State Texas
- 87 Strongly Landlord-Friendly · R+5
- County
- — inherits STATE
- City
- — inherits STATE
ZIP-level market 77373
- Rents YoY
- -0.3%
- Active inventory
- 595
- Price-to-rent
- 6.3×
Monthly cashflow live
- Estimated rent
- $1,976 high interval (Pro) →
- Mortgage (P&I)
- −$787
- Tax from tax record
- −$531 /mo · $6,372/yr
- Insurance
- −$62
- HOA
- −$43
- Vacancy / Maint / Mgmt
- −$415
- Net cashflow
- $138
Break-even live
UW: 25.0% down · 7.5% · 30yr · 1.5% tax · 5.0% vac · 8.0% maint · 8.0% mgmt
Financing live
Cash to close
- Down payment
- $37,500
- Closing costs
- $4,500
- Reserves months
- —
- Total cash needed
- —
Loan-product check · same deal, 3 products live
Conventional
25% down · 7.5% · 30yr
- Down + closing
- —
- Monthly P&I
- —
- Monthly cashflow
- —
- DSCR
- —
- Eligible?
- —
Personal DTI + credit; lowest rate.
DSCR
20% down · 8.5% · 30yr
- Down + closing
- —
- Monthly P&I
- —
- Monthly cashflow
- —
- DSCR
- —
- Eligible?
- —
No personal income docs; deal must DSCR.
Hard money
10% down · 12.0% · 12mo
- Down + closing
- —
- Monthly P&I
- —
- Monthly cashflow
- —
- DSCR
- —
- Eligible?
- —
Short-term bridge; refi at stabilization.
Rent comps 5 comps
| Address | Beds | Baths | Sqft | Rent | $/sqft | DOM | Units | Dist |
|---|---|---|---|---|---|---|---|---|
| 2911 Cypress Island Dr Houston, TX | 4.0 | 2.0 | 2240 | $2,016 | $0.90 | 7d | 1 | 0.99mi |
| 2802 Mesquite Ridge Dr Houston, TX | 4.0 | 2.5 | 1902 | $2,045 | $1.08 | 12d | 1 | 1.11mi |
| 21631 S Werrington Way Houston, TX | 3.0 | 3.0 | 1645 | $1,900 | $1.16 | 43d | 1 | 1.18mi |
| 2427 Gianna Way Houston, TX | 3.0 | 2.5 | 1777 | $1,826 | $1.03 | 7d | 1 | 1.33mi |
| 21407 Palma Grove Way Houston, TX | 3.0 | 2.0 | 1407 | $1,000 | $0.71 | 12d | 1 | 1.44mi |
HOA detail
- Monthly dues
- $43 · $516/yr
Listing history 10 events
-
2026-06-13statusdays on market $150,000 Pending 14 DOM
-
2026-06-09days on market $150,000 Active 11 DOM
-
2026-06-08days on market $150,000 Active 10 DOM
-
2026-06-07days on market $150,000 Active 9 DOM
-
2026-06-04days on market $150,000 Active 6 DOM
-
2026-06-03days on market $150,000 Active 5 DOM
-
2026-06-02days on market $150,000 Active 4 DOM
-
2026-06-01days on market $150,000 Active 3 DOM
-
2026-06-01remarks 415-char remark
-
2026-05-31days on market $150,000 Active 2 DOM
ⓘ Source: listings_history table (triggers on properties + properties_extension) + one-shot
backfill from property_details.listing_events for pre-trigger history.
Tax reassessment forecast TX · Resets to sale price
- Current annual tax
- $6,372 · $531/mo
- Projected year-2 tax
- $6,372 · $531/mo
- Expected delta
- $0/yr ($0/mo · 0.0%)
ⓘ Screening estimate from a state-policy table — verify with the county assessor before closing.
Climate risk First Street
- Flood 3/10 Moderate FEMA zone X (unshaded) · 20% chance over 30 yrs
- Wildfire 3/10 Moderate
- Heat 9/10 Extreme 7 d/yr ≥110°F today · 24 d/yr by 30 yrs out
- Wind 8/10 Severe 99% chance of damaging wind over 30 yrs
- Air quality 3/10 Moderate 3 unhealthy d/yr today · 3 by 30 yrs out
Nearby sold comps map
Loading sold comps map…
Walkable amenities ~0.75 mi
Loading nearby amenities…
Taxation est. · year 1
- Rental income
- $23,715
- − Mortgage interest
- −$8,402
- − Property taxes
- −$6,372
- − Insurance
- −$750
- − Repairs & maintenance
- −$1,897
- − Management
- −$1,897
- − HOA
- −$516
- − Depreciation
- −$4,364
- Taxable loss
- −$483
- Est. tax savings @ 24.0%
- +$116
- After-tax cash flow
- $1,774/yr
For passive investors: Depreciation is non-cash, so a rental often shows a tax loss while cash-flowing — sheltering income. Rental losses are passive: they offset passive income freely, and up to $25,000/yr can offset ordinary (W-2) income if you actively participate and your MAGI is under $100k (phasing out to $0 by $150k); unused losses carry forward. On sale, claimed depreciation is recaptured at up to 25%, and gains may owe capital-gains tax (a 1031 exchange can defer both). Figures are a year-1 estimate at your 24.0% rate — not tax advice; consult a CPA.
Schools (NCES district)
- District
- Spring ISD
- NCES district ID
- 4841220
- Math proficiency
- 19% ▼ -13.00%
- Reading proficiency
- 26% ▼ -6.00%
- Median HH income
- $51,584
- Composite
- 20.12/100
- National rank
- #8643
- State rank
- #730 of 826 in TX
Livability — Spring
- Score
- 66/100
- State rank
- #635
- US rank
- #12101
Category grades
Schools grade is shown separately in the Schools card above.
Census & demographics
- Census place
- Spring, TX
- County
- Harris County · 4,702,590 people
- City population
- 430,529
- Metro
- Houston-The Woodlands-Sugar Land, TX
- Population (ZIP)
- 69,739
- Household income
- $88,617
- Rent vs Own
- Severe rent burden
- 1050.0
Population outlook (Harris County) Hauer SSP2
- Today (2025)
- 5,571,493 people
- By 2030
- 6,089,821 · +9.3%
- By 2040
- 7,142,806 · +28.2%
- By 2050
- 8,185,864 · +46.9%
- By 2075
- 10,574,329 · +89.8%
- By 2100
- 12,109,958 · +117.4%
Race, ethnicity, and origin ACS 2023
- Neighborhood character
- Diverse neighborhood (Simpson 0.69)
- Race & ethnicity
- Hispanic / Latino 40% White 30% Black 23% Two or more races 22% Asian 3%
- Hispanic origin (detail)
- Mexican 27% Puerto Rican 2% Cuban 2% Dominican 2%
- Common ancestry
- Lithuanian 2% Italian 1% Slovak 1%
- Foreign-born
- 17% · Canada, Jamaica, Vietnam
- Languages at home
- 64% English-only · Spanish 32% Vietnamese 1% Other Indo-European 1%
Political lean MEDSL · Harris
- 2024 margin
- Lean D (+5.5) · D 52.0% · R 46.4% · Other 1.6%
- 2008→2024 swing
- +3.9pp toward D · 2008: 1.6pp · 2024: 5.5pp
- All cycles
- 2024: D+5.5 2020: D+13.3 2016: D+12.4 2012: D+0.1 2008: D+1.6
Not yet ingested
- Civics
- —
Market trends
- HPI YoY
- ▼ -142.98%
- Current HPI
- 251.7231
- Rent YoY
- ▼ -0.30%
- Metro
- Houston-The Woodlands-Sugar Land, TX
- State GDP YoY
- ▲ 3.95%
- F500 in state
- 110
Industry mix (Fortune 500 HQ in TX)
| Industry | F500 HQs | Revenue |
|---|---|---|
| Energy | 16 | $1,198B |
|
||
| Technology | 5 | $198B |
|
||
| Engineering / Construction | 4 | $72B |
|
||
| Energy Services | 3 | $60B |
|
||
| Utilities | 3 | $41B |
|
||
| Healthcare | 2 | $330B |
|
||
Price history
2 events — show timeline
- 2026-05-29 Listed $150,000 HARMLS
- 1988-09-02 Sold (Public Records) — Public Records
Property tax history
+4.9%/yrLatest (2025): $6,372 · +5.0% YoY. Source: county tax records.
Cash-flow waterfall
monthlySold comps — $/sqft
last 12 mo · ≤1 miLoading sold comps…