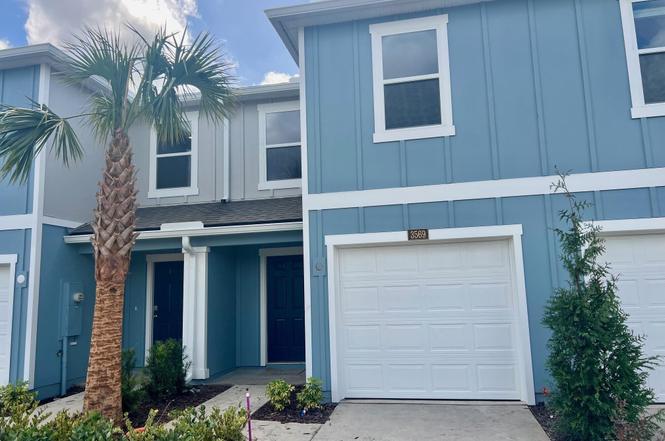
3569 Palomino Ct · Lakeside, FL
Flood risk No data
- FEMA flood zone
- —
- Chance of flooding over 30 yrs
- —
- Est. flood insurance / yr
- —
Fire risk No data
- Est. fire insurance / yr
- —
Heat risk No data
- Hot days now (above threshold)
- —
- Hot days in 30 yrs
- —
Wind risk No data
- Chance of severe wind over 30 yrs
- —
Air-quality risk No data
- Unhealthy air days now
- —
- Unhealthy air days in 30 yrs
- —
Risk factors via First Street. Map © Google.
Why this score? — see what drove the F grade
The composite is a weighted blend of 9 inputs, each scored 0–100. Each bar is that input's sub-score; the figure is the points it added to the 100-point composite (weight × sub-score).
- ARV discount +7.5/15.0
- Cash flow +7.1/30.0
- Schools +5.1/10.0
- Livability +3.4/5.0
- Rent growth +3.3/5.0
- 1% rule +2.5/10.0
- Condition / age +2.5/5.0
- DSCR +1.3/10.0
- Appreciation +0.0/10.0
$267,490
🖨 Deal sheet (PDF) 📄 Offer letter ✓ Due diligence
Listing remarks
READY NOW! * Welcome Home Package Included. Blinds, Fridge, W/ D, GDO! * Our new floor plan, the Sage townhome offers 1,427 square feet of thoughtfully designed living space with 3 bedrooms, 2.5 baths, and a 1-car garage which is perfect for comfortable, low-maintenance living. This open-concept floor plan is ideal for both everyday life and entertaining. The spacious kitchen features abundant counter space with quarts countertops and a bar that overlooks the gathering room, creating a seamless flow for hosting friends or enjoying family time. Sliding glass doors bring in an abundance of natural light, making the main living area feel bright and welcoming. Upstairs, the primary bedroom in
Key facts
- $125 HOA
- Garage
- Built 2026
Tags
Neighborhood map
What this means for you Summary
Snapshot
- This is a 3-bed/2.5-bath land listed at $267k.
Deal economics
- At list price, monthly cash flow is $-381 ($-5k/yr) — negative.
- To cash-flow at today's rent, offer at most $212k (20.6% below list).
- To meet the 1% rule (rent ≥ 1% of price), the offer needs to be $202k (24.6% below list).
- Recommended offer: $202k (24.6% below list) — sets the bar for 1% rule.
Location & tenants
- Location reads 68/100 on livability (#505 in FL) — a middle-class / working-renter tenant base. Strengths: cost of living A+, housing A+, crime B; Watch: amenities F, commute F, health & safety F.
- Clay (suburban): math 58% / reading 59% proficiency, ranked #14 of 73 in FL (top 19%) — acceptable for families but not a draw, mixed tenant base, ~2y average lease.
- Zoned schools: Coppergate Elementary School (math 69% / reading 65%, grade B+, #450 of 2,144 statewide, top 22%, 609 students, 100% FRL); Wilkinson Junior High School (math 54% / reading 49%, grade C, #232 of 571 statewide, top 41%, 752 students, 100% FRL); Ridgeview High School (math 41% / reading 53%, grade D-, #207 of 667 statewide, top 32%, 1,828 students, 46% FRL) — zoned schools average 82% FRL vs 35% district-wide (46 pts higher); higher-poverty schools than district average — tighter screening recommended.
- Market conditions: Rents rising (+3.4%/yr); 610 active listings in the ZIP; 17 comparable units currently listed for rent nearby; rentals at typical pace (median 22d on market — plan ~3-4 weeks tenant-placement turnaround); solid renter incomes; 1,876 units permitted in Clay County in 2024 (14 in 5+ unit buildings).
Forward outlook
- Local home prices are declining (-3.0%/yr); year-one equity from $2k of loan paydown is wiped out by about $8k of value loss. Plan a longer hold.
- Clay County population projected at +19% by 2050 — long-run rental-demand tailwind backs the buy-and-hold thesis.
Negotiation context
- It's been on market 34 days — a 3% lower offer ($259k) is reasonable based on typical stale-listing flexibility.
- 2 sale attempts with the ask held roughly flat each time — persistent listings suggest the price (not the market) is what's stuck; bring a comps-based counter.
Questions for the listing agent
- What do current leases actually rent for vs. the listed asking? Can we see a recent rent roll and the last 12 months of T-12 income?
- It's been on market 34 days. Have you received any prior offers? Is the seller open to a 25% concession, seller financing, or rate buy-down credit?
- What does the HOA fee cover, when was the last increase, and are there any pending special assessments or reserve-fund shortfalls?
- Is there a deadline driving the sale (1031 exchange, divorce, estate, relocation)? That informs how much negotiation room exists.
- Schools are B-rated — typically a magnet for longer-tenancy family renters. What's the average tenant stay here, and is there a school-zone premium baked into asking?
- The area grade is low — what's the realistic commute time and amenity access for the typical tenant pool here? Any planned neighborhood developments (good or bad) we should know about?
- What's the average days-on-market for RENTAL listings here right now (not sales)? A rising rental-DOM trend means longer vacancies and softer asking-rent achievability than the comps imply.
- What's the recent tenant-quality profile in this submarket — average credit score on applications, eviction rate, late-payment / NSF rate, and stable-employment percentage? A property-management company in the area should have these aggregated.
- How much new for-sale + rental construction is in the pipeline within 1–3 miles? Heavy new supply typically softens prices + rents 12–24 months out; constrained supply supports both.
Investment metrics
- 1% rule
- 0.75% ✗
- Cap rate
- 4.59%
- Cash-on-cash
- -6.10%
- DSCR
- 0.73
- GRM
- 11.1
CMA / ARV
No comps found within radius.
Projected returns pro-forma
-3.0% appreciation · 3.35% rent growth · sell at horizon
- IRR
- -26.3%
- Equity multiple
- 0.11×
- Total profit
- $-66,767
- Equity at exit
- $39,884
- IRR
- -22.0%
- Equity multiple
- -0.15×
- Total profit
- $-85,975
- Equity at exit
- $23,128
Cash invested: $74,897 (down + closing). Projections, not guarantees.
Landlord ↔ Tenant lean methodology
- Overall (STATE)
- 87 Strongly Landlord-Friendly
- State Florida
- 87 Strongly Landlord-Friendly · R+3
- County
- — inherits STATE
- City
- — inherits STATE
ZIP-level market 32068
- Home prices YoY
- -27.5%
- Rents YoY
- 3.4%
- Active inventory
- 610
- Price-to-rent
- 11.1×
Monthly cashflow live
- Estimated rent
- $2,016 high interval (Pro) →
- Mortgage (P&I)
- −$1,403
- Tax est. 1.5%
- −$334 /mo · $4,012/yr
- Insurance
- −$111
- HOA
- −$125
- Vacancy / Maint / Mgmt
- −$423
- Net cashflow
- $-381
Break-even live
Sensitivity live
| Price | -10% $-196 | -5% $-288 | +0% $-381 | +5% $-473 | +10% $-565 |
|---|---|---|---|---|---|
| Rent | -10% $-540 | -5% $-460 | +0% $-381 | +5% $-301 | +10% $-221 |
| Rate | -1.0pp $-246 | -0.5pp $-313 | base $-381 | +0.5pp $-450 | +1.0pp $-520 |
UW: 25.0% down · 7.5% · 30yr · 1.5% tax · 5.0% vac · 8.0% maint · 8.0% mgmt
Financing live
Cash to close
- Down payment
- $66,872
- Closing costs
- $8,025
- Reserves months
- —
- Total cash needed
- —
Loan-product check · same deal, 3 products live
Conventional
25% down · 7.5% · 30yr
- Down + closing
- —
- Monthly P&I
- —
- Monthly cashflow
- —
- DSCR
- —
- Eligible?
- —
Personal DTI + credit; lowest rate.
DSCR
20% down · 8.5% · 30yr
- Down + closing
- —
- Monthly P&I
- —
- Monthly cashflow
- —
- DSCR
- —
- Eligible?
- —
No personal income docs; deal must DSCR.
Hard money
10% down · 12.0% · 12mo
- Down + closing
- —
- Monthly P&I
- —
- Monthly cashflow
- —
- DSCR
- —
- Eligible?
- —
Short-term bridge; refi at stabilization.
Rent comps 17 comps
| Address | Beds | Baths | Sqft | Rent | $/sqft | DOM | Units | Dist |
|---|---|---|---|---|---|---|---|---|
| 1633 Bridger Trce Middleburg, FL | 3.0 | 2.5 | 1502 | $1,900 | $1.26 | 25d | 1 | 0.06mi |
| 1685 Bridger Trce Middleburg, FL | 2.0 | 2.5 | 1210 | $1,900 | $1.57 | 25d | 1 | 0.09mi |
| 1469 Jeremiah St Middleburg, FL | 3.0 | 2.5 | 1468 | $2,000 | $1.36 | 25d | 1 | 0.13mi |
| 1568 Backwater Dr Middleburg, FL | 3.0 | 2.0 | 1594 | $1,895 | $1.19 | 25d | 1 | 0.57mi |
| 1953 Longneedle Ln Middleburg, FL | 4.0 | 2.0 | 1564 | $1,965 | $1.26 | 19d | 1 | 0.60mi |
| 3640 Alec Dr Middleburg, FL | 3.0 | 2.0 | 1178 | $1,710 | $1.45 | 3d | 1 | 0.61mi |
| 3437 Talisman Dr Middleburg, FL | 3.0 | 2.0 | 1303 | $1,779 | $1.37 | 12d | 1 | 0.70mi |
| 3413 Alec Dr Middleburg, FL | 3.0 | 2.0 | 1312 | $1,711 | $1.30 | 22d | 1 | 0.70mi |
| 1809 Penzance Pkwy Middleburg, FL | 3.0 | 2.0 | 1708 | $2,100 | $1.23 | 6d | 1 | 0.83mi |
| 1854 Alberta Ct N Middleburg, FL | 3.0 | 2.0 | 1190 | $1,775 | $1.49 | 25d | 1 | 1.07mi |
| 3861 Baxley Villas Ct Middleburg, FL | 3.0 | 2.5 | 1604 | $2,000 | $1.25 | 16d | 1 | 1.11mi |
| 1871 Alberta Ct S Middleburg, FL | 3.0 | 2.0 | 1524 | $1,720 | $1.13 | 25d | 1 | 1.13mi |
| 1976 Hunters Trace Cir Middleburg, FL | 3.0 | 2.0 | 1576 | $1,880 | $1.19 | 3d | 1 | 1.16mi |
| 1608 Twin Oak Dr W Middleburg, FL | 3.0 | 2.0 | 1272 | $1,845 | $1.45 | 3d | 1 | 1.23mi |
| 1250 Hillpointe Cir Middleburg, FL | 2.0 | 2.0 | 1170 | $1,636 | $1.40 | 4d | 5 | 1.23mi |
| 3248 Dowitcher Ln Orange Park, FL | 3.0 | 2.0 | 1156 | $1,550 | $1.34 | 25d | 1 | 1.26mi |
| 3223 Merganzer Trl Orange Park, FL | 3.0 | 2.0 | 1155 | $1,755 | $1.52 | 25d | 1 | 1.35mi |
HOA detail
- Monthly dues
- $125 · $1,500/yr
Listing history 6 events
-
2026-03-25status Pending
-
2026-03-16price $267,490
-
2026-03-10status Active
-
2026-03-10price $274,990
-
2026-02-16status Pending
-
2026-01-28$275,990 Active
ⓘ Source: listings_history table (triggers on properties + properties_extension) + one-shot
backfill from property_details.listing_events for pre-trigger history.
Nearby sold comps map
Loading sold comps map…
Walkable amenities ~0.75 mi
Loading nearby amenities…
Taxation est. · year 1
- Rental income
- $24,197
- − Mortgage interest
- −$14,984
- − Property taxes
- −$4,012
- − Insurance
- −$1,337
- − Repairs & maintenance
- −$1,936
- − Management
- −$1,936
- − HOA
- −$1,500
- − Depreciation
- −$7,782
- Taxable loss
- −$9,290
- Est. tax savings @ 24.0%
- +$2,230
- After-tax cash flow
- $-2,338/yr
For passive investors: Depreciation is non-cash, so a rental often shows a tax loss while cash-flowing — sheltering income. Rental losses are passive: they offset passive income freely, and up to $25,000/yr can offset ordinary (W-2) income if you actively participate and your MAGI is under $100k (phasing out to $0 by $150k); unused losses carry forward. On sale, claimed depreciation is recaptured at up to 25%, and gains may owe capital-gains tax (a 1031 exchange can defer both). Figures are a year-1 estimate at your 24.0% rate — not tax advice; consult a CPA.
Schools (NCES district)
- District
- Clay
- NCES district ID
- 1200300
- Math proficiency
- 58% ▼ -8.00%
- Reading proficiency
- 59% ▼ -3.00%
- Median HH income
- $59,379
- Composite
- 50.73/100
- National rank
- #1815
- State rank
- #14 of 73 in FL
Livability — Lakeside
- Score
- 68/100
- State rank
- #505
- US rank
- #9341
Category grades
Schools grade is shown separately in the Schools card above.
Census & demographics
- County
- Clay County · 208,450 people
- Metro
- Jacksonville, FL
- Population (ZIP)
- 58,983
- Household income
- $84,431
- Rent vs Own
- Severe rent burden
- 975.0
Population outlook (Clay County) Hauer SSP2
- Today (2025)
- 230,495 people
- By 2030
- 242,427 · +5.2%
- By 2040
- 262,244 · +13.8%
- By 2050
- 275,148 · +19.4%
- By 2075
- 295,397 · +28.2%
- By 2100
- 287,592 · +24.8%
Race, ethnicity, and origin ACS 2023
- Neighborhood character
- Predominantly White (74%)
- Race & ethnicity
- White 74% Hispanic / Latino 13% Two or more races 10% Black 7%
- Hispanic origin (detail)
- Mexican 2% Puerto Rican 5%
- Common ancestry
- Slovak 2% Romanian 2% Lithuanian 2%
- Foreign-born
- 7% · Canada, Jamaica
- Languages at home
- 87% English-only · Spanish 9% Arabic 1% German/W. Germanic 1%
Political lean MEDSL · Clay
- 2024 margin
- Solid R (+39.3) · D 29.9% · R 69.2%
- 2008→2024 swing
- +3.6pp toward D · 2008: -42.8pp · 2024: -39.3pp
- All cycles
- 2024: R+39.3 2020: R+37.1 2016: R+44.3 2012: R+45.8 2008: R+42.8
Not yet ingested
- Civics
- —
Market trends
- HPI YoY
- ▼ -115.99%
- Current HPI
- 305.2531
- Rent YoY
- ▲ 3.35%
- Metro
- Jacksonville, FL
- State GDP YoY
- ▲ 3.28%
- F500 in state
- 36
Industry mix (Fortune 500 HQ in FL)
| Industry | F500 HQs | Revenue |
|---|---|---|
| Industrial Technology | 2 | $29B |
|
||
| Insurance | 2 | $17B |
|
||
| Retail | 1 | $60B |
|
||
| Technology Distribution | 1 | $58B |
|
||
| Homebuilding | 1 | $35B |
|
||
| Technology Manufacturing | 1 | $35B |
|
||
Price history
-3.1% since first listed6 events — show timeline
- 2026-03-25 Pending — realMLS
- 2026-03-16 Price Changed $267,490 realMLS
- 2026-03-10 Relisted — realMLS
- 2026-03-10 Price Changed $274,990 realMLS
- 2026-02-16 Pending — realMLS
- 2026-01-28 Listed $275,990 realMLS
Property tax history
+49.3%/yrLatest (2025): $448 · +49.3% YoY. Source: county tax records.
Cash-flow waterfall
monthlySold comps — $/sqft
last 12 mo · ≤1 miLoading sold comps…