 🏷️ Likely Rental
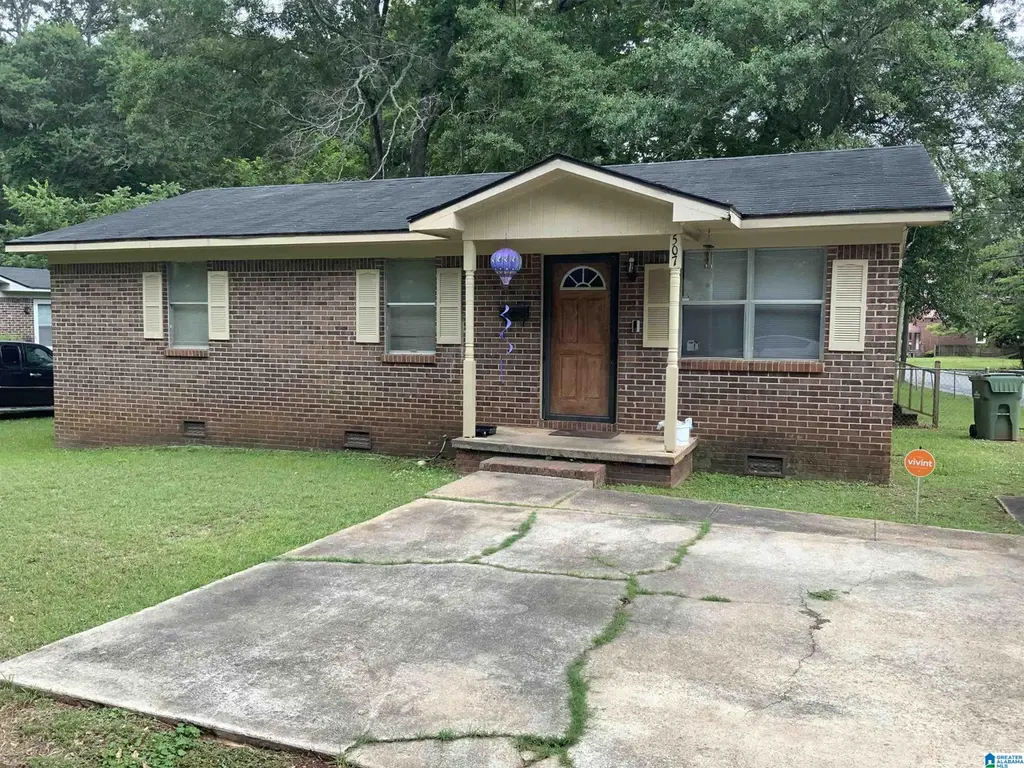
507 N 16th St · Lanett, AL
Flood risk 1/10 · Minimal
- FEMA flood zone
- X (unshaded)
- Chance of flooding over 30 yrs
- 0.0%
- Est. flood insurance / yr
- $507 – $1,088
Fire risk 2/10 · Minimal
- Est. fire insurance / yr
- $916 – $1,700
Heat risk 6/10 · Moderate
- Hot days now (above 106°F)
- 7 days/yr
- Hot days in 30 yrs
- 19 days/yr
Wind risk 6/10 · Moderate
- Chance of severe wind over 30 yrs
- 59.0%
Air-quality risk 3/10 · Minor
- Unhealthy air days now
- 3 days/yr
- Unhealthy air days in 30 yrs
- 4 days/yr
Risk factors via First Street. Map © Google.
Why this score? — see what drove the B grade
The composite is a weighted blend of 9 inputs, each scored 0–100. Each bar is that input's sub-score; the figure is the points it added to the 100-point composite (weight × sub-score).
- Cash flow +30.0/30.0
- ARV discount +15.0/15.0
- DSCR +10.0/10.0
- 1% rule +9.5/10.0
- Livability +3.0/5.0
- Rent growth +2.5/5.0
- Condition / age +2.5/5.0
- Schools +0.9/10.0
- Appreciation +0.0/10.0
$90,000
🖨 Deal sheet (PDF) 📄 Offer letter ✓ Due diligence
Listing remarks
Great Investment Opportunity – Tenant-Occupied & Cash Flowing! Welcome to this well-maintained income-producing property, perfect for investors! This home is tenant-occupied with reliable tenants who pay on time, providing immediate rental income from day one. The interior is very clean and well cared for, and the home features a new roof installed in 2017, adding long-term value and peace of mind. This property has a strong rental history and generates positive cash flow, making it an excellent addition to any investment portfolio. Priced to sell—don’t miss this opportunity to own a solid rental property with steady income potential!
Key facts
- 10640 acre lot
- Built 1980
- Listed 37 days
Property features AI
Finance
- Other: Property located in the A P Lee subdivision; Parcel ID: 12-10-06-24-3-007-016.000; Lot acreage value present in data (10640) but excluded per instructions
Exterior
- Parking: Driveway parking
- Security: No security features listed
- Utilities: Public water; Septic system; Electric water heater; Internet availability unknown
- Home design: Existing construction; Four-sided brick exterior
- Construction: Slab foundation
- Exterior features: Not waterfront; No pool, patio, decks, or garden/patio reported
Interior
- Kitchen: Solid surface countertops
- Bedrooms: Three bedrooms on the main level
- Flooring: Carpet floors
- Bathrooms: One full bathroom with garden tub
- Heating & cooling: Central heating; Central cooling
- Interior features: Ceilings: Other (see remarks); No additional interior features listed
- Laundry & utility: Main-level laundry with washer hookup and electric dryer hookup; Laundry space described as 'Other (see remarks)'
Neighborhood map
What this means for you Summary
Snapshot
- This is a 3-bed/1.0-bath single-family listed at $90k.
Deal economics
- At list price, monthly cash flow is $492 ($6k/yr) — positive.
- The deal already cash-flows at list — no discount required.
- Meets the 1% rule at list price ($1k rent vs $90k).
- Recommended offer: $87k (3.0% below list) — sets the bar for market timing.
- Cap rate 12.9% vs local median 5.8% in Lanett — top-decile yield for the area; either an underpriced asset or a hidden risk that comps aren't pricing in. Stress-test before assuming the spread holds.
Location & tenants
- Location reads 60/100 on livability (#301 in AL) — a middle-class / working-renter tenant base. Strengths: cost of living A+, housing A+; Watch: crime F, amenities F, commute F.
- Lanett City (town): math 5% / reading 19% proficiency, ranked #117 of 129 in AL (top 91%) — low school quality limits family demand, transient renter base, plan for 1-2y turnover; 87% free/reduced lunch — lower-income household profile, screen leases tightly.
- Zoned schools: Lanett Senior High School (math 5% / reading 5%, grade F, #276 of 305 statewide, top 95%, 235 students, 94% FRL).
- Market conditions: 95 active listings in the ZIP; 4 comparable units currently listed for rent nearby; rentals at typical pace (median 22d on market — plan ~3-4 weeks tenant-placement turnaround); 43 units permitted in Chambers County in 2024 (0 in 5+ unit buildings).
Forward outlook
- Local home prices are declining (-3.0%/yr); year-one equity from $622 of loan paydown is wiped out by about $3k of value loss. Plan a longer hold.
- Chambers County population projected to shrink 7% by 2050 — rents likely to lag national; underwrite the cash flow, not the appreciation.
- At projected returns (-3.0% appreciation + 3.0% rent growth), your $25k cash investment doubles in ~6 years — after that, you're playing with house money.
Negotiation context
- It's been on market 38 days — a 3% lower offer ($87k) is reasonable based on typical stale-listing flexibility.
Risks & watch-outs
- Climate carrying-cost: major wind risk, 59% chance of damaging wind over 30y; extreme-heat days projected 7→19/yr by 2055 (HVAC capex compounding) — expect insurance premiums to compound above CPI over the hold.
Questions for the listing agent
- It's been on market 38 days. Have you received any prior offers? Is the seller open to a 3% concession, seller financing, or rate buy-down credit?
- Is there a deadline driving the sale (1031 exchange, divorce, estate, relocation)? That informs how much negotiation room exists.
- Schools are F-rated, which usually means shorter tenancies and higher turnover. Who's the typical renter profile here, and what's been the actual vacancy rate?
- Crime grade is F in this area — have there been break-ins, vandalism, or insurance claims at this property in the last 3 years? What carrier currently insures it and at what premium?
- What's the average days-on-market for RENTAL listings here right now (not sales)? A rising rental-DOM trend means longer vacancies and softer asking-rent achievability than the comps imply.
- What's the recent tenant-quality profile in this submarket — average credit score on applications, eviction rate, late-payment / NSF rate, and stable-employment percentage? A property-management company in the area should have these aggregated.
- How much new for-sale + rental construction is in the pipeline within 1–3 miles? Heavy new supply typically softens prices + rents 12–24 months out; constrained supply supports both.
Investment metrics
- 1% rule
- 1.45% ✓
- Cap rate
- 12.86%
- Cash-on-cash
- 23.44%
- DSCR
- 2.04
- GRM
- 5.7
CMA / ARV
- ARV (median comp)
- $134,545
- List price
- $90,000
- Delta
- -33.11%
- Verdict
- UNDERPRICED
- Comps
- 20 within 1.0 mi
Show comp detail 6 sales within ~0.75 mi
| Address | Dist | Beds/Ba | Sqft | Sold | Price | $/sf | Match |
|---|---|---|---|---|---|---|---|
| 403 N 15th St | 0.15mi | 3/1.0 | 1,084 (-1%) | 2mo | $32,500 | $30 | 90 |
| 909 N 13th St | 0.38mi | 3/1.0 | 1,075 (-2%) | 4mo | $167,000 | $155 | 75 |
| 502 N 15th St | 0.08mi | 3/1.5 | 1,046 (-5%) | 19mo | $153,750 | $147 | 71 |
| 811 Cherry Dr | 0.52mi | 3/2.0 | 1,144 (+4%) | 1mo | $208,000 | $182 | 64 |
| 810 N 17th St | 0.25mi | 3/2.0 | 1,260 (+15%) | 14mo | $192,000 | $152 | 48 |
| 511 N 5th St | 0.54mi | 2/1.0 (-1) | 1,156 (+6%) | 24mo | $25,500 | $22 | 41 |
Match score weights: distance 35% · size 25% · config 20% · recency 20%. Top-matched comps best support the ARV.
Projected returns pro-forma
-3.0% appreciation · 3.0% rent growth · sell at horizon
- IRR
- 16.5%
- Equity multiple
- 1.66×
- Total profit
- $16,743
- Equity at exit
- $13,419
- IRR
- 25.0%
- Equity multiple
- 3.18×
- Total profit
- $54,833
- Equity at exit
- $7,782
Cash invested: $25,200 (down + closing). Projections, not guarantees.
Landlord ↔ Tenant lean methodology
- Overall (STATE)
- 90 Strongly Landlord-Friendly
- State Alabama
- 90 Strongly Landlord-Friendly · R+15
- County
- — inherits STATE
- City
- — inherits STATE
ZIP-level market 36863
- Home prices YoY
- -29.1%
- Active inventory
- 95
- Price-to-rent
- 5.7×
Monthly cashflow live
- Estimated rent
- $1,308 medium interval (Pro) →
- Mortgage (P&I)
- −$472
- Tax from tax record
- −$31 /mo · $377/yr
- Insurance
- −$38
- HOA
- −$0
- Vacancy / Maint / Mgmt
- −$275
- Net cashflow
- $492
Break-even live
Sensitivity live
| Price | -10% $543 | -5% $518 | +0% $492 | +5% $467 | +10% $441 |
|---|---|---|---|---|---|
| Rent | -10% $389 | -5% $441 | +0% $492 | +5% $544 | +10% $596 |
| Rate | -1.0pp $538 | -0.5pp $515 | base $492 | +0.5pp $469 | +1.0pp $445 |
UW: 25.0% down · 7.5% · 30yr · 1.5% tax · 5.0% vac · 8.0% maint · 8.0% mgmt
Financing live
Cash to close
- Down payment
- $22,500
- Closing costs
- $2,700
- Reserves months
- —
- Total cash needed
- —
Loan-product check · same deal, 3 products live
Conventional
25% down · 7.5% · 30yr
- Down + closing
- —
- Monthly P&I
- —
- Monthly cashflow
- —
- DSCR
- —
- Eligible?
- —
Personal DTI + credit; lowest rate.
DSCR
20% down · 8.5% · 30yr
- Down + closing
- —
- Monthly P&I
- —
- Monthly cashflow
- —
- DSCR
- —
- Eligible?
- —
No personal income docs; deal must DSCR.
Hard money
10% down · 12.0% · 12mo
- Down + closing
- —
- Monthly P&I
- —
- Monthly cashflow
- —
- DSCR
- —
- Eligible?
- —
Short-term bridge; refi at stabilization.
Rent comps 4 comps
| Address | Beds | Baths | Sqft | Rent | $/sqft | DOM | Units | Dist |
|---|---|---|---|---|---|---|---|---|
| 813 3rd Ave Unit K West Point, GA | 2.0 | 2.5 | 1100 | $1,200 | $1.09 | 21d | 1 | 0.43mi |
| 500 E 7th St West Point, GA | 3.0 | 2.0 | 1308 | $1,600 | $1.22 | 21d | 1 | 1.03mi |
| 505 E 5th St West Point, GA | 3.0 | 1.0 | 1354 | $1,295 | $0.96 | 21d | 1 | 1.12mi |
| 808 S 10th St Lanett, AL | 3.0 | 2.0 | 1340 | $1,350 | $1.01 | 14d | 1 | 1.40mi |
Listing history 17 events
-
2026-06-19days on market $90,000 Active 38 DOM
-
2026-06-18days on market $90,000 Active 37 DOM
-
2026-06-17days on market $90,000 Active 36 DOM
-
2026-06-16days on market $90,000 Active 35 DOM
-
2026-06-15days on market $90,000 Active 34 DOM
-
2026-06-14days on market $90,000 Active 32 DOM
-
2026-06-12days on market $90,000 Active 31 DOM
-
2026-06-09days on market $90,000 Active 28 DOM
-
2026-06-08days on market $90,000 Active 27 DOM
-
2026-06-07days on market $90,000 Active 26 DOM
-
2026-06-07days on market $90,000 Active 25 DOM
-
2026-06-04days on market $90,000 Active 22 DOM
-
2026-06-02days on market $90,000 Active 21 DOM
-
2026-06-01days on market $90,000 Active 20 DOM
-
2026-05-31days on market $90,000 Active 19 DOM
-
2026-05-31days on market $90,000 Active 18 DOM
-
2026-05-12$90,000 Active 33-char remark
ⓘ Source: listings_history table (triggers on properties + properties_extension) + one-shot
backfill from property_details.listing_events for pre-trigger history.
Tax reassessment forecast AL · Resets to sale price
- Current annual tax
- $377 · $31/mo
- Projected year-2 tax
- $377 · $31/mo
- Expected delta
- $0/yr ($0/mo · 0.0%)
ⓘ Screening estimate from a state-policy table — verify with the county assessor before closing.
Climate risk First Street
- Flood 1/10 Low FEMA zone X (unshaded) · 0% chance over 30 yrs
- Wildfire 2/10 Low
- Heat 6/10 Major 7 d/yr ≥106°F today · 19 d/yr by 30 yrs out
- Wind 6/10 Major 59% chance of damaging wind over 30 yrs
- Air quality 3/10 Moderate 3 unhealthy d/yr today · 4 by 30 yrs out
Nearby sold comps map
Loading sold comps map…
Walkable amenities ~0.75 mi
Loading nearby amenities…
Taxation est. · year 1
- Rental income
- $15,694
- − Mortgage interest
- −$5,041
- − Property taxes
- −$377
- − Insurance
- −$450
- − Repairs & maintenance
- −$1,256
- − Management
- −$1,256
- − Depreciation
- −$2,618
- Taxable income
- $4,697
- Est. tax owed @ 24.0%
- −$1,127
- After-tax cash flow
- $4,781/yr
For passive investors: Depreciation is non-cash, so a rental often shows a tax loss while cash-flowing — sheltering income. Rental losses are passive: they offset passive income freely, and up to $25,000/yr can offset ordinary (W-2) income if you actively participate and your MAGI is under $100k (phasing out to $0 by $150k); unused losses carry forward. On sale, claimed depreciation is recaptured at up to 25%, and gains may owe capital-gains tax (a 1031 exchange can defer both). Figures are a year-1 estimate at your 24.0% rate — not tax advice; consult a CPA.
Schools (NCES district)
- District
- Lanett City
- NCES district ID
- 0101980
- Math proficiency
- 5% ▼ -19.00%
- Reading proficiency
- 19% ▼ -4.00%
- Median HH income
- $27,834
- Composite
- 9.11/100
- National rank
- #9866
- State rank
- #117 of 129 in AL
Livability — Lanett
- Score
- 60/100
- State rank
- #301
- US rank
- #19159
Category grades
Schools grade is shown separately in the Schools card above.
Census & demographics
- Census place
- Lanett, AL
- Population (ZIP)
- 12,335
Population outlook (Chambers County) Hauer SSP2
- Today (2025)
- 33,868 people
- By 2030
- 33,504 · -1.1%
- By 2040
- 32,594 · -3.8%
- By 2050
- 31,422 · -7.2%
- By 2075
- 29,054 · -14.2%
- By 2100
- 25,431 · -24.9%
Race, ethnicity, and origin ACS 2023
- Neighborhood character
- Diverse neighborhood (Simpson 0.58)
- Race & ethnicity
- White 46% Black 45% Hispanic / Latino 6% Two or more races 3%
- Hispanic origin (detail)
- Mexican 3%
- Common ancestry
- Serbian 1%
- Foreign-born
- 5% · Canada, South Korea
- Languages at home
- 95% English-only · Spanish 4% Other Indo-European 1%
Political lean MEDSL · Chambers
- 2024 margin
- Strong R (+23.2) · D 38.0% · R 61.2%
- 2008→2024 swing
- -14.8pp toward R · 2008: -8.5pp · 2024: -23.2pp
- All cycles
- 2024: R+23.2 2020: R+15.6 2016: R+14.8 2012: R+5.1 2008: R+8.5
Not yet ingested
- Civics
- —
Market trends
- HPI YoY
- ▼ -63.32%
- Current HPI
- 154.4174
- Rent YoY
- —
- Metro
- —
- State GDP YoY
- ▲ 2.94%
- F500 in state
- 4
Industry mix (Fortune 500 HQ in AL)
| Industry | F500 HQs | Revenue |
|---|---|---|
| Financial Services | 1 | $8B |
|
||
| Healthcare | 1 | $5B |
|
||
Price history
1 event — show timeline
- 2026-05-12 Listed $90,000 Greater Alabama MLS
Property tax history
+4.2%/yrLatest (2025): $377 · +0.3% YoY. Source: county tax records.
Cash-flow waterfall
monthlySold comps — $/sqft
last 12 mo · ≤1 miLoading sold comps…