 🏷️ Likely Rental
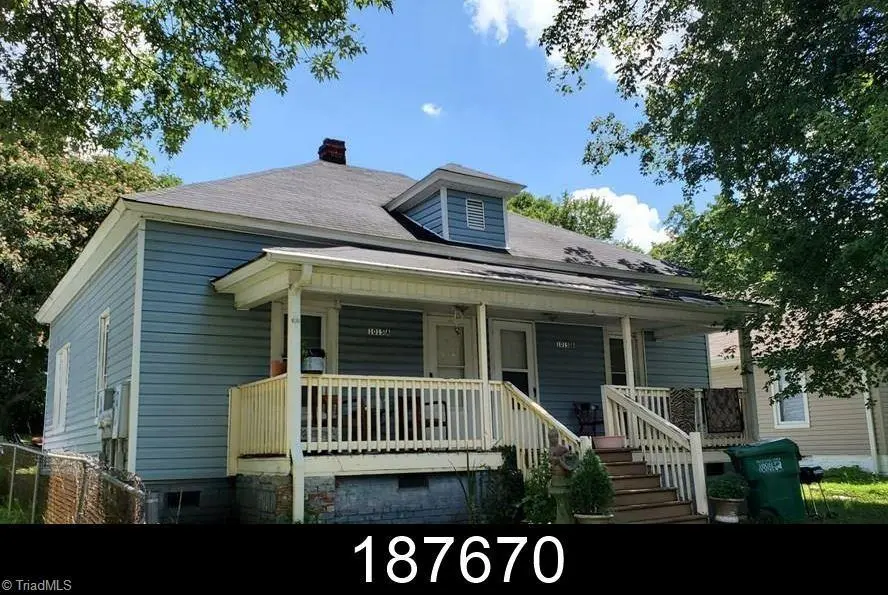
1015 Adams St · High Point, NC
Flood risk 1/10 · Minimal
- FEMA flood zone
- X (unshaded)
- Chance of flooding over 30 yrs
- 0.0%
- Est. flood insurance / yr
- $507 – $1,088
Fire risk 1/10 · Minimal
- Est. fire insurance / yr
- $906 – $1,684
Heat risk 5/10 · Moderate
- Hot days now (above 104°F)
- 7 days/yr
- Hot days in 30 yrs
- 17 days/yr
Wind risk 4/10 · Minor
- Chance of severe wind over 30 yrs
- 14.0%
Air-quality risk 2/10 · Minimal
- Unhealthy air days now
- 1 days/yr
- Unhealthy air days in 30 yrs
- 1 days/yr
Risk factors via First Street. Map © Google.
Why this score? — see what drove the B+ grade
The composite is a weighted blend of 9 inputs, each scored 0–100. Each bar is that input's sub-score; the figure is the points it added to the 100-point composite (weight × sub-score).
- Cash flow +30.0/30.0
- ARV discount +15.0/15.0
- DSCR +10.0/10.0
- 1% rule +9.7/10.0
- Livability +3.9/5.0
- Schools +3.6/10.0
- Rent growth +2.7/5.0
- Condition / age +2.5/5.0
- Appreciation +0.0/10.0
$90,000
🖨 Deal sheet (PDF) 📄 Offer letter ✓ Due diligence
Listing remarks MLS
Investor Special!! Long term tenants in this Duplex, 1 bed 1 bath on each side. Great opportunity to add this to your rental portfolio. Tenants are on a month to month but are willing to stay. Updated in 2013, roof, electric, plumbing, and floors. Currently rented for $525. Potential rent for both units $800!
Key facts
- 8,712 sq ft lot
- Built 1920
Property features AI
Finance
- Other: Property located in Greensboro association area (no membership)
- HOA & community: No association
Exterior
- Parking: Driveway
- Utilities: Public sewer; Electric water heater
- Home design: Duplex residential income property; Built in 1920
- Construction: Electric water heater
- Exterior features: Public water; No pool
Interior
- Heating & cooling: No heating; No cooling; No fuel for heating
- Interior features: No basement
Neighborhood map
What this means for you Summary
Snapshot
- This is a 2-bed/2.0-bath single-family listed at $90k.
Deal economics
- At list price, monthly cash flow is $495 ($6k/yr) — positive.
- The deal already cash-flows at list — no discount required.
- Meets the 1% rule at list price ($1k rent vs $90k).
- Cap rate 12.9% vs local median 4.0% in High Point — top-decile yield for the area; either an underpriced asset or a hidden risk that comps aren't pricing in. Stress-test before assuming the spread holds.
Location & tenants
- Location reads 77/100 on livability (#31 in NC, #3,084 nationally) — a middle-class / working-renter tenant base. Strengths: commute A+, cost of living A+, housing A+; Watch: amenities D, employment D, crime F.
- Guilford County Schools (urban): math 39% / reading 45% proficiency, ranked #99 of 178 in NC (top 56%) — families likely to look elsewhere, expect single-tenant / working-renter base with shorter leases.
- Zoned schools: Northwood Elementary (math 28% / reading 27%, grade F, #1,028 of 1,410 statewide, top 73%, 469 students, 99% FRL); Ferndale Middle (math 16% / reading 32%, grade F, #401 of 475 statewide, top 84%, 537 students, 99% FRL); High Point Central High (math 48% / reading 42%, grade D-, #350 of 535 statewide, top 66%, 1,081 students, 100% FRL) — zoned schools average 100% FRL vs 52% district-wide (47 pts higher); higher-poverty schools than district average — tighter screening recommended.
- Market conditions: Rents flat; 124 active listings in the ZIP; 8 comparable units currently listed for rent nearby; rentals at typical pace (median 25d on market — plan ~3-4 weeks tenant-placement turnaround); 3,843 units permitted in Guilford County in 2024 (2,397 in 5+ unit buildings).
Forward outlook
- Local home prices are declining (-3.0%/yr); year-one equity from $622 of loan paydown is wiped out by about $3k of value loss. Plan a longer hold.
- Guilford County population projected at +26% by 2050 — long-run rental-demand tailwind backs the buy-and-hold thesis.
- At projected returns (-3.0% appreciation + 0.9% rent growth), your $25k cash investment doubles in ~6 years — after that, you're playing with house money.
Negotiation context
- Only 1 days on market — expect competitive offers; lowballing is unlikely to land.
- 3 sale attempts since 6y ago with the ask held roughly flat each time — persistent listings suggest the price (not the market) is what's stuck; bring a comps-based counter.
- Current owner paid $48k; list at $90k implies a 88% gain — meaningful room to come down on a strong offer.
Risks & watch-outs
- Watch-outs: built in 1920 — expect roof / HVAC / electrical / plumbing capex.
- Climate carrying-cost: extreme-heat days projected 7→17/yr by 2055 (HVAC capex compounding) — expect insurance premiums to compound above CPI over the hold.
Questions for the listing agent
- Built in 1920 — when were the roof, HVAC, electrical panel, plumbing, and water heater last replaced?
- Is there a deadline driving the sale (1031 exchange, divorce, estate, relocation)? That informs how much negotiation room exists.
- Schools are D-rated, which usually means shorter tenancies and higher turnover. Who's the typical renter profile here, and what's been the actual vacancy rate?
- Crime grade is F in this area — have there been break-ins, vandalism, or insurance claims at this property in the last 3 years? What carrier currently insures it and at what premium?
- What's the average days-on-market for RENTAL listings here right now (not sales)? A rising rental-DOM trend means longer vacancies and softer asking-rent achievability than the comps imply.
- What's the recent tenant-quality profile in this submarket — average credit score on applications, eviction rate, late-payment / NSF rate, and stable-employment percentage? A property-management company in the area should have these aggregated.
- How much new for-sale + rental construction is in the pipeline within 1–3 miles? Heavy new supply typically softens prices + rents 12–24 months out; constrained supply supports both.
Investment metrics
- 1% rule
- 1.47% ✓
- Cap rate
- 12.90%
- Cash-on-cash
- 23.59%
- DSCR
- 2.05
- GRM
- 5.7
CMA / ARV
- ARV (on-the-fly)
- $179,316
- Comps found
- 12
Show comp detail 12 sales within ~0.75 mi
| Address | Dist | Beds/Ba | Sqft | Sold | Price | $/sf | Match |
|---|---|---|---|---|---|---|---|
| 209 Kennedy Ave | 0.17mi | 2/2.0 | 1,118 (-5%) | 5mo | $110,000 | $98 | 80 |
| 1205 Adams St | 0.19mi | 3/2.0 (+1) | 1,180 (+1%) | 11mo | $219,900 | $186 | 75 |
| 421 Gatewood Ave | 0.31mi | 2/1.0 | 1,129 (-4%) | 4mo | $215,000 | $190 | 72 |
| 1110 Adams St | 0.07mi | 3/1.0 (+1) | 1,278 (+9%) | 7mo | $125,000 | $98 | 67 |
| 602 Westwood Ave | 0.40mi | 3/2.0 (+1) | 1,240 (+6%) | 2mo | $205,500 | $166 | 65 |
| 113 Edgeworth St | 0.20mi | 3/1.0 (+1) | 1,224 (+4%) | 12mo | $95,000 | $78 | 65 |
| 1116 Raleigh Ct | 0.53mi | 3/2.0 (+1) | 1,180 (+1%) | 8mo | $180,000 | $153 | 63 |
| 523 Cross St | 0.66mi | 3/2.0 (+1) | 1,078 (-8%) | 6mo | $115,000 | $107 | 46 |
| 603 Quaker Ln | 0.43mi | 3/2.0 (+1) | 1,316 (+12%) | 14mo | $225,000 | $171 | 42 |
| 609 Cross St | 0.73mi | 3/1.5 (+1) | 1,050 (-10%) | 4mo | $115,122 | $110 | 39 |
| 312 W Ray Ave | 0.63mi | 3/1.0 (+1) | 1,284 (+10%) | 12mo | $190,000 | $148 | 36 |
| 1713 W Rotary Dr | 0.75mi | 3/2.5 (+1) | 1,290 (+10%) | 17mo | $215,000 | $167 | 27 |
Match score weights: distance 35% · size 25% · config 20% · recency 20%. Top-matched comps best support the ARV.
Projected returns pro-forma
-3.0% appreciation · 0.9% rent growth · sell at horizon
- IRR
- 14.4%
- Equity multiple
- 1.56×
- Total profit
- $14,208
- Equity at exit
- $13,419
- IRR
- 21.6%
- Equity multiple
- 2.67×
- Total profit
- $42,149
- Equity at exit
- $7,782
Cash invested: $25,200 (down + closing). Projections, not guarantees.
Landlord ↔ Tenant lean methodology
- Overall (STATE)
- 85 Strongly Landlord-Friendly
- State North Carolina
- 85 Strongly Landlord-Friendly · R+3
- County
- — inherits STATE
- City
- — inherits STATE
ZIP-level market 27262
- Rents YoY
- 0.9%
- Active inventory
- 124
- Price-to-rent
- 5.7×
Monthly cashflow live
- Estimated rent
- $1,319 high interval (Pro) →
- Mortgage (P&I)
- −$472
- Tax from tax record
- −$37 /mo · $444/yr
- Insurance
- −$38
- HOA
- −$0
- Vacancy / Maint / Mgmt
- −$277
- Net cashflow
- $495
Break-even live
Sensitivity live
| Price | -10% $546 | -5% $521 | +0% $495 | +5% $470 | +10% $444 |
|---|---|---|---|---|---|
| Rent | -10% $391 | -5% $443 | +0% $495 | +5% $547 | +10% $599 |
| Rate | -1.0pp $541 | -0.5pp $518 | base $495 | +0.5pp $472 | +1.0pp $448 |
UW: 25.0% down · 7.5% · 30yr · 1.5% tax · 5.0% vac · 8.0% maint · 8.0% mgmt
Financing live
Cash to close
- Down payment
- $22,500
- Closing costs
- $2,700
- Reserves months
- —
- Total cash needed
- —
Loan-product check · same deal, 3 products live
Conventional
25% down · 7.5% · 30yr
- Down + closing
- —
- Monthly P&I
- —
- Monthly cashflow
- —
- DSCR
- —
- Eligible?
- —
Personal DTI + credit; lowest rate.
DSCR
20% down · 8.5% · 30yr
- Down + closing
- —
- Monthly P&I
- —
- Monthly cashflow
- —
- DSCR
- —
- Eligible?
- —
No personal income docs; deal must DSCR.
Hard money
10% down · 12.0% · 12mo
- Down + closing
- —
- Monthly P&I
- —
- Monthly cashflow
- —
- DSCR
- —
- Eligible?
- —
Short-term bridge; refi at stabilization.
Rent comps 8 comps
| Address | Beds | Baths | Sqft | Rent | $/sqft | DOM | Units | Dist |
|---|---|---|---|---|---|---|---|---|
| 1110 Adams St High Point, NC | 3.0 | 1.0 | 1278 | $1,340 | $1.05 | 25d | 1 | 0.08mi |
| 709 Langford Ave High Point, NC | 2.0 | 1.0 | 840 | $1,200 | $1.43 | 15d | 1 | 0.74mi |
| 208 W Parkway Ave Unit A High Point, NC | 1.0 | 1.0 | 750 | $1,500 | $2.00 | 25d | 1 | 0.87mi |
| 1009 Cassell St High Point, NC | 3.0 | 1.0 | 975 | $1,050 | $1.08 | 25d | 1 | 1.11mi |
| 313 4th St Unit B High Point, NC | 2.0 | 1.0 | 900 | $995 | $1.11 | 25d | 1 | 1.11mi |
| 2004 Edgewood Dr High Point, NC | 3.0 | 1.0 | 962 | $1,350 | $1.40 | 25d | 1 | 1.12mi |
| 205 Guilford Ave High Point, NC | 3.0 | 1.5 | 1255 | $1,350 | $1.08 | 20d | 1 | 1.19mi |
| 419 Hobson St High Point, NC | 3.0 | 1.0 | 840 | $1,150 | $1.37 | 25d | 1 | 1.22mi |
Listing history 10 events
-
2026-05-10status Pending
-
2026-05-09$90,000 Active
-
2020-09-16soldstatus $48,000 Closed 312-char remark
Show marketing remark (312 chars)
Investor Special!! Long term tenants in this Duplex, 1 bed 1 bath on each side. Great opportunity to add this to your rental portfolio. Tenants are on a month to month but are willing to stay. Updated in 2013, roof, electric, plumbing, and floors. Currently rented for $525. Potential rent for both units $800!
-
2020-09-16soldstatus $48,000
Show marketing remark (312 chars)
Investor Special!! Long term tenants in this Duplex, 1 bed 1 bath on each side. Great opportunity to add this to your rental portfolio. Tenants are on a month to month but are willing to stay. Updated in 2013, roof, electric, plumbing, and floors. Currently rented for $525. Potential rent for both units $800!
-
2020-09-03status Pending 312-char remark
Show marketing remark (312 chars)
Investor Special!! Long term tenants in this Duplex, 1 bed 1 bath on each side. Great opportunity to add this to your rental portfolio. Tenants are on a month to month but are willing to stay. Updated in 2013, roof, electric, plumbing, and floors. Currently rented for $525. Potential rent for both units $800!
-
2020-08-14status Active 312-char remark
Show marketing remark (312 chars)
Investor Special!! Long term tenants in this Duplex, 1 bed 1 bath on each side. Great opportunity to add this to your rental portfolio. Tenants are on a month to month but are willing to stay. Updated in 2013, roof, electric, plumbing, and floors. Currently rented for $525. Potential rent for both units $800!
-
2020-08-12status Pending 312-char remark
Show marketing remark (312 chars)
Investor Special!! Long term tenants in this Duplex, 1 bed 1 bath on each side. Great opportunity to add this to your rental portfolio. Tenants are on a month to month but are willing to stay. Updated in 2013, roof, electric, plumbing, and floors. Currently rented for $525. Potential rent for both units $800!
-
2020-07-28$55,000 Active 312-char remark
Show marketing remark (312 chars)
Investor Special!! Long term tenants in this Duplex, 1 bed 1 bath on each side. Great opportunity to add this to your rental portfolio. Tenants are on a month to month but are willing to stay. Updated in 2013, roof, electric, plumbing, and floors. Currently rented for $525. Potential rent for both units $800!
-
2018-07-28price $43,500
-
1987-12-01soldstatus $23,000
ⓘ Source: listings_history table (triggers on properties + properties_extension) + one-shot
backfill from property_details.listing_events for pre-trigger history.
Tax reassessment forecast NC · Resets to sale price
- Current annual tax
- $444 · $37/mo
- Projected year-2 tax
- $738 · $62/mo
- Expected delta
- +$294/yr (+$25/mo · 66.4%)
ⓘ Screening estimate from a state-policy table — verify with the county assessor before closing.
Climate risk First Street
- Flood 1/10 Low FEMA zone X (unshaded) · 0% chance over 30 yrs
- Wildfire 1/10 Low
- Heat 5/10 Major 7 d/yr ≥104°F today · 17 d/yr by 30 yrs out
- Wind 4/10 Moderate 14% chance of damaging wind over 30 yrs
- Air quality 2/10 Low 1 unhealthy d/yr today · 1 by 30 yrs out
Nearby sold comps map
Loading sold comps map…
Walkable amenities ~0.75 mi
Loading nearby amenities…
Taxation est. · year 1
- Rental income
- $15,824
- − Mortgage interest
- −$5,041
- − Property taxes
- −$444
- − Insurance
- −$450
- − Repairs & maintenance
- −$1,266
- − Management
- −$1,266
- − Depreciation
- −$2,618
- Taxable income
- $4,739
- Est. tax owed @ 24.0%
- −$1,137
- After-tax cash flow
- $4,806/yr
For passive investors: Depreciation is non-cash, so a rental often shows a tax loss while cash-flowing — sheltering income. Rental losses are passive: they offset passive income freely, and up to $25,000/yr can offset ordinary (W-2) income if you actively participate and your MAGI is under $100k (phasing out to $0 by $150k); unused losses carry forward. On sale, claimed depreciation is recaptured at up to 25%, and gains may owe capital-gains tax (a 1031 exchange can defer both). Figures are a year-1 estimate at your 24.0% rate — not tax advice; consult a CPA.
Schools (NCES district)
- District
- Guilford County Schools
- NCES district ID
- 3701920
- Math proficiency
- 39% ▲ 1.00%
- Reading proficiency
- 45% ▲ 1.00%
- Median HH income
- $46,315
- Composite
- 35.78/100
- National rank
- #4842
- State rank
- #99 of 178 in NC
Livability — High Point
- Score
- 77/100
- State rank
- #31
- US rank
- #3084
Category grades
Schools grade is shown separately in the Schools card above.
Census & demographics
- Census place
- High Point, NC
- County
- Guilford County · 487,190 people
- City population
- 102,450
- Metro
- Greensboro-High Point, NC
- Population (ZIP)
- 28,353
- Household income
- $65,006
- Rent vs Own
- Severe rent burden
- 1046.0
Population outlook (Guilford County) Hauer SSP2
- Today (2025)
- 584,596 people
- By 2030
- 616,851 · +5.5%
- By 2040
- 678,451 · +16.1%
- By 2050
- 734,788 · +25.7%
- By 2075
- 862,985 · +47.6%
- By 2100
- 948,704 · +62.3%
Race, ethnicity, and origin ACS 2023
- Neighborhood character
- Diverse neighborhood (Simpson 0.65)
- Race & ethnicity
- White 50% Black 30% Hispanic / Latino 12% Two or more races 7% Asian 4%
- Hispanic origin (detail)
- Mexican 8% Puerto Rican 1%
- Common ancestry
- Slovak 4% Italian 2% Lithuanian 1%
- Foreign-born
- 14% · Canada
- Languages at home
- 80% English-only · Spanish 10% Other Indo-European 5% Other Asian/Pacific 1%
Political lean MEDSL · Guilford
- 2024 margin
- Strong D (+21.8) · D 60.2% · R 38.4% · Other 1.4%
- 2008→2024 swing
- +3.5pp toward D · 2008: 18.4pp · 2024: 21.8pp
- All cycles
- 2024: D+21.8 2020: D+23.1 2016: D+20.0 2012: D+16.5 2008: D+18.4
Not yet ingested
- Civics
- —
Market trends
- HPI YoY
- ▼ -279.14%
- Current HPI
- 205.6152
- Rent YoY
- ▲ 0.90%
- Metro
- Greensboro-High Point, NC
- State GDP YoY
- ▲ 3.28%
- F500 in state
- 26
Industry mix (Fortune 500 HQ in NC)
| Industry | F500 HQs | Revenue |
|---|---|---|
| Financial Services | 2 | $213B |
|
||
| Retail | 2 | $95B |
|
||
| Industrial Conglomerate | 1 | $38B |
|
||
| Metals / Steel | 1 | $35B |
|
||
| Utilities | 1 | $30B |
|
||
| Industrial Machinery | 1 | $19B |
|
||
Price history
+291.3% since first listed10 events — show timeline
- 2026-05-10 Pending — Triad MLS
- 2026-05-09 Listed $90,000 Triad MLS
- 2020-09-16 Sold (Public Records) $48,000 Public Records
- 2020-09-16 Sold (MLS) $48,000 Triad MLS
- 2020-09-03 Pending — Triad MLS
- 2020-08-14 Relisted — Triad MLS
- 2020-08-12 Pending — Triad MLS
- 2020-07-28 Listed $55,000 Triad MLS
- 2018-07-28 Price Changed $43,500 Triad MLS
- 1987-12-01 Sold (Public Records) $23,000 Public Records
Property tax history
+1.6%/yrLatest (2024): $444 · -40.1% YoY. Source: county tax records.
Cash-flow waterfall
monthlySold comps — $/sqft
last 12 mo · ≤1 miLoading sold comps…