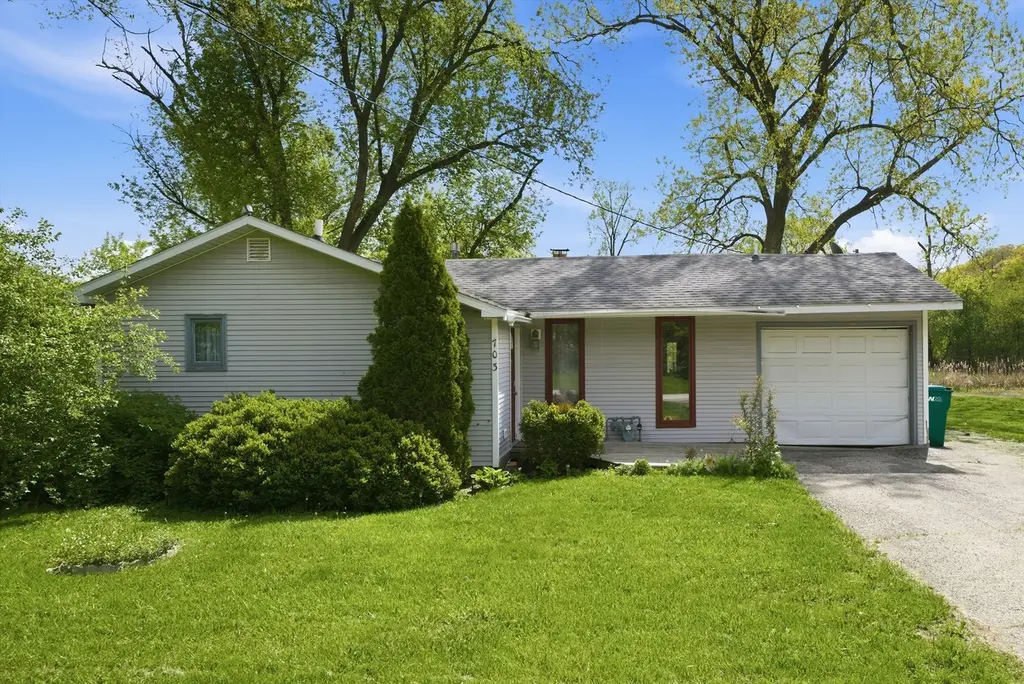
703 Il Route 59 Rte · Fox Lake, IL
Flood risk 4/10 · Minor
- FEMA flood zone
- X (unshaded)
- Chance of flooding over 30 yrs
- 0.22%
- Est. flood insurance / yr
- $507 – $1,088
Fire risk 4/10 · Minor
- Est. fire insurance / yr
- $804 – $1,492
Heat risk 2/10 · Minimal
- Hot days now (above 100°F)
- 7 days/yr
- Hot days in 30 yrs
- 14 days/yr
Wind risk 2/10 · Minimal
- Chance of severe wind over 30 yrs
- —
Air-quality risk 2/10 · Minimal
- Unhealthy air days now
- 1 days/yr
- Unhealthy air days in 30 yrs
- 1 days/yr
Risk factors via First Street. Map © Google.
Why this score? — see what drove the D+ grade
The composite is a weighted blend of 9 inputs, each scored 0–100. Each bar is that input's sub-score; the figure is the points it added to the 100-point composite (weight × sub-score).
- Cash flow +15.3/30.0
- ARV discount +10.4/15.0
- DSCR +4.7/10.0
- 1% rule +4.3/10.0
- Livability +3.7/5.0
- Rent growth +2.5/5.0
- Condition / age +2.5/5.0
- Schools +2.3/10.0
- Appreciation +0.0/10.0
$265,000
🖨 Deal sheet (PDF) 📄 Offer letter ✓ Due diligence
Listing remarks
Welcome home to this beautifully maintained 3 bedroom, 1 bathroom ranch that backs up to the channel of Duck Lake. Recently renovated with modern finishes, this move in ready home features newer flooring, paint, updated doors, and a bright, inviting interior. The spacious living areas flow seamlessly into the functional kitchen. Enjoy the convenience of an extra deep 1 car attached garage and a generously sized yard. Ideally located with easy access to shopping, dining, schools, and the Chain O'Lakes recreation area, this is an excellent opportunity for first time buyers, downsizers, or anyone looking for a turnkey home. od
Key facts
- Functional kitchen
- Newer flooring
- Updated doors
Tags
Property features AI
Finance
- HOA & community: No master association fee required
Exterior
- Parking: Attached garage (owned) with automatic opener; Oversized garage; Five parking spaces total; Driveway and off-street parking; Direct access to garage
- Utilities: Well water; Septic tank; Electric with circuit breakers
- Home design: Detached single-family home; One-story; Fee simple ownership; Interstate access nearby
- Construction: Built approximately 61–70 years ago; Vinyl siding; Asphalt roof; Concrete perimeter foundation; Built before 1978
- Exterior features: Deck; Property has water rights; Paved streets; Waterfront on Duck Lake
Interior
- Kitchen: Range; Range hood; Refrigerator
- Bedrooms: Three bedrooms (all on the main level); Master bedroom on the main level
- Flooring: Laminate flooring; Carpet
- Bathrooms: One full bathroom
- Heating & cooling: Natural gas heating; Central air conditioning
- Interior features: Open floor plan; First-floor bedroom; Screens on windows; Full unfinished attic; Crawl space basement; Kitchen/dining combo; One fireplace in the family room; Six total rooms
- Laundry & utility: Main-level laundry; Laundry closet; Gas dryer hookup; Washer; Dryer
Neighborhood map
What this means for you Summary
Snapshot
- This is a 3-bed/1.0-bath single-family listed at $265k.
Deal economics
- At list price, monthly cash flow is $99 ($1k/yr) — positive.
- The deal already cash-flows at list — no discount required.
- To meet the 1% rule (rent ≥ 1% of price), the offer needs to be $246k (7.3% below list).
- Recommended offer: $246k (7.3% below list) — sets the bar for 1% rule.
Location & tenants
- Location reads 74/100 on livability (#247 in IL, #4,462 nationally) — a middle-class / working-renter tenant base. Strengths: cost of living A+, housing A+, commute A; Watch: amenities D+, health & safety F.
- Grant Chsd 124 (suburban): math 23% / reading 27% proficiency, ranked #296 of 620 in IL (top 48%) — low school quality limits family demand, transient renter base, plan for 1-2y turnover.
- Zoned schools: Big Hollow Elem School (math 28% / reading 30%, grade F, #727 of 2,056 statewide, top 36%, 529 students, 0% FRL); Big Hollow Middle School (math 21% / reading 23%, grade F, #389 of 665 statewide, top 60%, 803 students, 0% FRL); Grant Community High School (math 23% / reading 27%, grade F, #247 of 693 statewide, top 36%, 1,837 students, 0% FRL).
- Market conditions: 35 active listings in the ZIP; 5 comparable units currently listed for rent nearby; rentals leasing fast (median 8d on market — plan ~1-2 weeks tenant-placement turnaround); 948 units permitted in Lake County in 2024 (424 in 5+ unit buildings).
Forward outlook
- Local home prices are declining (-3.0%/yr); year-one equity from $2k of loan paydown is wiped out by about $8k of value loss. Plan a longer hold.
- Lake County population projected to shrink 8% by 2050 — rents likely to lag national; underwrite the cash flow, not the appreciation.
Negotiation context
- Only 4 days on market — expect competitive offers; lowballing is unlikely to land.
- Current owner paid $20k; list at $265k implies a 1225% gain — meaningful room to come down on a strong offer.
Questions for the listing agent
- Built in 1960 — when were the roof, HVAC, electrical panel, plumbing, and water heater last replaced?
- Is there a deadline driving the sale (1031 exchange, divorce, estate, relocation)? That informs how much negotiation room exists.
- Schools are F-rated, which usually means shorter tenancies and higher turnover. Who's the typical renter profile here, and what's been the actual vacancy rate?
- The area grade is low — what's the realistic commute time and amenity access for the typical tenant pool here? Any planned neighborhood developments (good or bad) we should know about?
- What's the average days-on-market for RENTAL listings here right now (not sales)? A rising rental-DOM trend means longer vacancies and softer asking-rent achievability than the comps imply.
- What's the recent tenant-quality profile in this submarket — average credit score on applications, eviction rate, late-payment / NSF rate, and stable-employment percentage? A property-management company in the area should have these aggregated.
- How much new for-sale + rental construction is in the pipeline within 1–3 miles? Heavy new supply typically softens prices + rents 12–24 months out; constrained supply supports both.
Investment metrics
- 1% rule
- 0.93% ✗
- Cap rate
- 6.74%
- Cash-on-cash
- 1.60%
- DSCR
- 1.07
- GRM
- 9.0
CMA / ARV
- ARV (on-the-fly)
- $283,400
- Comps found
- 12
Show comp detail 12 sales within ~0.75 mi
| Address | Dist | Beds/Ba | Sqft | Sold | Price | $/sf | Match |
|---|---|---|---|---|---|---|---|
| 707 Crestview Dr | 0.12mi | 2/2.0 (-1) | 1,287 (-1%) | 12mo | $280,000 | $218 | 74 |
| 27668 W Luana Ln | 0.50mi | 3/1.5 | 1,354 (+4%) | 1mo | $300,000 | $222 | 67 |
| 302 Park Ln | 0.27mi | 3/2.0 | 1,425 (+10%) | 15mo | $279,000 | $196 | 54 |
| 35060 N Hilldale Dr | 0.65mi | 3/1.5 | 1,243 (-4%) | 8mo | $270,000 | $217 | 54 |
| 34 Hawthorne Ln | 0.73mi | 3/1.0 | 1,319 (+2%) | 13mo | $285,000 | $216 | 52 |
| 520 Jefferson St | 0.58mi | 3/2.0 | 1,260 (-3%) | 18mo | $365,000 | $290 | 49 |
| 35066 Frontage Rd | 0.58mi | 3/1.5 | 1,186 (-9%) | 10mo | $300,000 | $253 | 47 |
| 404 Monroe Ave | 0.71mi | 3/2.0 | 1,368 (+5%) | 12mo | $290,000 | $212 | 44 |
| 29 S Hickory Ave | 0.73mi | 2/1.5 (-1) | 1,195 (-8%) | 4mo | $180,000 | $151 | 42 |
| 35065 N Hilldale Dr | 0.63mi | 3/1.5 | 1,152 (-11%) | 9mo | $255,000 | $221 | 42 |
| 502 Monroe Ave | 0.68mi | 3/2.0 | 1,160 (-11%) | 14mo | $270,000 | $233 | 35 |
| 35079 N Edgewater Ln | 0.73mi | 4/2.0 (+1) | 1,486 (+14%) | 16mo | $281,000 | $189 | 20 |
Match score weights: distance 35% · size 25% · config 20% · recency 20%. Top-matched comps best support the ARV.
Projected returns pro-forma
-3.0% appreciation · 3.0% rent growth · sell at horizon
- IRR
- -13.7%
- Equity multiple
- 0.51×
- Total profit
- $-36,607
- Equity at exit
- $39,512
- IRR
- -4.8%
- Equity multiple
- 0.68×
- Total profit
- $-23,598
- Equity at exit
- $22,912
Cash invested: $74,200 (down + closing). Projections, not guarantees.
Landlord ↔ Tenant lean methodology
- Overall (STATE)
- 43 Moderately Tenant-Leaning
- State Illinois
- 43 Moderately Tenant-Leaning · D+7
- County
- — inherits STATE
- City
- — inherits STATE
ZIP-level market 60041
- Home prices YoY
- -25.0%
- Active inventory
- 35
- Price-to-rent
- 9.0×
Monthly cashflow live
- Estimated rent
- $2,457 medium interval (Pro) →
- Mortgage (P&I)
- −$1,390
- Tax from tax record
- −$342 /mo · $4,104/yr
- Insurance
- −$110
- HOA
- −$0
- Vacancy / Maint / Mgmt
- −$516
- Net cashflow
- $99
Break-even live
Sensitivity live
| Price | -10% $249 | -5% $174 | +0% $99 | +5% $24 | +10% $-51 |
|---|---|---|---|---|---|
| Rent | -10% $-95 | -5% $2 | +0% $99 | +5% $196 | +10% $293 |
| Rate | -1.0pp $232 | -0.5pp $166 | base $99 | +0.5pp $30 | +1.0pp $-40 |
UW: 25.0% down · 7.5% · 30yr · 1.5% tax · 5.0% vac · 8.0% maint · 8.0% mgmt
Financing live
Cash to close
- Down payment
- $66,250
- Closing costs
- $7,950
- Reserves months
- —
- Total cash needed
- —
Loan-product check · same deal, 3 products live
Conventional
25% down · 7.5% · 30yr
- Down + closing
- —
- Monthly P&I
- —
- Monthly cashflow
- —
- DSCR
- —
- Eligible?
- —
Personal DTI + credit; lowest rate.
DSCR
20% down · 8.5% · 30yr
- Down + closing
- —
- Monthly P&I
- —
- Monthly cashflow
- —
- DSCR
- —
- Eligible?
- —
No personal income docs; deal must DSCR.
Hard money
10% down · 12.0% · 12mo
- Down + closing
- —
- Monthly P&I
- —
- Monthly cashflow
- —
- DSCR
- —
- Eligible?
- —
Short-term bridge; refi at stabilization.
Rent comps 5 comps
| Address | Beds | Baths | Sqft | Rent | $/sqft | DOM | Units | Dist |
|---|---|---|---|---|---|---|---|---|
| 525 Circle Dr Unit 1374784P Fox Lake, IL | 3.0 | 2.0 | 1140 | $4,830 | $4.24 | 1d | 1 | 0.81mi |
| 184 E Grand Ave Unit 1374785P Fox Lake, IL | 4.0 | 3.0 | 1593 | $7,875 | $4.94 | 8d | 1 | 0.93mi |
| 601 Blue Springs Dr Unit 289 Fox Lake, IL | 3.0 | 2.5 | 1837 | $2,750 | $1.50 | 26d | 1 | 1.09mi |
| 28577 W High Rd Ingleside, IL | 3.0 | 2.0 | 1840 | $2,296 | $1.25 | 45d | 1 | 1.34mi |
| 28 Glen Ave Fox Lake, IL | 3.0 | 1.0 | 1212 | $2,300 | $1.90 | 0d | 1 | 1.39mi |
Listing history 4 events
-
2026-06-22days on market $265,000 Active 4 DOM
-
2026-06-21days on market $265,000 Active 3 DOM
-
2026-06-21remarks 631-char remark
-
2026-06-21$265,000 Active 2 DOM
ⓘ Source: listings_history table (triggers on properties + properties_extension) + one-shot
backfill from property_details.listing_events for pre-trigger history.
Tax reassessment forecast IL · Partial reset (capped growth)
- Current annual tax
- $4,104 · $342/mo
- Projected year-2 tax
- $5,060 · $422/mo
- Expected delta
- +$956/yr (+$80/mo · 23.3%)
ⓘ Screening estimate from a state-policy table — verify with the county assessor before closing.
Climate risk First Street
- Flood 4/10 Moderate FEMA zone X (unshaded) · 22% chance over 30 yrs
- Wildfire 4/10 Moderate
- Heat 2/10 Low 7 d/yr ≥100°F today · 14 d/yr by 30 yrs out
- Wind 2/10 Low
- Air quality 2/10 Low 1 unhealthy d/yr today · 1 by 30 yrs out
Nearby sold comps map
Loading sold comps map…
Walkable amenities ~0.75 mi
Loading nearby amenities…
Taxation est. · year 1
- Rental income
- $29,482
- − Mortgage interest
- −$14,844
- − Property taxes
- −$4,104
- − Insurance
- −$1,325
- − Repairs & maintenance
- −$2,359
- − Management
- −$2,359
- − Depreciation
- −$7,709
- Taxable loss
- −$3,218
- Est. tax savings @ 24.0%
- +$772
- After-tax cash flow
- $1,957/yr
For passive investors: Depreciation is non-cash, so a rental often shows a tax loss while cash-flowing — sheltering income. Rental losses are passive: they offset passive income freely, and up to $25,000/yr can offset ordinary (W-2) income if you actively participate and your MAGI is under $100k (phasing out to $0 by $150k); unused losses carry forward. On sale, claimed depreciation is recaptured at up to 25%, and gains may owe capital-gains tax (a 1031 exchange can defer both). Figures are a year-1 estimate at your 24.0% rate — not tax advice; consult a CPA.
Schools (NCES district)
- District
- Grant Chsd 124
- NCES district ID
- 1717340
- Math proficiency
- 23% ▼ -9.00%
- Reading proficiency
- 27% ▼ -7.00%
- Median HH income
- $59,450
- Composite
- 22.95/100
- National rank
- #7989
- State rank
- #296 of 620 in IL
Livability — Fox Lake
- Score
- 74/100
- State rank
- #247
- US rank
- #4462
Category grades
Schools grade is shown separately in the Schools card above.
Census & demographics
- Census place
- Fox Lake, IL
- City population
- 10,846
- Population (ZIP)
- 8,920
Population outlook (Lake County) Hauer SSP2
- Today (2025)
- 700,217 people
- By 2030
- 693,290 · -1.0%
- By 2040
- 673,588 · -3.8%
- By 2050
- 643,556 · -8.1%
- By 2075
- 562,792 · -19.6%
- By 2100
- 457,715 · -34.6%
Race, ethnicity, and origin ACS 2023
- Neighborhood character
- Predominantly White (65%)
- Race & ethnicity
- White 65% Hispanic / Latino 23% Two or more races 15% Black 4% Asian 2%
- Hispanic origin (detail)
- Mexican 15% Puerto Rican 2% Cuban 2%
- Common ancestry
- Romanian 12% Lithuanian 3% Iranian 2%
- Foreign-born
- 8% · Canada
- Languages at home
- 83% English-only · Spanish 15% Russian/Polish/Slavic 1% French/Haitian/Cajun 1%
Political lean MEDSL · Lake
- 2024 margin
- Strong D (+20.8) · D 59.7% · R 38.9% · Other 1.4%
- 2008→2024 swing
- +1.1pp toward D · 2008: 19.6pp · 2024: 20.8pp
- All cycles
- 2024: D+20.8 2020: D+24.1 2016: D+20.3 2012: D+8.1 2008: D+19.6
Not yet ingested
- Civics
- —
Market trends
- HPI YoY
- ▼ -76.75%
- Current HPI
- 230.4464
- Rent YoY
- —
- Metro
- —
- State GDP YoY
- ▲ 1.59%
- F500 in state
- 60
Industry mix (Fortune 500 HQ in IL)
| Industry | F500 HQs | Revenue |
|---|---|---|
| Insurance | 4 | $201B |
|
||
| Consumer Goods | 4 | $87B |
|
||
| Industrial Machinery | 3 | $64B |
|
||
| Healthcare | 2 | $55B |
|
||
| Retail / Pharmacy | 1 | $148B |
|
||
| Agriculture / Food | 1 | $86B |
|
||
Price history
+960.0% since first listed7 events — show timeline
- 2026-06-19 Price Changed $265,000 MRED as Distributed by MLS Grid
- 2025-07-16 Sold (Public Records) $20,000 Public Records
- 2023-11-17 Rental Removed $1,650 TURBOTENANT
- 2023-11-08 Price Changed $1,650 TURBOTENANT
- 2023-11-07 Price Changed $1,750 TURBOTENANT
- 2023-10-15 Listed for Rent — TURBOTENANT
- 2014-06-27 Sold (Public Records) $25,000 Public Records
Property tax history
+1.3%/yrLatest (2024): $4,104 · +5.4% YoY. Source: county tax records.
Cash-flow waterfall
monthlySold comps — $/sqft
last 12 mo · ≤1 miLoading sold comps…