2481 Kaanapali Pkwy Unit 1070 L · Kaanapali, HI
Flood risk 6/10 · Moderate
- FEMA flood zone
- X (unshaded)
- Chance of flooding over 30 yrs
- 0.72%
- Est. flood insurance / yr
- $507 – $1,088
Fire risk No data
- Est. fire insurance / yr
- —
Heat risk No data
- Hot days now (above threshold)
- —
- Hot days in 30 yrs
- —
Wind risk No data
- Chance of severe wind over 30 yrs
- —
Air-quality risk 1/10 · Minimal
- Unhealthy air days now
- —
- Unhealthy air days in 30 yrs
- —
Risk factors via First Street. Map © Google.
Why this score? — see what drove the C- grade
The composite is a weighted blend of 9 inputs, each scored 0–100. Each bar is that input's sub-score; the figure is the points it added to the 100-point composite (weight × sub-score).
- Cash flow +15.0/30.0
- ARV discount +15.0/15.0
- 1% rule +5.0/10.0
- DSCR +5.0/10.0
- Schools +3.7/10.0
- Livability +3.6/5.0
- Rent growth +3.5/5.0
- Condition / age +2.5/5.0
- Appreciation +1.2/10.0
$71,500
🖨 Deal sheet (PDF) 📄 Offer letter ✓ Due diligence
Listing remarks MLS
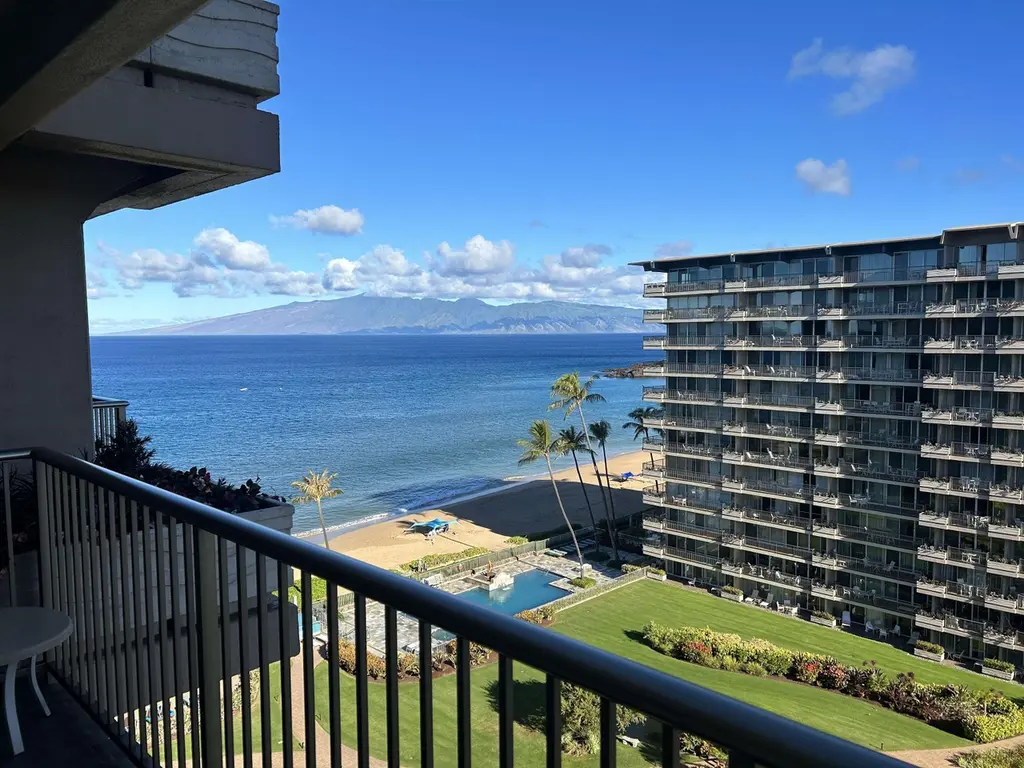
WHALER TIO 1070L: May 29 - June 12 Kick off your summer in style. Enjoy Memorial Day and the first official days of summer on Kaanapali Beach. TIO 1070 is one of the best locations in the resort. Enjoy the sun on Kaanapali Beach, then retreat to your private lanai for shade all afternoon on the courtyard of Tower 2. Listen to the waves roll onto the golden sand, and catch rainbows over the West Maui Mountains. Inside, you’ll find the quality upgrades The Whaler’s TIOs are known for, plus a comfy Murphy wall bed —perfect for bringing your favorite people along to enjoy your Maui beach retreat together.
Key facts
- West maui mountains
- Quality upgrades
- Murphy wall bed
Tags
Neighborhood map
What this means for you Summary
Snapshot
- This is a 1-bed/2.0-bath condo listed at $72k.
Deal economics
- At list price, monthly cash flow is $2k ($23k/yr) — positive.
- The deal already cash-flows at list — no discount required.
- Meets the 1% rule at list price ($3k rent vs $72k).
- Recommended offer: $63k (12.0% below list) — sets the bar for market timing.
Location & tenants
- Location reads 72/100 on livability (#19 in HI) — a middle-class / working-renter tenant base. Strengths: crime A+, employment A+, commute B+; Watch: health & safety C-, amenities F, cost of living F.
- Hawaii Department Of Education (suburban): math 32% / reading 50% proficiency, ranked #1 of 1 in HI (top 100%) — families likely to look elsewhere, expect single-tenant / working-renter base with shorter leases.
- Market conditions: Rents rising (+4.0%/yr); 637 active listings in the ZIP; solid renter incomes; 906 units permitted in Maui County in 2024 (289 in 5+ unit buildings).
- This rent runs 41% of the median local income ($101k/yr) — at the standard rent-burdened threshold; future hikes will face affordability resistance.
Forward outlook
- Local home prices are declining (-3.0%/yr); year-one equity from $494 of loan paydown is wiped out by about $2k of value loss. Plan a longer hold.
- Maui County population projected at +22% by 2050 — long-run rental-demand tailwind backs the buy-and-hold thesis.
- At projected returns (-3.0% appreciation + 4.0% rent growth), your $20k cash investment doubles in ~1 year — after that, you're playing with house money.
Negotiation context
- It's been on market 185 days — a 12% lower offer ($63k) is reasonable based on typical stale-listing flexibility.
- 7 sale attempts since 17y ago with the ask held roughly flat each time — persistent listings suggest the price (not the market) is what's stuck; bring a comps-based counter.
Risks & watch-outs
- Climate carrying-cost: major flood risk — expect insurance premiums to compound above CPI over the hold.
Questions for the listing agent
- It's been on market 185 days. Have you received any prior offers? Is the seller open to a 12% concession, seller financing, or rate buy-down credit?
- Built in 1976 — when were the roof, HVAC, electrical panel, plumbing, and water heater last replaced?
- What does the HOA fee cover, when was the last increase, and are there any pending special assessments or reserve-fund shortfalls?
- Any open or pending special assessments — roof, HVAC, plumbing, elevator, façade? What's the per-unit balance and payoff schedule, and is the seller paying it off at close or rolling it to the buyer?
- Why hasn't it sold? Are there any deal-killer items the seller is aware of (foundation, flood, title, zoning, code violations)?
- Is there a deadline driving the sale (1031 exchange, divorce, estate, relocation)? That informs how much negotiation room exists.
- What's the average days-on-market for RENTAL listings here right now (not sales)? A rising rental-DOM trend means longer vacancies and softer asking-rent achievability than the comps imply.
- What's the recent tenant-quality profile in this submarket — average credit score on applications, eviction rate, late-payment / NSF rate, and stable-employment percentage? A property-management company in the area should have these aggregated.
- How much new apartment / multifamily construction is in the pipeline within 1–3 miles? Heavy new supply (>2% of stock underway) typically softens rents 12–24 months out; light construction supports rent growth.
Investment metrics
- 1% rule
- 4.82% ✓
- Cap rate
- 38.04%
- Cash-on-cash
- 113.38%
- DSCR
- 6.04
- GRM
- 1.7
CMA / ARV
- ARV (median comp)
- $91,636
- List price
- $71,500
- Delta
- -21.97%
- Verdict
- UNDERPRICED
- Comps
- 20 within 1.0 mi
Show comp detail 1 sale within ~0.75 mi
| Address | Dist | Beds/Ba | Sqft | Sold | Price | $/sf | Match |
|---|---|---|---|---|---|---|---|
| 2481 Kaanapali Pkwy Unit 808 I | 0.02mi | 1/2.0 | 905 (0%) | 12mo | $38,500 | $43 | 89 |
Match score weights: distance 35% · size 25% · config 20% · recency 20%. Top-matched comps best support the ARV.
Projected returns pro-forma
-3.0% appreciation · 3.97% rent growth · sell at horizon
- IRR
- —
- Equity multiple
- 6.62×
- Total profit
- $112,540
- Equity at exit
- $10,661
- IRR
- —
- Equity multiple
- 14.41×
- Total profit
- $268,389
- Equity at exit
- $6,182
Cash invested: $20,020 (down + closing). Projections, not guarantees.
Landlord ↔ Tenant lean methodology
- Overall (STATE)
- 37 Tenant-Leaning
- State Hawaii
- 37 Tenant-Leaning · D+13
- County
- — inherits STATE
- City
- — inherits STATE
ZIP-level market 96761
- Home prices YoY
- -1.9%
- Rents YoY
- 4.0%
- Active inventory
- 637
- Price-to-rent
- 1.7×
Monthly cashflow live
- Estimated rent
- $3,446 medium interval (Pro) →
- Mortgage (P&I)
- −$375
- Tax est. 1.5%
- −$89 /mo · $1,072/yr
- Insurance
- −$30
- HOA
- −$337
- Vacancy / Maint / Mgmt
- −$724
- Net cashflow
- $1,892
Break-even live
Sensitivity live
| Price | -10% $1,941 | -5% $1,916 | +0% $1,892 | +5% $1,867 | +10% $1,842 |
|---|---|---|---|---|---|
| Rent | -10% $1,619 | -5% $1,755 | +0% $1,892 | +5% $2,028 | +10% $2,164 |
| Rate | -1.0pp $1,928 | -0.5pp $1,910 | base $1,892 | +0.5pp $1,873 | +1.0pp $1,854 |
UW: 25.0% down · 7.5% · 30yr · 1.5% tax · 5.0% vac · 8.0% maint · 8.0% mgmt
Financing live
Cash to close
- Down payment
- $17,875
- Closing costs
- $2,145
- Reserves months
- —
- Total cash needed
- —
Loan-product check · same deal, 3 products live
Conventional
25% down · 7.5% · 30yr
- Down + closing
- —
- Monthly P&I
- —
- Monthly cashflow
- —
- DSCR
- —
- Eligible?
- —
Personal DTI + credit; lowest rate.
DSCR
20% down · 8.5% · 30yr
- Down + closing
- —
- Monthly P&I
- —
- Monthly cashflow
- —
- DSCR
- —
- Eligible?
- —
No personal income docs; deal must DSCR.
Hard money
10% down · 12.0% · 12mo
- Down + closing
- —
- Monthly P&I
- —
- Monthly cashflow
- —
- DSCR
- —
- Eligible?
- —
Short-term bridge; refi at stabilization.
HOA detail condo
- Monthly dues
- $337 · $4,044/yr
- Assessments
- None detected in remarks — confirm with the listing agent.
Listing history 37 events
-
2026-06-21days on market $71,500 Active 185 DOM
-
2026-06-18days on market $71,500 Active 182 DOM
-
2026-06-17days on market $71,500 Active 181 DOM
-
2026-06-15days on market $71,500 Active 179 DOM
-
2026-06-13days on market $71,500 Active 177 DOM
-
2026-06-13days on market $71,500 Active 176 DOM
-
2026-06-10days on market $71,500 Active 174 DOM
-
2026-06-09days on market $71,500 Active 173 DOM
-
2026-06-08days on market $71,500 Active 172 DOM
-
2026-06-07days on market $71,500 Active 171 DOM
-
2026-06-05days on market $71,500 Active 168 DOM
-
2026-06-03days on market $71,500 Active 167 DOM
-
2026-06-02days on market $71,500 Active 166 DOM
-
2026-06-01days on market $71,500 Active 165 DOM
-
2026-05-31days on market $71,500 Active 164 DOM
-
2025-12-18$71,500 Active 629-char remark
Show marketing remark (629 chars)
WHALER TIO 1070L: May 29 - June 12 Kick off your summer in style. Enjoy Memorial Day and the first official days of summer on Kaanapali Beach. TIO 1070 is one of the best locations in the resort. Enjoy the sun on Kaanapali Beach, then retreat to your private lanai for shade all afternoon on the courtyard of Tower 2. Listen to the waves roll onto the golden sand, and catch rainbows over the West Maui Mountains. Inside, you’ll find the quality upgrades The Whaler’s TIOs are known for, plus a comfy Murphy wall bed —perfect for bringing your favorite people along to enjoy your Maui beach retreat together.
-
2024-04-11soldstatus $125,000 19-char remark
Show marketing remark (19 chars)
Sold before listed.
-
2024-02-21$125,000 19-char remark
Show marketing remark (19 chars)
Sold before listed.
-
2020-05-02historical
-
2020-01-16price $41,500
-
2019-03-14$45,000 Active
-
2013-06-24soldstatus $15,500
-
2013-02-22$27,500
-
2012-01-31soldstatus $21,000
-
2011-12-01historical
-
2011-08-03historical
-
2011-06-06$27,500
-
2010-08-09$28,000
-
2009-11-30$28,000
-
2004-06-01soldstatus $29,900
-
1999-06-03soldstatus $26,500
-
1999-03-01soldstatus $44,000
-
1999-01-06soldstatus $32,500
-
1997-03-07soldstatus $36,000
-
1990-12-28soldstatus $537,900
-
1981-12-01soldstatus $439,100
-
1979-06-01soldstatus $335,000
ⓘ Source: listings_history table (triggers on properties + properties_extension) + one-shot
backfill from property_details.listing_events for pre-trigger history.
Climate risk First Street
- Flood 6/10 Major FEMA zone X (unshaded) · 72% chance over 30 yrs
- Air quality 1/10 Low
Nearby sold comps map
Loading sold comps map…
Walkable amenities ~0.75 mi
Loading nearby amenities…
Taxation est. · year 1
- Rental income
- $41,356
- − Mortgage interest
- −$4,005
- − Property taxes
- −$1,072
- − Insurance
- −$358
- − Repairs & maintenance
- −$3,309
- − Management
- −$3,309
- − HOA
- −$4,044
- − Depreciation
- −$2,080
- Taxable income
- $23,180
- Est. tax owed @ 24.0%
- −$5,563
- After-tax cash flow
- $17,135/yr
For passive investors: Depreciation is non-cash, so a rental often shows a tax loss while cash-flowing — sheltering income. Rental losses are passive: they offset passive income freely, and up to $25,000/yr can offset ordinary (W-2) income if you actively participate and your MAGI is under $100k (phasing out to $0 by $150k); unused losses carry forward. On sale, claimed depreciation is recaptured at up to 25%, and gains may owe capital-gains tax (a 1031 exchange can defer both). Figures are a year-1 estimate at your 24.0% rate — not tax advice; consult a CPA.
Schools (NCES district)
- District
- Hawaii Department Of Education
- NCES district ID
- 1500030
- Math proficiency
- 32% ▼ -10.00%
- Reading proficiency
- 50% ▼ -3.00%
- Median HH income
- $69,005
- Composite
- 37.07/100
- National rank
- #4504
- State rank
- #1 of 1 in HI
Livability — Kaanapali
- Score
- 72/100
- State rank
- #19
- US rank
- #6248
Category grades
Schools grade is shown separately in the Schools card above.
Census & demographics
- Census place
- Kaanapali, HI
- County
- Maui County · 114,195 people
- Metro
- Kahului-Wailuku-Lahaina, HI
- Population (ZIP)
- 20,952
- Household income
- $101,123
- Rent vs Own
- Severe rent burden
- 835.0
Population outlook (Maui County) Hauer SSP2
- Today (2025)
- 185,013 people
- By 2030
- 194,315 · +5.0%
- By 2040
- 210,917 · +14.0%
- By 2050
- 226,396 · +22.4%
- By 2075
- 270,475 · +46.2%
- By 2100
- 316,825 · +71.2%
Race, ethnicity, and origin ACS 2023
- Neighborhood character
- Highly diverse neighborhood (Simpson 0.78)
- Race & ethnicity
- White 35% Asian 29% Two or more races 25% Hispanic / Latino 13% Pacific Islander 6%
- Hispanic origin (detail)
- Mexican 7%
- Common ancestry
- Russian 3% Lithuanian 2% Iranian 1%
- Foreign-born
- 25% · Canada, Vietnam, China
- Languages at home
- 74% English-only · Other Asian/Pacific 12% Tagalog/Filipino 6% Spanish 5%
Political lean MEDSL · Maui
- 2024 margin
- Strong D (+25.9) · D 61.9% · R 36.0% · Other 2.2%
- 2008→2024 swing
- -29.3pp toward R · 2008: 55.2pp · 2024: 25.9pp
- All cycles
- 2024: D+25.9 2020: D+35.5 2016: D+38.6 2012: D+50.3 2008: D+55.2
Not yet ingested
- Civics
- —
Market trends
- HPI YoY
- ▼ -7.68%
- Current HPI
- 389.2894
- Rent YoY
- ▲ 3.97%
- Metro
- Kahului-Wailuku-Lahaina, HI
- State GDP YoY
- —
- F500 in state
- 0
Price history
-78.7% since first listed22 events — show timeline
- 2025-12-18 Listed $71,500 RAM MLS
- 2024-04-11 Sold (MLS) $125,000 RAM MLS
- 2024-02-21 Listed $125,000 RAM MLS
- 2020-05-02 Listing Removed — RAM MLS
- 2020-01-16 Price Changed $41,500 RAM MLS
- 2019-03-14 Listed $45,000 RAM MLS
- 2013-06-24 Sold (MLS) $15,500 RAM MLS
- 2013-02-22 Listed $27,500 RAM MLS
- 2012-01-31 Sold (MLS) $21,000 RAM MLS
- 2011-12-01 Listing Removed — RAM MLS
- 2011-08-03 Listing Removed — RAM MLS
- 2011-06-06 Listed $27,500 RAM MLS
- 2010-08-09 Listed $28,000 RAM MLS
- 2009-11-30 Listed $28,000 RAM MLS
- 2004-06-01 Sold (Public Records) $29,900 Public Records
- 1999-06-03 Sold (Public Records) $26,500 Public Records
- 1999-03-01 Sold (Public Records) $44,000 Public Records
- 1999-01-06 Sold (Public Records) $32,500 Public Records
- 1997-03-07 Sold (Public Records) $36,000 Public Records
- 1990-12-28 Sold (Public Records) $537,900 Public Records
- 1981-12-01 Sold (Public Records) $439,100 Public Records
- 1979-06-01 Sold (Public Records) $335,000 Public Records
Property tax history
+8.0%/yrLatest (2025): $25,756 · +1.4% YoY. Source: county tax records.
Cash-flow waterfall
monthlySold comps — $/sqft
last 12 mo · ≤1 miLoading sold comps…