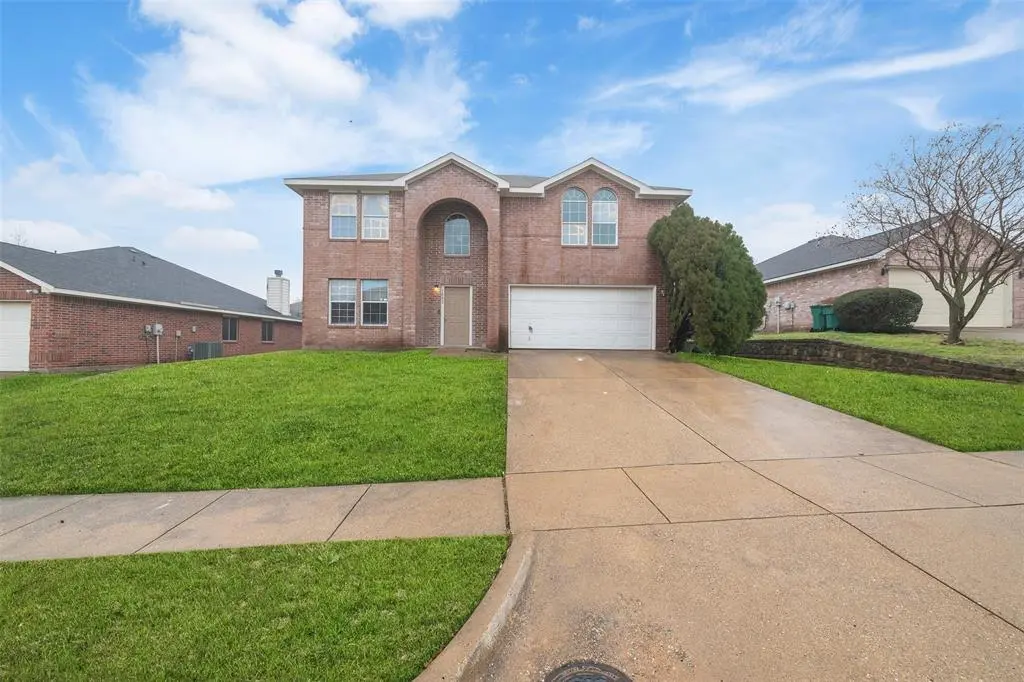
1092 Winding Crk · Cedar Hill, TX
Flood risk 1/10 · Minimal
- FEMA flood zone
- X (unshaded)
- Chance of flooding over 30 yrs
- 0.0%
- Est. flood insurance / yr
- $507 – $1,088
Fire risk 2/10 · Minimal
- Est. fire insurance / yr
- $1,222 – $2,270
Heat risk 7/10 · Major
- Hot days now (above 109°F)
- 7 days/yr
- Hot days in 30 yrs
- 25 days/yr
Wind risk 6/10 · Moderate
- Chance of severe wind over 30 yrs
- 27.0%
Air-quality risk 3/10 · Minor
- Unhealthy air days now
- 2 days/yr
- Unhealthy air days in 30 yrs
- 3 days/yr
Risk factors via First Street. Map © Google.
Why this score? — see what drove the F grade
The composite is a weighted blend of 9 inputs, each scored 0–100. Each bar is that input's sub-score; the figure is the points it added to the 100-point composite (weight × sub-score).
- ARV discount +10.6/15.0
- Cash flow +7.5/30.0
- Livability +3.7/5.0
- 1% rule +3.1/10.0
- Schools +2.5/10.0
- Condition / age +2.5/5.0
- Rent growth +2.3/5.0
- DSCR +1.6/10.0
- Appreciation +0.0/10.0
$339,000
🖨 Deal sheet 📄 Offer letter ✓ Due diligence
Listing remarks MLS
Nice two-story home in good condition. GREAT PRICE! Master bedroom is downstairs.
Key facts
- New hvac
- Large island
- Updated flooring
Tags
Property features AI
Finance
- Other: Property listed as residential single-family; Municipal utility district: No; Subdivision: Winding Hollow Ph 1b
- HOA & community: No association
Exterior
- Parking: Attached 2-car garage; Covered parking for 2 (carport spaces listed); Driveway; garage faces front
- Utilities: City water; City sewer; Cable available
- Home design: Single-family residence; Two-story home; Entry level and room levels vary by room
- Construction: Brick construction; Composition/shingle roof; Slab foundation; Built in 2002
- Exterior features: Wood fence; Interior lot
Interior
- Kitchen: Dishwasher; Disposal; Electric cooktop; Electric oven; Built-in cabinets
- Bedrooms: 4 bedrooms (primary bedroom on level 1; other bedrooms on level 2)
- Flooring: Carpet; Ceramic tile; Luxury vinyl plank
- Bathrooms: 3 bathrooms total (2 full, 1 half); Primary bathroom with garden tub, separate shower and separate vanities
- Heating & cooling: Central heating (electric); Central air; Ceiling fans
- Interior features: Open floorplan; Eat-in kitchen; Kitchen island; Granite counters; Pantry; Cable TV available; Walk-in closets; Two living areas; One dining area; 12 total rooms
- Laundry & utility: Full-size washer/dryer area; Washer hookup; Electric dryer hookup; Separate utility room
Neighborhood map
What this means for you Summary
Snapshot
- This is a 4-bed/2.5-bath single-family listed at $339k.
Deal economics
- At list price, monthly cash flow is $-418 ($-5k/yr) — negative.
- To cash-flow at today's rent, offer at most $265k (21.8% below list).
- To meet the 1% rule (rent ≥ 1% of price), the offer needs to be $275k (18.8% below list).
- Recommended offer: $265k (21.8% below list) — sets the bar for cash-flow.
- Cap rate 4.8% vs local median 3.5% in Cedar Hill — top-decile yield for the area; either an underpriced asset or a hidden risk that comps aren't pricing in. Stress-test before assuming the spread holds.
Location & tenants
- Location reads 74/100 on livability (#178 in TX, #4,673 nationally) — a middle-class / working-renter tenant base. Strengths: cost of living A+, housing A+, employment B+; Watch: amenities F, commute F.
- Cedar Hill ISD (suburban): math 19% / reading 35% proficiency, ranked #643 of 826 in TX (top 78%) — low school quality limits family demand, transient renter base, plan for 1-2y turnover.
- Zoned schools: Waterford Oaks El (math 17% / reading 22%, grade F, #3,583 of 4,322 statewide, top 86%, 438 students, 83% FRL) — zoned schools average 83% FRL vs 60% district-wide (23 pts higher); higher-poverty schools than district average — tighter screening recommended.
- Market conditions: Rents soft (-0.9%/yr); 411 active listings in the ZIP; 9 comparable units currently listed for rent nearby; rentals leasing fast (median 12d on market — plan ~1-2 weeks tenant-placement turnaround); solid renter incomes; 12,577 units permitted in Dallas County in 2024 (6,829 in 5+ unit buildings).
- This rent runs 32% of the median local income ($103k/yr) — at the standard rent-burdened threshold; future hikes will face affordability resistance.
Forward outlook
- Local home prices are declining (-3.0%/yr); year-one equity from $2k of loan paydown is wiped out by about $10k of value loss. Plan a longer hold.
- Dallas County population projected at +35% by 2050 — long-run rental-demand tailwind backs the buy-and-hold thesis.
Negotiation context
- It's been on market 55 days — a 3% lower offer ($329k) is reasonable based on typical stale-listing flexibility.
- 4 sale attempts since 20y ago with the ask held roughly flat each time — persistent listings suggest the price (not the market) is what's stuck; bring a comps-based counter.
Risks & watch-outs
- Climate carrying-cost: major wind risk, 27% chance of damaging wind over 30y; extreme-heat days projected 7→25/yr by 2055 (HVAC capex compounding) — expect insurance premiums to compound above CPI over the hold.
Questions for the listing agent
- What do current leases actually rent for vs. the listed asking? Can we see a recent rent roll and the last 12 months of T-12 income?
- It's been on market 55 days. Have you received any prior offers? Is the seller open to a 22% concession, seller financing, or rate buy-down credit?
- Is there a deadline driving the sale (1031 exchange, divorce, estate, relocation)? That informs how much negotiation room exists.
- The area grade is low — what's the realistic commute time and amenity access for the typical tenant pool here? Any planned neighborhood developments (good or bad) we should know about?
- What's the average days-on-market for RENTAL listings here right now (not sales)? A rising rental-DOM trend means longer vacancies and softer asking-rent achievability than the comps imply.
- What's the recent tenant-quality profile in this submarket — average credit score on applications, eviction rate, late-payment / NSF rate, and stable-employment percentage? A property-management company in the area should have these aggregated.
- How much new for-sale + rental construction is in the pipeline within 1–3 miles? Heavy new supply typically softens prices + rents 12–24 months out; constrained supply supports both.
Investment metrics
- 1% rule
- 0.81% ✗
- Cap rate
- 4.81%
- Cash-on-cash
- -5.28%
- DSCR
- 0.76
- GRM
- 10.3
CMA / ARV
- ARV (median comp)
- $363,873
- List price
- $339,000
- Delta
- -6.84%
- Verdict
- FAIR
- Comps
- 20 within 1.0 mi
Show comp detail 12 sales within ~0.75 mi
| Address | Dist | Beds/Ba | Sqft | Sold | Price | $/sf | Match |
|---|---|---|---|---|---|---|---|
| 1071 Streamside Dr | 0.08mi | 4/2.5 | 2,779 (-1%) | 4mo | $350,000 | $126 | 92 |
| 1066 Streamside Dr | 0.11mi | 4/2.0 | 2,779 (-1%) | 11mo | $370,000 | $133 | 82 |
| 626 Bluechalk Dr | 0.50mi | 4/2.5 | 2,760 (-1%) | 11mo | $349,999 | $127 | 66 |
| 750 Lowe Dr | 0.47mi | 5/2.5 (+1) | 2,957 (+6%) | 0mo | $319,000 | $108 | 63 |
| 1023 Greenbriar Trl | 0.52mi | 4/2.5 | 2,753 (-2%) | 12mo | $400,000 | $145 | 63 |
| 1032 Bending Oak Dr | 0.56mi | 4/2.0 | 2,615 (-7%) | 7mo | $343,900 | $132 | 55 |
| 625 Arbor Dr | 0.49mi | 3/2.5 (-1) | 2,704 (-3%) | 15mo | $330,000 | $122 | 54 |
| 1409 Stoney Hills Dr | 0.47mi | 4/2.5 | 3,119 (+11%) | 9mo | $539,997 | $173 | 51 |
| 822 Christine Dr | 0.49mi | 4/2.5 | 2,441 (-13%) | 9mo | $350,000 | $143 | 48 |
| 664 Lowe Dr | 0.72mi | 5/2.5 (+1) | 2,957 (+6%) | 9mo | $330,000 | $112 | 44 |
| 601 N Duncanville Rd | 0.47mi | 3/3.0 (-1) | 2,427 (-13%) | 9mo | $599,000 | $247 | 41 |
| 1848 River Run Dr | 0.72mi | 4/2.5 | 2,395 (-14%) | 1mo | $399,900 | $167 | 41 |
Match score weights: distance 35% · size 25% · config 20% · recency 20%. Top-matched comps best support the ARV.
Projected returns pro-forma
-3.0% appreciation · 0.0% rent growth · sell at horizon
- IRR
- -29.1%
- Equity multiple
- 0.06×
- Total profit
- $-89,421
- Equity at exit
- $50,546
- IRR
- -50.3%
- Equity multiple
- -0.50×
- Total profit
- $-142,528
- Equity at exit
- $29,311
Cash invested: $94,920 (down + closing). Projections, not guarantees.
Landlord ↔ Tenant lean methodology
- Overall (STATE)
- 87 Strongly Landlord-Friendly
- State Texas
- 87 Strongly Landlord-Friendly · R+5
- County
- — inherits STATE
- City
- — inherits STATE
ZIP-level market 75104
- Home prices YoY
- -5.5%
- Rents YoY
- -0.9%
- Active inventory
- 411
- Price-to-rent
- 10.3×
Monthly cashflow live
- Estimated rent
- $2,754 high interval (Pro) →
- Mortgage (P&I)
- −$1,778
- Tax from tax record
- −$674 /mo · $8,090/yr
- Insurance
- −$141
- HOA
- −$0
- Vacancy / Maint / Mgmt
- −$578
- Net cashflow
- $-418
Break-even live
UW: 25.0% down · 7.5% · 30yr · 1.5% tax · 5.0% vac · 8.0% maint · 8.0% mgmt
Financing live
Cash to close
- Down payment
- $84,750
- Closing costs
- $10,170
- Reserves months
- —
- Total cash needed
- —
Loan-product check · same deal, 3 products live
Conventional
25% down · 7.5% · 30yr
- Down + closing
- —
- Monthly P&I
- —
- Monthly cashflow
- —
- DSCR
- —
- Eligible?
- —
Personal DTI + credit; lowest rate.
DSCR
20% down · 8.5% · 30yr
- Down + closing
- —
- Monthly P&I
- —
- Monthly cashflow
- —
- DSCR
- —
- Eligible?
- —
No personal income docs; deal must DSCR.
Hard money
10% down · 12.0% · 12mo
- Down + closing
- —
- Monthly P&I
- —
- Monthly cashflow
- —
- DSCR
- —
- Eligible?
- —
Short-term bridge; refi at stabilization.
Rent comps 9 comps
| Address | Beds | Baths | Sqft | Rent | $/sqft | DOM | Units | Dist |
|---|---|---|---|---|---|---|---|---|
| 1088 Pondview Dr Cedar Hill, TX | 5.0 | 3.5 | 2606 | $6,000 | $2.30 | 12d | 1 | 0.12mi |
| 1016 Winding Crk Cedar Hill, TX | 4.0 | 2.0 | 1948 | $2,730 | $1.40 | 1d | 1 | 0.30mi |
| 765 Lowe Dr Cedar Hill, TX | 4.0 | 2.5 | 2287 | $2,995 | $1.31 | 1d | 1 | 0.41mi |
| 936 Bending Oak Dr Cedar Hill, TX | 5.0 | 3.0 | 3569 | $3,375 | $0.95 | 1d | 1 | 0.49mi |
| 612 Grove Mnr Cedar Hill, TX | 4.0 | 2.0 | 2130 | $2,535 | $1.19 | 44d | 1 | 0.58mi |
| 909 Shady Brook Ln Cedar Hill, TX | 4.0 | 2.0 | 3056 | $2,584 | $0.85 | 20d | 1 | 1.02mi |
| 824 Willow Wood Dr Cedar Hill, TX | 4.0 | 2.5 | 2494 | $2,480 | $0.99 | 44d | 1 | 1.15mi |
| 1100 Balfour Dr Cedar Hill, TX | 4.0 | 3.0 | 2737 | $2,950 | $1.08 | 7d | 1 | 1.28mi |
| 1510 Lost Creek Dr Desoto, TX | 4.0 | 2.5 | 2461 | $2,605 | $1.06 | 22d | 1 | 1.38mi |
Listing history 27 events
-
2026-06-18days on market $339,000 Active 55 DOM
-
2026-06-17days on market $339,000 Active 54 DOM
-
2026-06-16days on market $339,000 Active 53 DOM
-
2026-06-15days on market $339,000 Active 52 DOM
-
2026-06-13days on market $339,000 Active 50 DOM
-
2026-06-09days on market $339,000 Active 46 DOM
-
2026-06-08days on market $339,000 Active 45 DOM
-
2026-06-07days on market $339,000 Active 44 DOM
-
2026-06-04days on market $339,000 Active 41 DOM
-
2026-06-03days on market $339,000 Active 40 DOM
-
2026-06-02days on market $339,000 Active 39 DOM
-
2026-06-01days on market $339,000 Active 38 DOM
-
2026-05-31days on market $339,000 Active 37 DOM
-
2026-04-24$339,000 Active 901-char remark
-
2025-10-10historical
-
2025-08-09price $349,900
-
2025-07-24status Active
-
2025-07-16historical Active Option Contract
-
2025-05-15price $355,000
-
2025-04-25price $359,900
-
2025-04-03price $365,000
-
2025-02-07$370,000 Active
-
2011-02-23soldstatus
-
2006-11-08soldstatus
-
2006-07-26soldstatus
Show marketing remark (81 chars)
Nice two-story home in good condition. GREAT PRICE! Master bedroom is downstairs.
-
2006-07-24historical
Show marketing remark (81 chars)
Nice two-story home in good condition. GREAT PRICE! Master bedroom is downstairs.
-
2006-03-20$134,900
Show marketing remark (81 chars)
Nice two-story home in good condition. GREAT PRICE! Master bedroom is downstairs.
ⓘ Source: listings_history table (triggers on properties + properties_extension) + one-shot
backfill from property_details.listing_events for pre-trigger history.
Tax reassessment forecast TX · Resets to sale price
- Current annual tax
- $8,090 · $674/mo
- Projected year-2 tax
- $8,090 · $674/mo
- Expected delta
- $0/yr ($0/mo · 0.0%)
ⓘ Screening estimate from a state-policy table — verify with the county assessor before closing.
Climate risk First Street
- Flood 1/10 Low FEMA zone X (unshaded) · 0% chance over 30 yrs
- Wildfire 2/10 Low
- Heat 7/10 Severe 7 d/yr ≥109°F today · 25 d/yr by 30 yrs out
- Wind 6/10 Major 27% chance of damaging wind over 30 yrs
- Air quality 3/10 Moderate 2 unhealthy d/yr today · 3 by 30 yrs out
Nearby sold comps map
Loading sold comps map…
Walkable amenities ~0.75 mi
Loading nearby amenities…
Taxation est. · year 1
- Rental income
- $33,043
- − Mortgage interest
- −$18,989
- − Property taxes
- −$8,090
- − Insurance
- −$1,695
- − Repairs & maintenance
- −$2,643
- − Management
- −$2,643
- − Depreciation
- −$9,862
- Taxable loss
- −$10,880
- Est. tax savings @ 24.0%
- +$2,611
- After-tax cash flow
- $-2,403/yr
For passive investors: Depreciation is non-cash, so a rental often shows a tax loss while cash-flowing — sheltering income. Rental losses are passive: they offset passive income freely, and up to $25,000/yr can offset ordinary (W-2) income if you actively participate and your MAGI is under $100k (phasing out to $0 by $150k); unused losses carry forward. On sale, claimed depreciation is recaptured at up to 25%, and gains may owe capital-gains tax (a 1031 exchange can defer both). Figures are a year-1 estimate at your 24.0% rate — not tax advice; consult a CPA.
Schools (NCES district)
- District
- Cedar Hill ISD
- NCES district ID
- 4813230
- Math proficiency
- 19% ▼ -22.00%
- Reading proficiency
- 35% ▼ -5.00%
- Median HH income
- $64,438
- Composite
- 25.04/100
- National rank
- #7548
- State rank
- #643 of 826 in TX
Livability — Cedar Hill
- Score
- 74/100
- State rank
- #178
- US rank
- #4673
Category grades
Schools grade is shown separately in the Schools card above.
Census & demographics
- Census place
- Cedar Hill, TX
- County
- Dallas County · 2,612,404 people
- City population
- 49,228
- Metro
- Dallas-Fort Worth-Arlington, TX
- Population (ZIP)
- 49,228
- Household income
- $102,875
- Rent vs Own
- Severe rent burden
- 1570.0
Population outlook (Dallas County) Hauer SSP2
- Today (2025)
- 2,979,839 people
- By 2030
- 3,191,823 · +7.1%
- By 2040
- 3,619,611 · +21.5%
- By 2050
- 4,026,915 · +35.1%
- By 2075
- 4,957,073 · +66.4%
- By 2100
- 5,508,725 · +84.9%
Race, ethnicity, and origin ACS 2023
- Neighborhood character
- Diverse neighborhood (Simpson 0.65)
- Race & ethnicity
- Black 50% Hispanic / Latino 28% White 16% Two or more races 11% Asian 2%
- Hispanic origin (detail)
- Mexican 24%
- Common ancestry
- Lithuanian 1% Italian 1%
- Foreign-born
- 12% · Canada, Vietnam
- Languages at home
- 77% English-only · Spanish 19% Other Indo-European 1%
Political lean MEDSL · Dallas
- 2024 margin
- Strong D (+22.2) · D 60.2% · R 38.0% · Other 1.8%
- 2008→2024 swing
- +6.9pp toward D · 2008: 15.3pp · 2024: 22.2pp
- All cycles
- 2024: D+22.2 2020: D+31.6 2016: D+26.2 2012: D+15.4 2008: D+15.3
Not yet ingested
- Civics
- —
Market trends
- HPI YoY
- ▼ -16.63%
- Current HPI
- 287.5359
- Rent YoY
- ▼ -0.88%
- Metro
- Dallas-Fort Worth-Arlington, TX
- State GDP YoY
- ▲ 3.95%
- F500 in state
- 110
Industry mix (Fortune 500 HQ in TX)
| Industry | F500 HQs | Revenue |
|---|---|---|
| Energy | 16 | $1,198B |
|
||
| Technology | 5 | $198B |
|
||
| Engineering / Construction | 4 | $72B |
|
||
| Energy Services | 3 | $60B |
|
||
| Utilities | 3 | $41B |
|
||
| Healthcare | 2 | $330B |
|
||
Price history
+151.3% since first listed14 events — show timeline
- 2026-04-24 Listed $339,000 NTREIS
- 2025-10-10 Listing Removed — NTREIS
- 2025-08-09 Price Changed $349,900 NTREIS
- 2025-07-24 Relisted — NTREIS
- 2025-07-16 Contingent — NTREIS
- 2025-05-15 Price Changed $355,000 NTREIS
- 2025-04-25 Price Changed $359,900 NTREIS
- 2025-04-03 Price Changed $365,000 NTREIS
- 2025-02-07 Listed $370,000 NTREIS
- 2011-02-23 Sold (Public Records) — Public Records
- 2006-11-08 Sold (Public Records) — Public Records
- 2006-07-26 Sold (MLS) — NTREIS
- 2006-07-24 Listing Removed — NTREIS
- 2006-03-20 Listed $134,900 NTREIS
Property tax history
+5.3%/yrLatest (2025): $8,090 · -2.8% YoY. Source: county tax records.
Cash-flow waterfall
monthlySold comps — $/sqft
last 12 mo · ≤1 miLoading sold comps…