202 Hampton Rd · Fairmont, WV
Flood risk 1/10 · Minimal
- FEMA flood zone
- X (unshaded)
- Chance of flooding over 30 yrs
- 0.0%
- Est. flood insurance / yr
- $473 – $860
Fire risk 1/10 · Minimal
- Est. fire insurance / yr
- $787 – $1,461
Heat risk 4/10 · Minor
- Hot days now (above 99°F)
- 7 days/yr
- Hot days in 30 yrs
- 19 days/yr
Wind risk 1/10 · Minimal
- Chance of severe wind over 30 yrs
- —
Air-quality risk 2/10 · Minimal
- Unhealthy air days now
- 1 days/yr
- Unhealthy air days in 30 yrs
- 2 days/yr
Risk factors via First Street. Map © Google.
Why this score? — see what drove the B+ grade
The composite is a weighted blend of 9 inputs, each scored 0–100. Each bar is that input's sub-score; the figure is the points it added to the 100-point composite (weight × sub-score).
- Cash flow +30.0/30.0
- ARV discount +15.0/15.0
- 1% rule +10.0/10.0
- DSCR +10.0/10.0
- Livability +3.5/5.0
- Schools +3.1/10.0
- Rent growth +2.5/5.0
- Condition / age +2.5/5.0
- Appreciation +0.0/10.0
$44,900
🖨 Deal sheet 📄 Offer letter ✓ Due diligence
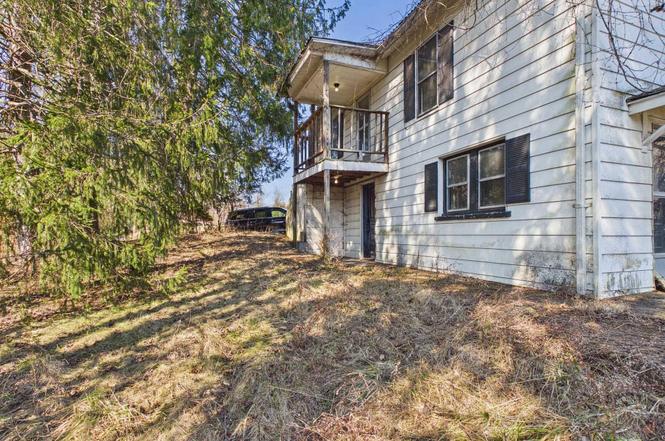
Listing remarks
Investor Special with Strong Potential! Opportunity knocks with this property ready for your vision and renovation expertise. This home will require updates and is ideal for investors, flippers, or buyers looking for a full renovation project. The property features a nice-sized backyard and a 2-stall garage, adding long-term value and flexibility for future resale or rental income. With the right updates, this could make a great starter home or investment property. Bring your ideas and transform this property into something special! SEE AGENT REMARKS
Key facts
- 2-stall garage
- Nice-sized backyard
- 6,098 sq ft lot
Tags
Property features AI
Exterior
- Parking: Detached 2-car garage
- Utilities: Public water; Public sewer
- Home design: Single family residence, detached; 2-story
- Construction: Aluminum siding and block construction; Shingle roof
- Exterior features: Front porch; Level lot
Interior
- Kitchen: Range
- Bedrooms: Total rooms: 4
- Flooring: Wood
- Bathrooms: 1 full bathroom
- Heating & cooling: Natural gas heating
- Interior features: Wood flooring; Range
Neighborhood map
What this means for you Summary
Snapshot
- This is a 1-bed/1.0-bath single-family listed at $45k.
Deal economics
- At list price, monthly cash flow is $366 ($4k/yr) — positive.
- The deal already cash-flows at list — no discount required.
- Meets the 1% rule at list price ($856 rent vs $45k).
- Recommended offer: $41k (9.0% below list) — sets the bar for market timing.
- Cap rate 16.1% vs local median 4.3% in Fairmont — top-decile yield for the area; either an underpriced asset or a hidden risk that comps aren't pricing in. Stress-test before assuming the spread holds.
Location & tenants
- Location reads 70/100 on livability (#64 in WV) — a middle-class / working-renter tenant base. Strengths: cost of living A+, housing A+, health & safety A+; Watch: crime D, amenities F, commute F.
- Marion County Schools (town): math 30% / reading 43% proficiency, ranked #11 of 55 in WV (top 20%) — families likely to look elsewhere, expect single-tenant / working-renter base with shorter leases.
- Zoned schools: Jayenne Elementary School (math 47% / reading 47%, grade D-, #63 of 377 statewide, top 18%, 300 students, 0% FRL); West Fairmont Middle School (math 27% / reading 41%, grade F, #36 of 109 statewide, top 35%, 629 students, 0% FRL); East Fairmont High School (math 27% / reading 52%, grade F, #21 of 110 statewide, top 26%, 689 students, 0% FRL) — zoned schools average 0% FRL vs 46% district-wide (46 pts lower); this property's tenant base skews higher-income than the district average.
- Market conditions: 151 active listings in the ZIP; 3 units permitted in Marion County in 2024 (0 in 5+ unit buildings).
Forward outlook
- Local home prices are declining (-3.0%/yr); year-one equity from $310 of loan paydown is wiped out by about $1k of value loss. Plan a longer hold.
- At projected returns (-3.0% appreciation + 3.0% rent growth), your $13k cash investment doubles in ~4 years — after that, you're playing with house money.
Negotiation context
- It's been on market 109 days — a 9% lower offer ($41k) is reasonable based on typical stale-listing flexibility.
Risks & watch-outs
- Watch-outs: built in 1945 — expect roof / HVAC / electrical / plumbing capex.
Questions for the listing agent
- It's been on market 109 days. Have you received any prior offers? Is the seller open to a 9% concession, seller financing, or rate buy-down credit?
- Built in 1945 — when were the roof, HVAC, electrical panel, plumbing, and water heater last replaced?
- Why hasn't it sold? Are there any deal-killer items the seller is aware of (foundation, flood, title, zoning, code violations)?
- Is there a deadline driving the sale (1031 exchange, divorce, estate, relocation)? That informs how much negotiation room exists.
- Schools are B-rated — typically a magnet for longer-tenancy family renters. What's the average tenant stay here, and is there a school-zone premium baked into asking?
- Crime grade is D in this area — have there been break-ins, vandalism, or insurance claims at this property in the last 3 years? What carrier currently insures it and at what premium?
- What's the average days-on-market for RENTAL listings here right now (not sales)? A rising rental-DOM trend means longer vacancies and softer asking-rent achievability than the comps imply.
- What's the recent tenant-quality profile in this submarket — average credit score on applications, eviction rate, late-payment / NSF rate, and stable-employment percentage? A property-management company in the area should have these aggregated.
- How much new for-sale + rental construction is in the pipeline within 1–3 miles? Heavy new supply typically softens prices + rents 12–24 months out; constrained supply supports both.
Investment metrics
- 1% rule
- 1.91% ✓
- Cap rate
- 16.07%
- Cash-on-cash
- 34.92%
- DSCR
- 2.55
- GRM
- 4.4
CMA / ARV
- ARV (on-the-fly)
- $69,064
- Comps found
- 4
Show comp detail 4 sales within ~0.75 mi
| Address | Dist | Beds/Ba | Sqft | Sold | Price | $/sf | Match |
|---|---|---|---|---|---|---|---|
| 220 Spruce St | 0.33mi | 1/1.0 | 800 (+3%) | 12mo | $15,000 | $19 | 70 |
| 507 Fulton St | 0.43mi | 2/1.0 (+1) | 826 (+6%) | 13mo | $85,000 | $103 | 53 |
| 205 Violet St | 0.62mi | 2/1.0 (+1) | 700 (-10%) | 1mo | $45,500 | $65 | 49 |
| 140 Chestnut St | 0.45mi | 2/1.0 (+1) | 884 (+14%) | 6mo | $79,000 | $89 | 46 |
Match score weights: distance 35% · size 25% · config 20% · recency 20%. Top-matched comps best support the ARV.
Projected returns pro-forma
-3.0% appreciation · 3.0% rent growth · sell at horizon
- IRR
- 30.5%
- Equity multiple
- 2.28×
- Total profit
- $16,040
- Equity at exit
- $6,695
- IRR
- 37.7%
- Equity multiple
- 4.50×
- Total profit
- $44,026
- Equity at exit
- $3,882
Cash invested: $12,572 (down + closing). Projections, not guarantees.
Landlord ↔ Tenant lean methodology
- Overall (STATE)
- 83 Strongly Landlord-Friendly
- State West Virginia
- 83 Strongly Landlord-Friendly · R+22
- County
- — inherits STATE
- City
- — inherits STATE
ZIP-level market 26554
- Home prices YoY
- -11.3%
- Active inventory
- 151
- Price-to-rent
- 4.4×
Monthly cashflow live
- Estimated rent
- $856 medium interval (Pro) →
- Mortgage (P&I)
- −$235
- Tax est. 1.5%
- −$56 /mo · $674/yr
- Insurance
- −$19
- HOA
- −$0
- Vacancy / Maint / Mgmt
- −$180
- Net cashflow
- $366
Break-even live
UW: 25.0% down · 7.5% · 30yr · 1.5% tax · 5.0% vac · 8.0% maint · 8.0% mgmt
Financing live
Cash to close
- Down payment
- $11,225
- Closing costs
- $1,347
- Reserves months
- —
- Total cash needed
- —
Loan-product check · same deal, 3 products live
Conventional
25% down · 7.5% · 30yr
- Down + closing
- —
- Monthly P&I
- —
- Monthly cashflow
- —
- DSCR
- —
- Eligible?
- —
Personal DTI + credit; lowest rate.
DSCR
20% down · 8.5% · 30yr
- Down + closing
- —
- Monthly P&I
- —
- Monthly cashflow
- —
- DSCR
- —
- Eligible?
- —
No personal income docs; deal must DSCR.
Hard money
10% down · 12.0% · 12mo
- Down + closing
- —
- Monthly P&I
- —
- Monthly cashflow
- —
- DSCR
- —
- Eligible?
- —
Short-term bridge; refi at stabilization.
Listing history 17 events
-
2026-06-19days on market $44,900 Active 109 DOM
-
2026-06-18days on market $44,900 Active 108 DOM
-
2026-06-17days on market $44,900 Active 107 DOM
-
2026-06-16days on market $44,900 Active 106 DOM
-
2026-06-15days on market $44,900 Active 105 DOM
-
2026-06-14days on market $44,900 Active 103 DOM
-
2026-06-13days on market $44,900 Active 102 DOM
-
2026-06-10days on market $44,900 Active 100 DOM
-
2026-06-09days on market $44,900 Active 99 DOM
-
2026-06-08days on market $44,900 Active 98 DOM
-
2026-06-07days on market $44,900 Active 97 DOM
-
2026-06-02days on market $44,900 Active 92 DOM
-
2026-06-01days on market $44,900 Active 91 DOM
-
2026-05-31days on market $44,900 Active 90 DOM
-
2026-05-30days on market $44,900 Active 89 DOM
-
2026-05-18price $44,900
-
2026-03-02$49,900 Active
ⓘ Source: listings_history table (triggers on properties + properties_extension) + one-shot
backfill from property_details.listing_events for pre-trigger history.
Climate risk First Street
- Flood 1/10 Low FEMA zone X (unshaded) · 0% chance over 30 yrs
- Wildfire 1/10 Low
- Heat 4/10 Moderate 7 d/yr ≥99°F today · 19 d/yr by 30 yrs out
- Wind 1/10 Low
- Air quality 2/10 Low 1 unhealthy d/yr today · 2 by 30 yrs out
Nearby sold comps map
Loading sold comps map…
Walkable amenities ~0.75 mi
Loading nearby amenities…
Taxation est. · year 1
- Rental income
- $10,271
- − Mortgage interest
- −$2,515
- − Property taxes
- −$674
- − Insurance
- −$224
- − Repairs & maintenance
- −$822
- − Management
- −$822
- − Depreciation
- −$1,306
- Taxable income
- $3,908
- Est. tax owed @ 24.0%
- −$938
- After-tax cash flow
- $3,453/yr
For passive investors: Depreciation is non-cash, so a rental often shows a tax loss while cash-flowing — sheltering income. Rental losses are passive: they offset passive income freely, and up to $25,000/yr can offset ordinary (W-2) income if you actively participate and your MAGI is under $100k (phasing out to $0 by $150k); unused losses carry forward. On sale, claimed depreciation is recaptured at up to 25%, and gains may owe capital-gains tax (a 1031 exchange can defer both). Figures are a year-1 estimate at your 24.0% rate — not tax advice; consult a CPA.
Schools (NCES district)
- District
- Marion County Schools
- NCES district ID
- 5400720
- Math proficiency
- 30% ▼ -14.00%
- Reading proficiency
- 43% ▼ -8.00%
- Median HH income
- $42,195
- Composite
- 30.8/100
- National rank
- #6145
- State rank
- #11 of 55 in WV
Livability — Fairmont
- Score
- 70/100
- State rank
- #64
- US rank
- #8054
Category grades
Schools grade is shown separately in the Schools card above.
Census & demographics
- Census place
- Fairmont, WV
- Population (ZIP)
- 42,116
Population outlook (Marion County) Hauer SSP2
- Today (2025)
- 56,923 people
- By 2030
- 56,850 · -0.1%
- By 2040
- 56,469 · -0.8%
- By 2050
- 56,027 · -1.6%
- By 2075
- 55,509 · -2.5%
- By 2100
- 51,082 · -10.3%
Race, ethnicity, and origin ACS 2023
- Neighborhood character
- Predominantly White (90%)
- Race & ethnicity
- White 90% Two or more races 5% Black 3% Hispanic / Latino 2%
- Common ancestry
- Romanian 3% Slovak 2% Iranian 2%
- Foreign-born
- 1%
- Languages at home
- 98% English-only · Spanish 1%
Political lean MEDSL · Marion
- 2024 margin
- Solid R (+31.2) · D 33.2% · R 64.5% · Other 2.3%
- 2008→2024 swing
- -31.7pp toward R · 2008: 0.5pp · 2024: -31.2pp
- All cycles
- 2024: R+31.2 2020: R+28.7 2016: R+33.5 2012: R+14.4 2008: D+0.5
Not yet ingested
- Civics
- —
Market trends
- HPI YoY
- ▼ -30.86%
- Current HPI
- 240.9967
- Rent YoY
- —
- Metro
- —
- State GDP YoY
- —
- F500 in state
- 0
Price history
-10.0% since first listed2 events — show timeline
- 2026-05-18 Price Changed $44,900 NCWVREIN
- 2026-03-02 Listed $49,900 NCWVREIN
Cash-flow waterfall
monthlySold comps — $/sqft
last 12 mo · ≤1 miLoading sold comps…