 🏷️ Likely Rental
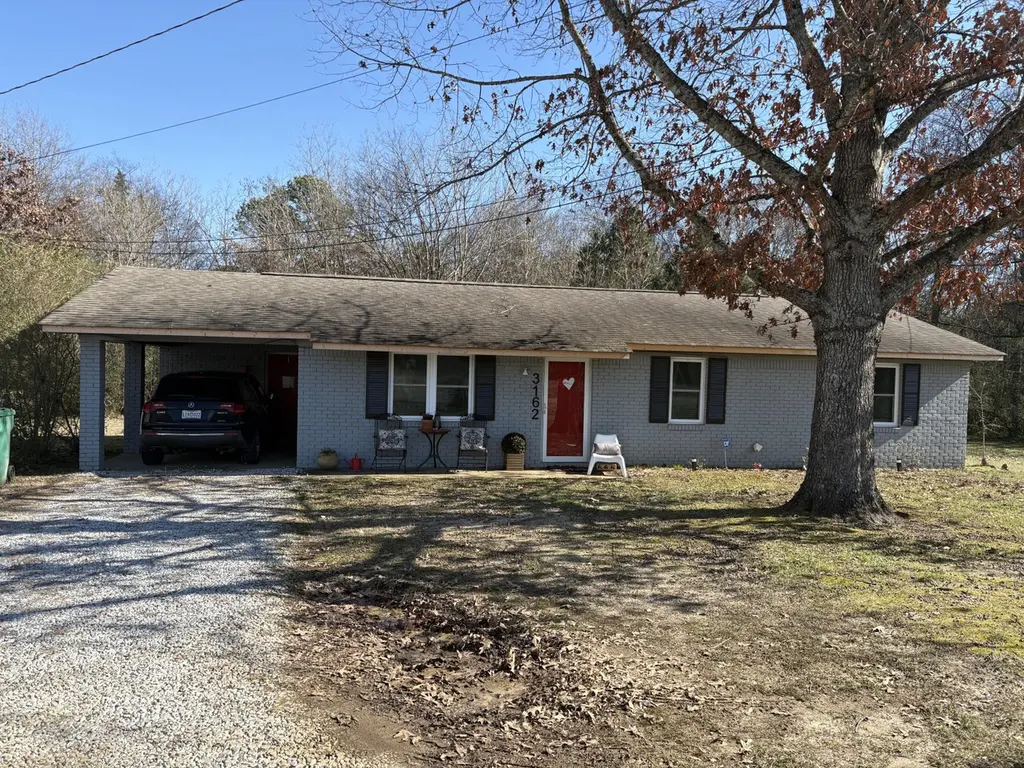
3162 Walsh Road Rd · Tupelo, MS
Flood risk 1/10 · Minimal
- FEMA flood zone
- X (unshaded)
- Chance of flooding over 30 yrs
- 0.0%
- Est. flood insurance / yr
- $507 – $1,088
Fire risk 4/10 · Minor
- Est. fire insurance / yr
- $1,241 – $2,305
Heat risk 6/10 · Moderate
- Hot days now (above 108°F)
- 7 days/yr
- Hot days in 30 yrs
- 21 days/yr
Wind risk 5/10 · Moderate
- Chance of severe wind over 30 yrs
- 26.0%
Air-quality risk 1/10 · Minimal
- Unhealthy air days now
- 0 days/yr
- Unhealthy air days in 30 yrs
- 0 days/yr
Risk factors via First Street. Map © Google.
Why this score? — see what drove the C+ grade
The composite is a weighted blend of 9 inputs, each scored 0–100. Each bar is that input's sub-score; the figure is the points it added to the 100-point composite (weight × sub-score).
- Cash flow +21.5/30.0
- ARV discount +15.0/15.0
- DSCR +6.9/10.0
- 1% rule +4.9/10.0
- Schools +3.7/10.0
- Livability +3.6/5.0
- Rent growth +2.5/5.0
- Condition / age +2.5/5.0
- Appreciation +0.0/10.0
$169,900
🖨 Deal sheet 📄 Offer letter ✓ Due diligence
Listing remarks MLS
Great opportunity for investors or first -time home buyers! This tenant occupied property features central HVAC and is well maintained. All it needs is your personal touch to make it your own! Don't miss the chance to add this versatile property to your portfolio! Agents please see private remarks.
Key facts
- Central hvac
- Versatile property
- Well maintained
Tags
Neighborhood map
What this means for you Summary
Snapshot
- This is a 3-bed/0.5-bath single-family listed at $170k.
Deal economics
- At list price, monthly cash flow is $256 ($3k/yr) — positive.
- The deal already cash-flows at list — no discount required.
- To meet the 1% rule (rent ≥ 1% of price), the offer needs to be $168k (1.3% below list).
- Recommended offer: $150k (12.0% below list) — sets the bar for market timing.
Location & tenants
- Location reads 72/100 on livability (#26 in MS) — a middle-class / working-renter tenant base. Strengths: cost of living A+, housing A+, health & safety A-; Watch: schools C-, amenities D+, employment D+.
- Tupelo Public School District (town): math 46% / reading 42% proficiency, ranked #28 of 130 in MS (top 22%) — families likely to look elsewhere, expect single-tenant / working-renter base with shorter leases.
- Market conditions: 46 active listings in the ZIP; solid renter incomes; 154 units permitted in Lee County in 2024 (24 in 5+ unit buildings).
Forward outlook
- Local home prices are declining (-3.0%/yr); year-one equity from $1k of loan paydown is wiped out by about $5k of value loss. Plan a longer hold.
- Lee County population projected at +6% by 2050 — modest demand growth; plan on rents tracking national, not racing it.
Negotiation context
- It's been on market 151 days — a 12% lower offer ($150k) is reasonable based on typical stale-listing flexibility.
- 2 sale attempts since 11y ago; this cycle's ask has dropped $10k (6%) from the opening price — seller is motivated, your offer sets the floor, not the list.
Risks & watch-outs
- Climate carrying-cost: moderate wind risk, 26% chance of damaging wind over 30y; extreme-heat days projected 7→21/yr by 2055 (HVAC capex compounding) — expect insurance premiums to compound above CPI over the hold.
Questions for the listing agent
- It's been on market 151 days. Have you received any prior offers? Is the seller open to a 12% concession, seller financing, or rate buy-down credit?
- Why hasn't it sold? Are there any deal-killer items the seller is aware of (foundation, flood, title, zoning, code violations)?
- Is there a deadline driving the sale (1031 exchange, divorce, estate, relocation)? That informs how much negotiation room exists.
- Crime grade is F in this area — have there been break-ins, vandalism, or insurance claims at this property in the last 3 years? What carrier currently insures it and at what premium?
- What's the average days-on-market for RENTAL listings here right now (not sales)? A rising rental-DOM trend means longer vacancies and softer asking-rent achievability than the comps imply.
- What's the recent tenant-quality profile in this submarket — average credit score on applications, eviction rate, late-payment / NSF rate, and stable-employment percentage? A property-management company in the area should have these aggregated.
- How much new for-sale + rental construction is in the pipeline within 1–3 miles? Heavy new supply typically softens prices + rents 12–24 months out; constrained supply supports both.
Investment metrics
- 1% rule
- 0.99% ✗
- Cap rate
- 8.10%
- Cash-on-cash
- 6.46%
- DSCR
- 1.29
- GRM
- 8.4
CMA / ARV
- ARV (median comp)
- $268,872
- List price
- $169,900
- Delta
- -36.81%
- Verdict
- UNDERPRICED
- Comps
- 6 within 1.0 mi
Projected returns pro-forma
-3.0% appreciation · 3.0% rent growth · sell at horizon
- IRR
- -6.4%
- Equity multiple
- 0.76×
- Total profit
- $-11,271
- Equity at exit
- $25,333
- IRR
- 3.2%
- Equity multiple
- 1.23×
- Total profit
- $11,013
- Equity at exit
- $14,690
Cash invested: $47,572 (down + closing). Projections, not guarantees.
Landlord ↔ Tenant lean methodology
- Overall (STATE)
- 90 Strongly Landlord-Friendly
- State Mississippi
- 90 Strongly Landlord-Friendly · R+11
- County
- — inherits STATE
- City
- — inherits STATE
ZIP-level market 38826
- Home prices YoY
- -5.7%
- Active inventory
- 46
- Price-to-rent
- 8.4×
Monthly cashflow live
- Estimated rent
- $1,677 medium interval (Pro) →
- Mortgage (P&I)
- −$891
- Tax from tax record
- −$107 /mo · $1,282/yr
- Insurance
- −$71
- HOA
- −$0
- Vacancy / Maint / Mgmt
- −$352
- Net cashflow
- $256
Break-even live
UW: 25.0% down · 7.5% · 30yr · 1.5% tax · 5.0% vac · 8.0% maint · 8.0% mgmt
Financing live
Cash to close
- Down payment
- $42,475
- Closing costs
- $5,097
- Reserves months
- —
- Total cash needed
- —
Loan-product check · same deal, 3 products live
Conventional
25% down · 7.5% · 30yr
- Down + closing
- —
- Monthly P&I
- —
- Monthly cashflow
- —
- DSCR
- —
- Eligible?
- —
Personal DTI + credit; lowest rate.
DSCR
20% down · 8.5% · 30yr
- Down + closing
- —
- Monthly P&I
- —
- Monthly cashflow
- —
- DSCR
- —
- Eligible?
- —
No personal income docs; deal must DSCR.
Hard money
10% down · 12.0% · 12mo
- Down + closing
- —
- Monthly P&I
- —
- Monthly cashflow
- —
- DSCR
- —
- Eligible?
- —
Short-term bridge; refi at stabilization.
Listing history 21 events
-
2026-06-19days on market $169,900 Active 151 DOM
-
2026-06-18days on market $169,900 Active 150 DOM
-
2026-06-17days on market $169,900 Active 149 DOM
-
2026-06-16days on market $169,900 Active 148 DOM
-
2026-06-15days on market $169,900 Active 147 DOM
-
2026-06-14days on market $169,900 Active 145 DOM
-
2026-06-12days on market $169,900 Active 144 DOM
-
2026-06-09days on market $169,900 Active 141 DOM
-
2026-06-08days on market $169,900 Active 140 DOM
-
2026-06-07days on market $169,900 Active 139 DOM
-
2026-06-05days on market $169,900 Active 136 DOM
-
2026-06-03days on market $169,900 Active 135 DOM
-
2026-06-02days on market $169,900 Active 134 DOM
-
2026-06-01days on market $169,900 Active 133 DOM
-
2026-05-31days on market $169,900 Active 132 DOM
-
2026-05-30days on market $169,900 Active 131 DOM
-
2026-05-04price $169,900 299-char remark
Show marketing remark (299 chars)
Great opportunity for investors or first -time home buyers! This tenant occupied property features central HVAC and is well maintained. All it needs is your personal touch to make it your own! Don't miss the chance to add this versatile property to your portfolio! Agents please see private remarks.
-
2026-01-20$179,900 Active 299-char remark
Show marketing remark (299 chars)
Great opportunity for investors or first -time home buyers! This tenant occupied property features central HVAC and is well maintained. All it needs is your personal touch to make it your own! Don't miss the chance to add this versatile property to your portfolio! Agents please see private remarks.
-
2015-08-07soldstatus 64-char remark
Show marketing remark (64 chars)
Great investment property or first time home owners. Sold as is.
-
2015-07-23soldstatus
-
2015-02-17$40,000 64-char remark
Show marketing remark (64 chars)
Great investment property or first time home owners. Sold as is.
ⓘ Source: listings_history table (triggers on properties + properties_extension) + one-shot
backfill from property_details.listing_events for pre-trigger history.
Tax reassessment forecast MS · Resets to sale price
- Current annual tax
- $1,282 · $107/mo
- Projected year-2 tax
- $1,342 · $112/mo
- Expected delta
- +$61/yr (+$5/mo · 4.7%)
ⓘ Screening estimate from a state-policy table — verify with the county assessor before closing.
Climate risk First Street
- Flood 1/10 Low FEMA zone X (unshaded) · 0% chance over 30 yrs
- Wildfire 4/10 Moderate
- Heat 6/10 Major 7 d/yr ≥108°F today · 21 d/yr by 30 yrs out
- Wind 5/10 Major 26% chance of damaging wind over 30 yrs
- Air quality 1/10 Low 0 unhealthy d/yr today · 0 by 30 yrs out
Nearby sold comps map
Loading sold comps map…
Walkable amenities ~0.75 mi
Loading nearby amenities…
Taxation est. · year 1
- Rental income
- $20,119
- − Mortgage interest
- −$9,517
- − Property taxes
- −$1,282
- − Insurance
- −$850
- − Repairs & maintenance
- −$1,610
- − Management
- −$1,610
- − Depreciation
- −$4,943
- Taxable income
- $309
- Est. tax owed @ 24.0%
- −$74
- After-tax cash flow
- $2,997/yr
For passive investors: Depreciation is non-cash, so a rental often shows a tax loss while cash-flowing — sheltering income. Rental losses are passive: they offset passive income freely, and up to $25,000/yr can offset ordinary (W-2) income if you actively participate and your MAGI is under $100k (phasing out to $0 by $150k); unused losses carry forward. On sale, claimed depreciation is recaptured at up to 25%, and gains may owe capital-gains tax (a 1031 exchange can defer both). Figures are a year-1 estimate at your 24.0% rate — not tax advice; consult a CPA.
Schools (NCES district)
- District
- Tupelo Public School District
- NCES district ID
- 2804320
- Math proficiency
- 46% ▼ -13.00%
- Reading proficiency
- 42% ▼ -7.00%
- Median HH income
- $44,002
- Composite
- 37.26/100
- National rank
- #4456
- State rank
- #28 of 130 in MS
Livability — Tupelo
- Score
- 72/100
- State rank
- #26
- US rank
- #6369
Category grades
Schools grade is shown separately in the Schools card above.
Census & demographics
- Census place
- Tupelo, MS
- County
- Lee County · 52,445 people
- City population
- 46,551
- Metro
- Tupelo, MS
- Population (ZIP)
- 5,894
- Household income
- $75,862
- Rent vs Own
- Severe rent burden
- 51.0
Population outlook (Lee County) Hauer SSP2
- Today (2025)
- 90,253 people
- By 2030
- 92,125 · +2.1%
- By 2040
- 94,914 · +5.2%
- By 2050
- 95,841 · +6.2%
- By 2075
- 94,189 · +4.4%
- By 2100
- 83,736 · -7.2%
Race, ethnicity, and origin ACS 2023
- Neighborhood character
- Predominantly White (71%)
- Race & ethnicity
- White 71% Black 17% Hispanic / Latino 4% Pacific Islander 4% Two or more races 3% Asian 2%
- Common ancestry
- Slovak 3% Italian 2% Serbian 2%
- Foreign-born
- 2% · South Korea
- Languages at home
- 94% English-only · Tagalog/Filipino 4% Korean 2%
Political lean MEDSL · Lee
- 2024 margin
- Solid R (+38.8) · D 30.0% · R 68.9% · Other 1.1%
- 2008→2024 swing
- -8.3pp toward R · 2008: -30.5pp · 2024: -38.8pp
- All cycles
- 2024: R+38.8 2020: R+32.5 2016: R+37.7 2012: R+29.0 2008: R+30.5
Not yet ingested
- Civics
- —
Market trends
- HPI YoY
- ▼ -10.53%
- Current HPI
- 173.5682
- Rent YoY
- —
- Metro
- Tupelo, MS
- State GDP YoY
- —
- F500 in state
- 0
Price history
+324.8% since first listed5 events — show timeline
- 2026-05-04 Price Changed $169,900 NEMSBD
- 2026-01-20 Listed $179,900 NEMSBD
- 2015-08-07 Sold (MLS) — NEMSBD
- 2015-07-23 Sold (Public Records) — Public Records
- 2015-02-17 Listed $40,000 NEMSBD
Property tax history
+3.3%/yrLatest (2025): $1,282 · +1.5% YoY. Source: county tax records.
Cash-flow waterfall
monthlySold comps — $/sqft
last 12 mo · ≤1 miLoading sold comps…