5912 Palm Ln Unit C36 · Bayshore Gardens, FL
Flood risk 1/10 · Minimal
- FEMA flood zone
- X (unshaded)
- Chance of flooding over 30 yrs
- 0.0%
- Est. flood insurance / yr
- $507 – $1,088
Fire risk 1/10 · Minimal
- Est. fire insurance / yr
- $947 – $1,759
Heat risk 10/10 · Severe
- Hot days now (above 106°F)
- 7 days/yr
- Hot days in 30 yrs
- 30 days/yr
Wind risk 10/10 · Severe
- Chance of severe wind over 30 yrs
- 99.0%
Air-quality risk 2/10 · Minimal
- Unhealthy air days now
- 1 days/yr
- Unhealthy air days in 30 yrs
- 2 days/yr
Risk factors via First Street. Map © Google.
Why this score? — see what drove the C+ grade
The composite is a weighted blend of 9 inputs, each scored 0–100. Each bar is that input's sub-score; the figure is the points it added to the 100-point composite (weight × sub-score).
- Cash flow +26.0/30.0
- 1% rule +10.0/10.0
- DSCR +8.8/10.0
- ARV discount +7.5/15.0
- Schools +4.4/10.0
- Livability +4.1/5.0
- Condition / age +2.5/5.0
- Rent growth +1.1/5.0
- Appreciation +0.0/10.0
$69,900
🖨 Deal sheet 📄 Offer letter ✓ Due diligence
Listing remarks
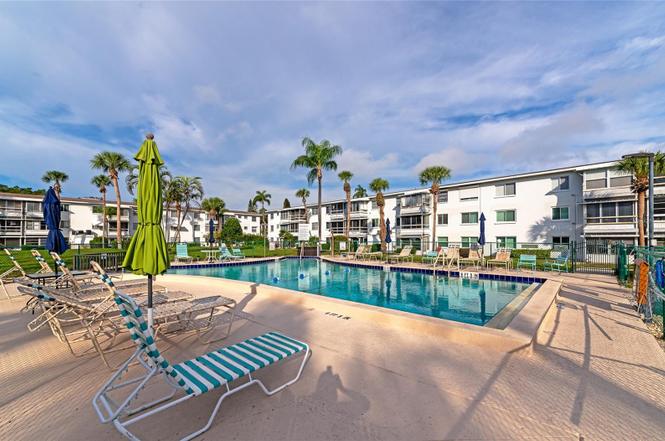
NEW PRICE! TURNKEY FURNISHED top floor unit! YES there is an ELEVATOR! Enjoy the amazing Florida lifestyle at a price you can afford. One bedroom, one bathroom, and comes with everything you need--just bring your toothbrush! Low HOA just $246/mo and includes basic cable/internet. Relaxed living space with a full kitchen, dining, and living room, and a sitting room with a nice view of the courtyard & pool. Bayshore Condominiums have long been regarded as one of the area's best places to live, and the tradition continues today! Close to major shopping, dining, the airport, and world-renowned beaches. Must be 55 or older. Association does accommodate ESA pets, must apply for approva
Key facts
- Major shopping
- Elevator
- Airport
Tags
Property features AI
Finance
- Other: Lease restrictions apply
- Financial info: Monthly condo fees: $246 (total monthly fees listed as $246); Total annual association fees: $2,952
- HOA & community: Monthly condo fee: $246 (includes cable TV, common area taxes, pool, escrow reserves, structure and grounds maintenance, management); Association requires approval; Association amenities: pool, clubhouse, recreation facilities, shuffleboard court, laundry, storage, maintenance; Senior community; Pets not allowed; Association fee paid monthly
Exterior
- Parking: Assigned parking
- Utilities: Public water; Public sewer; Electricity connected; Cable available; Broadband/high-speed internet available; Underground utilities; Water connected
- Home design: Residential condominium; Unit on 3rd floor; East-facing; One level (within the unit)
- Construction: Block construction; Other roof; Block foundation; Building identified as C 36; Three-story building
- Exterior features: Sidewalk; Storage
Interior
- Kitchen: Range; Refrigerator
- Bedrooms: 1 bedroom
- Flooring: Carpet; Ceramic tile
- Bathrooms: 1 full bathroom
- Heating & cooling: Ductless heating; Wall/window air conditioning units
- Interior features: Ceiling fans; Window treatments (blinds and drapes); Elevator access in building
- Laundry & utility: Common area laundry
Neighborhood map
What this means for you Summary
Snapshot
- This is a 1-bed/1.0-bath condo listed at $70k.
Deal economics
- At list price, monthly cash flow is $175 ($2k/yr) — positive.
- The deal already cash-flows at list — no discount required.
- Meets the 1% rule at list price ($1k rent vs $70k).
- Recommended offer: $62k (12.0% below list) — sets the bar for market timing.
- Cap rate 9.3% vs local median 4.7% in Bayshore Gardens — top-decile yield for the area; either an underpriced asset or a hidden risk that comps aren't pricing in. Stress-test before assuming the spread holds.
Location & tenants
- Location reads 82/100 on livability (#72 in FL, #1,180 nationally) — a professional / high-income tenant draw. Strengths: cost of living A+, housing A+, health & safety A+; Watch: crime C-, commute C-, schools F.
- Manatee (suburban): math 54% / reading 50% proficiency, ranked #26 of 73 in FL (top 36%) — acceptable for families but not a draw, mixed tenant base, ~2y average lease.
- Market conditions: Rents falling (-5.5%/yr); 361 active listings in the ZIP; 28 comparable units currently listed for rent nearby; rentals at typical pace (median 24d on market — plan ~3-4 weeks tenant-placement turnaround); 7,472 units permitted in Manatee County in 2024 (1,782 in 5+ unit buildings).
- This rent runs 31% of the median local income ($45k/yr) — at the standard rent-burdened threshold; future hikes will face affordability resistance.
Forward outlook
- Local home prices are declining (-3.0%/yr); year-one equity from $483 of loan paydown is wiped out by about $2k of value loss. Plan a longer hold.
- Manatee County population projected at +43% by 2050 — long-run rental-demand tailwind backs the buy-and-hold thesis.
Negotiation context
- It's been on market 316 days — a 12% lower offer ($62k) is reasonable based on typical stale-listing flexibility.
- 3 sale attempts; this cycle's ask has dropped $15k (18%) from the opening price — seller is motivated, your offer sets the floor, not the list.
- Current owner paid $24k; list at $70k implies a 194% gain — meaningful room to come down on a strong offer.
Risks & watch-outs
- Watch-outs: HOA is 21% of rent.
- Climate carrying-cost: severe wind risk, 99% chance of damaging wind over 30y; extreme-heat days projected 7→30/yr by 2055 (HVAC capex compounding) — expect insurance premiums to compound above CPI over the hold.
Questions for the listing agent
- It's been on market 316 days. Have you received any prior offers? Is the seller open to a 12% concession, seller financing, or rate buy-down credit?
- Built in 1970 — when were the roof, HVAC, electrical panel, plumbing, and water heater last replaced?
- What does the HOA fee cover, when was the last increase, and are there any pending special assessments or reserve-fund shortfalls?
- Any open or pending special assessments — roof, HVAC, plumbing, elevator, façade? What's the per-unit balance and payoff schedule, and is the seller paying it off at close or rolling it to the buyer?
- Why hasn't it sold? Are there any deal-killer items the seller is aware of (foundation, flood, title, zoning, code violations)?
- Is there a deadline driving the sale (1031 exchange, divorce, estate, relocation)? That informs how much negotiation room exists.
- Schools are F-rated, which usually means shorter tenancies and higher turnover. Who's the typical renter profile here, and what's been the actual vacancy rate?
- What's the average days-on-market for RENTAL listings here right now (not sales)? A rising rental-DOM trend means longer vacancies and softer asking-rent achievability than the comps imply.
- What's the recent tenant-quality profile in this submarket — average credit score on applications, eviction rate, late-payment / NSF rate, and stable-employment percentage? A property-management company in the area should have these aggregated.
- How much new apartment / multifamily construction is in the pipeline within 1–3 miles? Heavy new supply (>2% of stock underway) typically softens rents 12–24 months out; light construction supports rent growth.
Investment metrics
- 1% rule
- 1.66% ✓
- Cap rate
- 9.29%
- Cash-on-cash
- 10.71%
- DSCR
- 1.48
- GRM
- 5.0
CMA / ARV
No comps found within radius.
Projected returns pro-forma
-3.0% appreciation · 0.0% rent growth · sell at horizon
- IRR
- -4.9%
- Equity multiple
- 0.82×
- Total profit
- $-3,429
- Equity at exit
- $10,422
- IRR
- -1.0%
- Equity multiple
- 0.94×
- Total profit
- $-1,098
- Equity at exit
- $6,044
Cash invested: $19,572 (down + closing). Projections, not guarantees.
Landlord ↔ Tenant lean methodology
- Overall (STATE)
- 87 Strongly Landlord-Friendly
- State Florida
- 87 Strongly Landlord-Friendly · R+3
- County
- — inherits STATE
- City
- — inherits STATE
ZIP-level market 34207
- Rents YoY
- -5.5%
- Active inventory
- 361
- Price-to-rent
- 5.0×
Monthly cashflow live
- Estimated rent
- $1,162 high interval (Pro) →
- Mortgage (P&I)
- −$367
- Tax from tax record
- −$101 /mo · $1,218/yr
- Insurance
- −$29
- HOA
- −$246
- Vacancy / Maint / Mgmt
- −$244
- Net cashflow
- $175
Break-even live
UW: 25.0% down · 7.5% · 30yr · 1.5% tax · 5.0% vac · 8.0% maint · 8.0% mgmt
Financing live
Cash to close
- Down payment
- $17,475
- Closing costs
- $2,097
- Reserves months
- —
- Total cash needed
- —
Loan-product check · same deal, 3 products live
Conventional
25% down · 7.5% · 30yr
- Down + closing
- —
- Monthly P&I
- —
- Monthly cashflow
- —
- DSCR
- —
- Eligible?
- —
Personal DTI + credit; lowest rate.
DSCR
20% down · 8.5% · 30yr
- Down + closing
- —
- Monthly P&I
- —
- Monthly cashflow
- —
- DSCR
- —
- Eligible?
- —
No personal income docs; deal must DSCR.
Hard money
10% down · 12.0% · 12mo
- Down + closing
- —
- Monthly P&I
- —
- Monthly cashflow
- —
- DSCR
- —
- Eligible?
- —
Short-term bridge; refi at stabilization.
Rent comps 28 comps
| Address | Beds | Baths | Sqft | Rent | $/sqft | DOM | Units | Dist |
|---|---|---|---|---|---|---|---|---|
| 5955 Palm Ln Unit A33 Bradenton, FL | 2.0 | 1.0 | 744 | $1,150 | $1.55 | 14d | 1 | 0.01mi |
| 5858 Welcome Rd Unit J23 Bradenton, FL | 2.0 | 1.0 | 744 | $1,150 | $1.55 | 3d | 1 | 0.05mi |
| 2028 Canal Dr Unit M26 Bradenton, FL | 1.0 | 1.0 | 576 | $1,050 | $1.82 | 10d | 1 | 0.05mi |
| 1874 Sunny Dr Unit F32 Bradenton, FL | 2.0 | 1.0 | 744 | $950 | $1.28 | 23d | 1 | 0.05mi |
| 1875 Sunny Dr Unit G32 Bradenton, FL | 1.0 | 1.0 | 576 | $1,100 | $1.91 | 23d | 1 | 0.08mi |
| 1859 Restful Dr Unit L26 Bradenton, FL | 1.0 | 1.0 | 576 | $1,150 | $2.00 | 23d | 1 | 0.10mi |
| 1825 Flamingo Blvd Unit O26 Bradenton, FL | 1.0 | 1.0 | 576 | $1,000 | $1.74 | 23d | 1 | 0.14mi |
| 1839 Sunny Dr Unit E36 Bradenton, FL | 1.0 | 1.0 | 576 | $1,350 | $2.34 | 23d | 1 | 0.14mi |
| 1807 Restful Dr Unit N4 Bradenton, FL | 2.0 | 1.0 | 733 | $1,150 | $1.57 | 3d | 1 | 0.15mi |
| 5888 17th St W Unit C23 Bradenton, FL | 1.0 | 1.0 | 576 | $1,100 | $1.91 | 23d | 1 | 0.16mi |
| 5908 17th St W Unit C36 Bradenton, FL | 1.0 | 1.0 | 576 | $950 | $1.65 | 16d | 1 | 0.19mi |
| 2547 60th Ave W Unit L-36 Bradenton, FL | 1.0 | 1.0 | 576 | $1,100 | $1.91 | 16d | 1 | 0.20mi |
| 1566 Pleasant Rd Unit J24 Bradenton, FL | 2.0 | 1.0 | 733 | $1,150 | $1.57 | 23d | 1 | 0.24mi |
| 5531 16th St W Unit 5537 Bradenton, FL | 2.0 | 1.0 | 750 | $1,650 | $2.20 | 3d | 1 | 0.53mi |
| 5400 26th St W Bradenton, FL | 1.0–2.0 | 1.0–2.0 | 902 | $1,358 | $1.50 | 23d | 1 | 0.83mi |
| 5310 26th St W Bradenton, FL | 1.0–2.0 | 1.0 | 789 | $1,250 | $1.58 | 3d | 4 | 0.84mi |
| 5310 26th St W Bradenton, FL | 1.0–2.0 | 1.0 | 789 | $1,250 | $1.58 | 19d | 5 | 0.84mi |
| 5310 26th St W Bradenton, FL | 1.0–2.0 | 1.0 | 789 | $1,250 | $1.58 | 11d | 5 | 0.84mi |
| 6050 34th St W Bradenton, FL | 1.0–2.0 | 1.0 | 734 | $1,185 | $1.61 | 1d | 19 | 0.91mi |
| 2803 52nd Avenue Dr W Unit 2803 Bradenton, FL | 2.0 | 1.0 | 750 | $1,599 | $2.13 | 23d | 1 | 1.04mi |
| 5001 22nd St W Unit B Bradenton, FL | 2.0 | 1.0 | 729 | $1,700 | $2.33 | 16d | 1 | 1.20mi |
| 6916 Marlin Ln Bradenton, FL | 2.0 | 1.0 | 430 | $1,250 | $2.91 | 23d | 1 | 1.28mi |
| 915 50th Avenue Plz W Bradenton, FL | 2.0 | 1.0 | 700 | $1,200 | $1.71 | 23d | 1 | 1.31mi |
| 2835 50th Ave W Bradenton, FL | 1.0–2.0 | 1.0–2.0 | 850 | $1,269 | $1.49 | 3d | 16 | 1.33mi |
| 205 52nd Avenue Dr W Bradenton, FL | 1.0 | 1.0 | 528 | $1,200 | $2.27 | 23d | 1 | 1.41mi |
| 707 50th Ave W Bradenton, FL | 2.0 | 1.0 | 730 | $1,150 | $1.58 | 23d | 1 | 1.44mi |
| 110 52nd Avenue Ter E Bradenton, FL | 2.0 | 1.5 | 684 | $1,450 | $2.12 | 23d | 1 | 1.49mi |
| 4705 27th St W Unit A Bradenton, FL | 2.0 | 1.0 | 750 | $1,325 | $1.77 | 3d | 1 | 1.50mi |
HOA detail condo
- Monthly dues
- $246 · $2,952/yr
- Likely covers
- internetcablepool
- Assessments
- None detected in remarks — confirm with the listing agent.
Listing history 24 events
-
2026-06-18days on market $69,900 Active 316 DOM
-
2026-06-17days on market $69,900 Active 315 DOM
-
2026-06-16days on market $69,900 Active 314 DOM
-
2026-06-15days on market $69,900 Active 313 DOM
-
2026-06-13days on market $69,900 Active 311 DOM
-
2026-06-13days on market $69,900 Active 310 DOM
-
2026-06-10days on market $69,900 Active 308 DOM
-
2026-06-09days on market $69,900 Active 307 DOM
-
2026-06-08days on market $69,900 Active 306 DOM
-
2026-06-08days on market $69,900 Active 305 DOM
-
2026-06-03days on market $69,900 Active 301 DOM
-
2026-06-02days on market $69,900 Active 300 DOM
-
2026-06-01days on market $69,900 Active 299 DOM
-
2026-05-31days on market $69,900 Active 298 DOM
-
2026-04-30price $69,900
-
2026-03-13price $74,900
-
2026-01-22price $75,000
-
2026-01-11status Active
-
2026-01-05status Active
-
2025-12-31historical
-
2025-07-26$85,000 Active
-
1998-06-02soldstatus $23,800
-
1986-01-01soldstatus $25,000
-
1978-02-01soldstatus $18,000
ⓘ Source: listings_history table (triggers on properties + properties_extension) + one-shot
backfill from property_details.listing_events for pre-trigger history.
Tax reassessment forecast FL · Resets to sale price
- Current annual tax
- $1,218 · $101/mo
- Projected year-2 tax
- $1,218 · $101/mo
- Expected delta
- $0/yr ($0/mo · -0.0%)
ⓘ Screening estimate from a state-policy table — verify with the county assessor before closing.
Climate risk First Street
- Flood 1/10 Low FEMA zone X (unshaded) · 0% chance over 30 yrs
- Wildfire 1/10 Low
- Heat 10/10 Extreme 7 d/yr ≥106°F today · 30 d/yr by 30 yrs out
- Wind 10/10 Extreme 99% chance of damaging wind over 30 yrs
- Air quality 2/10 Low 1 unhealthy d/yr today · 2 by 30 yrs out
Nearby sold comps map
Loading sold comps map…
Walkable amenities ~0.75 mi
Loading nearby amenities…
Taxation est. · year 1
- Rental income
- $13,942
- − Mortgage interest
- −$3,915
- − Property taxes
- −$1,218
- − Insurance
- −$350
- − Repairs & maintenance
- −$1,115
- − Management
- −$1,115
- − HOA
- −$2,952
- − Depreciation
- −$2,033
- Taxable income
- $1,243
- Est. tax owed @ 24.0%
- −$298
- After-tax cash flow
- $1,798/yr
For passive investors: Depreciation is non-cash, so a rental often shows a tax loss while cash-flowing — sheltering income. Rental losses are passive: they offset passive income freely, and up to $25,000/yr can offset ordinary (W-2) income if you actively participate and your MAGI is under $100k (phasing out to $0 by $150k); unused losses carry forward. On sale, claimed depreciation is recaptured at up to 25%, and gains may owe capital-gains tax (a 1031 exchange can defer both). Figures are a year-1 estimate at your 24.0% rate — not tax advice; consult a CPA.
Schools (NCES district)
- District
- Manatee
- NCES district ID
- 1201230
- Math proficiency
- 54% ▼ -6.00%
- Reading proficiency
- 50% ▼ -2.00%
- Median HH income
- $49,607
- Composite
- 44.43/100
- National rank
- #2806
- State rank
- #26 of 73 in FL
Livability — Bayshore Gardens
- Score
- 82/100
- State rank
- #72
- US rank
- #1180
Category grades
Schools grade is shown separately in the Schools card above.
Census & demographics
- Census place
- Bayshore Gardens, FL
- County
- Manatee County · 416,364 people
- City population
- 33,840
- Metro
- North Port-Sarasota-Bradenton, FL
- Population (ZIP)
- 34,081
- Household income
- $45,010
- Rent vs Own
- Severe rent burden
- 1474.0
Population outlook (Manatee County) Hauer SSP2
- Today (2025)
- 447,342 people
- By 2030
- 488,911 · +9.3%
- By 2040
- 567,934 · +27.0%
- By 2050
- 637,995 · +42.6%
- By 2075
- 781,970 · +74.8%
- By 2100
- 848,272 · +89.6%
Race, ethnicity, and origin ACS 2023
- Neighborhood character
- Diverse neighborhood (Simpson 0.57)
- Race & ethnicity
- White 58% Hispanic / Latino 29% Two or more races 13% Black 7%
- Hispanic origin (detail)
- Mexican 12% Puerto Rican 4% Cuban 3% Dominican 1%
- Common ancestry
- Lithuanian 3% Romanian 2% Slovak 2%
- Foreign-born
- 16% · Canada, Jamaica
- Languages at home
- 74% English-only · Spanish 22% Other Indo-European 1% French/Haitian/Cajun 1%
Political lean MEDSL · Manatee
- 2024 margin
- Strong R (+23.5) · D 37.9% · R 61.4%
- 2008→2024 swing
- -16.5pp toward R · 2008: -7.0pp · 2024: -23.5pp
- All cycles
- 2024: R+23.5 2020: R+16.1 2016: R+17.1 2012: R+12.5 2008: R+7.0
Not yet ingested
- Civics
- —
Market trends
- HPI YoY
- ▼ -305.32%
- Current HPI
- 369.9899
- Rent YoY
- ▼ -5.50%
- Metro
- North Port-Sarasota-Bradenton, FL
- State GDP YoY
- ▲ 3.28%
- F500 in state
- 36
Industry mix (Fortune 500 HQ in FL)
| Industry | F500 HQs | Revenue |
|---|---|---|
| Industrial Technology | 2 | $29B |
|
||
| Insurance | 2 | $17B |
|
||
| Retail | 1 | $60B |
|
||
| Technology Distribution | 1 | $58B |
|
||
| Homebuilding | 1 | $35B |
|
||
| Technology Manufacturing | 1 | $35B |
|
||
Price history
+288.3% since first listed10 events — show timeline
- 2026-04-30 Price Changed $69,900 Stellar MLS as Distributed by MLS Grid
- 2026-03-13 Price Changed $74,900 Stellar MLS as Distributed by MLS Grid
- 2026-01-22 Price Changed $75,000 Stellar MLS as Distributed by MLS Grid
- 2026-01-11 Relisted — Stellar MLS as Distributed by MLS Grid
- 2026-01-05 Relisted — Stellar MLS as Distributed by MLS Grid
- 2025-12-31 Listing Removed — Stellar MLS as Distributed by MLS Grid
- 2025-07-26 Listed $85,000 Stellar MLS as Distributed by MLS Grid
- 1998-06-02 Sold (Public Records) $23,800 Public Records
- 1986-01-01 Sold (Public Records) $25,000 Public Records
- 1978-02-01 Sold (Public Records) $18,000 Public Records
Property tax history
+8.5%/yrLatest (2025): $1,218 · -1.4% YoY. Source: county tax records.
Cash-flow waterfall
monthlySold comps — $/sqft
last 12 mo · ≤1 miLoading sold comps…