69530 Dillon Rd · Desert Edge, CA
Flood risk 1/10 · Minimal
- FEMA flood zone
- A
- Chance of flooding over 30 yrs
- 0.0%
- Est. flood insurance / yr
- $1,009 – $1,996
Fire risk 5/10 · Moderate
- Est. fire insurance / yr
- $659 – $1,223
Heat risk 8/10 · Major
- Hot days now (above 109°F)
- 6 days/yr
- Hot days in 30 yrs
- 16 days/yr
Wind risk 1/10 · Minimal
- Chance of severe wind over 30 yrs
- —
Air-quality risk 5/10 · Moderate
- Unhealthy air days now
- 6 days/yr
- Unhealthy air days in 30 yrs
- 8 days/yr
Risk factors via First Street. Map © Google.
Why this score? — see what drove the D grade
The composite is a weighted blend of 9 inputs, each scored 0–100. Each bar is that input's sub-score; the figure is the points it added to the 100-point composite (weight × sub-score).
- Cash flow +15.0/30.0
- ARV discount +7.5/15.0
- 1% rule +5.0/10.0
- DSCR +5.0/10.0
- Rent growth +3.4/5.0
- Livability +3.4/5.0
- Schools +2.7/10.0
- Condition / age +2.5/5.0
- Appreciation +0.0/10.0
$39,900
🖨 Deal sheet (PDF) 📄 Offer letter ✓ Due diligence
Listing remarks MLS
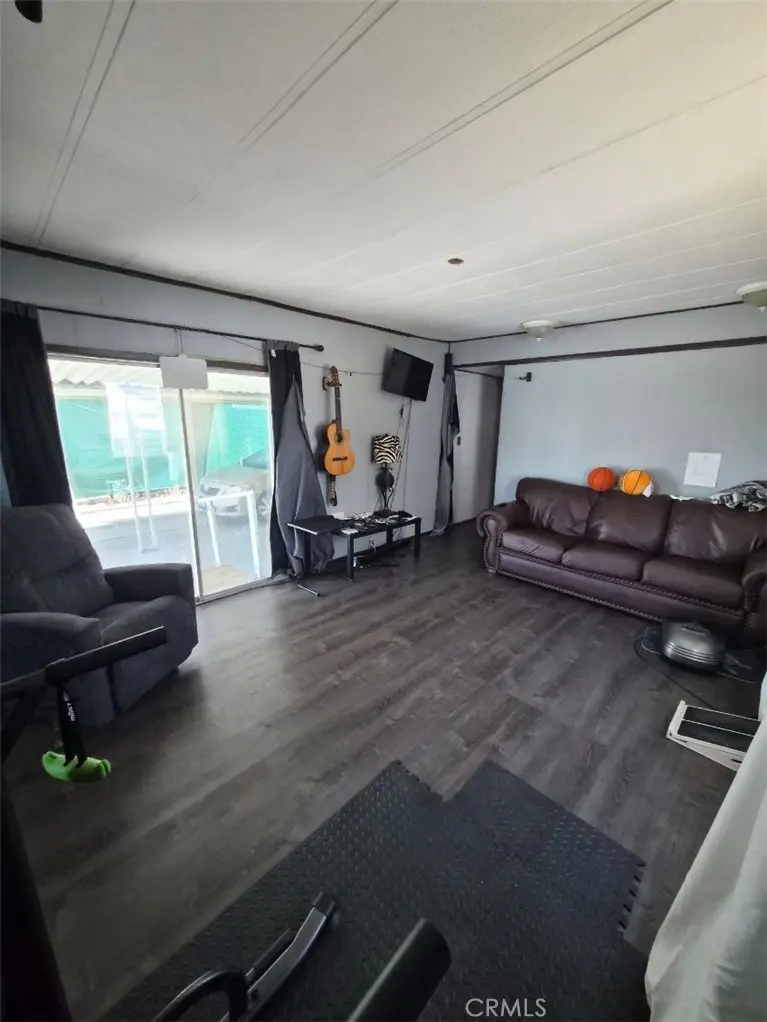
Reduced for fast sell !!!!! Classic 1976 Mobile home 2 bedroom, 1 bathroom , added bonus room use as a 3 bedroom, office. New paint and roof outside. The Oasis Mobile Home Park is a family community Mobile Home Park. Located in Desert Hot Springs, California. It's so rare this is your Awesome opportunity to move in to a park with beautiful Pools mineral spring waters. The park has that Hometown family feeling. Make an offer today. Your home sweet home awaits you. Dreams do come true , if you make the move. Call today for your personal showing.
Key facts
- Laundry facilities
- Clubhouse
- Kitchen
Tags
Property features AI
Finance
- Other: Living area reported by seller
- HOA & community: Part of an association; Land lease $800
Exterior
- Parking: Located in Oasis Mobile Home Park
- Utilities: Public sewer; District/public water
- Home design: Single-story mobile home; Entry on level 1
- Construction: Mobile home remains on site; Year built: see remarks
- Exterior features: Community pool; Suburban setting
Interior
- Bathrooms: 1 full bathroom
- Interior features: Entry on level 1
- Laundry & utility: Laundry available (see remarks for details)
Neighborhood map
What this means for you Summary
Snapshot
- This is a 2-bed/2.0-bath manufactured listed at $40k.
Deal economics
- At list price, monthly cash flow is $980 ($12k/yr) — positive.
- The deal already cash-flows at list — no discount required.
- Meets the 1% rule at list price ($2k rent vs $40k).
- Recommended offer: $39k (1.5% below list) — sets the bar for market timing.
- Cap rate 39.5% vs local median 14.8% in Desert Edge — top-decile yield for the area; either an underpriced asset or a hidden risk that comps aren't pricing in. Stress-test before assuming the spread holds.
Location & tenants
- Location reads 68/100 on livability (#297 in CA) — a middle-class / working-renter tenant base. Strengths: cost of living A+, housing A+; Watch: crime C-, commute D-, employment F.
- Palm Springs Unified (suburban): math 21% / reading 42% proficiency, ranked #328 of 517 in CA (top 63%) — families likely to look elsewhere, expect single-tenant / working-renter base with shorter leases; 73% free/reduced lunch — lower-income household profile, screen leases tightly.
- Zoned schools: Julius Corsini Elementary (409 students, 98% FRL); Desert Springs Middle (803 students, 99% FRL); Desert Hot Springs High (math 27% / reading 52%, grade F, #532 of 1,170 statewide, top 48%, 1,742 students, 98% FRL) — zoned schools average 98% FRL vs 73% district-wide (25 pts higher); higher-poverty schools than district average — tighter screening recommended.
- Market conditions: Rents rising (+3.7%/yr); 521 active listings in the ZIP; 6 comparable units currently listed for rent nearby; rentals lingering (median 45d on market — plan ~5-8 weeks vacancy on turnover, expect pricing pressure); 67% of comp listings sitting > 30 days — soft ceiling on asking rent; 9,195 units permitted in Riverside County in 2024 (1,512 in 5+ unit buildings).
- This rent runs 38% of the median local income ($54k/yr) — at the standard rent-burdened threshold; future hikes will face affordability resistance.
Forward outlook
- Local home prices are declining (-3.0%/yr); year-one equity from $276 of loan paydown is wiped out by about $1k of value loss. Plan a longer hold.
- Riverside County population projected at +22% by 2050 — long-run rental-demand tailwind backs the buy-and-hold thesis.
- At projected returns (-3.0% appreciation + 3.7% rent growth), your $11k cash investment doubles in ~2 years — after that, you're playing with house money.
Negotiation context
- It's been on market 15 days — a 2% lower offer ($39k) is reasonable based on typical stale-listing flexibility.
- 5 sale attempts since 22y ago with the ask held roughly flat each time — persistent listings suggest the price (not the market) is what's stuck; bring a comps-based counter.
Risks & watch-outs
- Watch-outs: flood insurance adds $125/mo.
- Climate carrying-cost: in FEMA flood zone A (mandatory federal flood insurance); moderate wildfire risk; extreme-heat days projected 6→16/yr by 2055 (HVAC capex compounding) — expect insurance premiums to compound above CPI over the hold.
Questions for the listing agent
- What's the actual annual flood-insurance premium (NFIP or private), and is the property in a SFHA with mandatory coverage?
- Is there a deadline driving the sale (1031 exchange, divorce, estate, relocation)? That informs how much negotiation room exists.
- Schools are F-rated, which usually means shorter tenancies and higher turnover. Who's the typical renter profile here, and what's been the actual vacancy rate?
- The area grade is low — what's the realistic commute time and amenity access for the typical tenant pool here? Any planned neighborhood developments (good or bad) we should know about?
- What's the average days-on-market for RENTAL listings here right now (not sales)? A rising rental-DOM trend means longer vacancies and softer asking-rent achievability than the comps imply.
- What's the recent tenant-quality profile in this submarket — average credit score on applications, eviction rate, late-payment / NSF rate, and stable-employment percentage? A property-management company in the area should have these aggregated.
- How much new for-sale + rental construction is in the pipeline within 1–3 miles? Heavy new supply typically softens prices + rents 12–24 months out; constrained supply supports both.
Investment metrics
- 1% rule
- 4.28% ✓
- Cap rate
- 39.54%
- Cash-on-cash
- 118.74%
- DSCR
- 6.28
- GRM
- 1.9
CMA / ARV
- ARV (on-the-fly)
- $104,832
- Comps found
- 12
Show comp detail 12 sales within ~0.75 mi
| Address | Dist | Beds/Ba | Sqft | Sold | Price | $/sf | Match |
|---|---|---|---|---|---|---|---|
| 69300 Fairway Dr | 0.56mi | 2/2.0 | 1,152 (0%) | 1mo | $109,000 | $95 | 73 |
| 69525 Dillon Rd #85 | 0.26mi | 2/2.0 | 1,050 (-9%) | 7mo | $119,000 | $113 | 67 |
| 69601 Country Club Dr | 0.34mi | 2/2.0 | 1,040 (-10%) | 4mo | $166,500 | $160 | 64 |
| 69525 Dillon Rd #88 | 0.26mi | 3/2.0 (+1) | 1,248 (+8%) | 6mo | $180,000 | $144 | 64 |
| 17640 Corkill #78 Rd | 0.47mi | 2/2.0 | 1,248 (+8%) | 1mo | $69,999 | $56 | 63 |
| 17640 Corkill Rd #74 | 0.47mi | 2/2.0 | 1,056 (-8%) | 2mo | $55,000 | $52 | 63 |
| 17555 Corkill Rd #53 | 0.41mi | 3/2.0 (+1) | 1,056 (-8%) | 1mo | $70,000 | $66 | 61 |
| 17640 Corkill Rd #46 | 0.47mi | 3/2.0 (+1) | 1,200 (+4%) | 8mo | $58,000 | $48 | 60 |
| 69285 Midpark | 0.62mi | 2/2.0 | 1,048 (-9%) | 2mo | $95,000 | $91 | 54 |
| 17640 Corkill Rd #27 | 0.47mi | 3/2.0 (+1) | 1,248 (+8%) | 7mo | $60,000 | $48 | 53 |
| 16821 Greenway Ct | 0.56mi | 2/2.0 | 1,000 (-13%) | 1mo | $156,500 | $157 | 51 |
| 17850 Corkill Rd #38 | 0.57mi | 2/1.0 | 1,000 (-13%) | 5mo | $25,000 | $25 | 43 |
Match score weights: distance 35% · size 25% · config 20% · recency 20%. Top-matched comps best support the ARV.
Projected returns pro-forma
-3.0% appreciation · 3.66% rent growth · sell at horizon
- IRR
- —
- Equity multiple
- 6.12×
- Total profit
- $57,193
- Equity at exit
- $5,949
- IRR
- —
- Equity multiple
- 13.11×
- Total profit
- $135,288
- Equity at exit
- $3,450
Cash invested: $11,172 (down + closing). Projections, not guarantees.
Landlord ↔ Tenant lean methodology
- Overall (STATE)
- 18 Strongly Tenant-Friendly
- State California
- 18 Strongly Tenant-Friendly · D+13
- County
- — inherits STATE
- City
- — inherits STATE
ZIP-level market 92240
- Home prices YoY
- -19.6%
- Rents YoY
- 3.7%
- Active inventory
- 521
- Price-to-rent
- 1.9×
Monthly cashflow live
- Estimated rent
- $1,710 high interval (Pro) →
- Mortgage (P&I)
- −$209
- Tax from tax record
- −$19 /mo · $230/yr
- Insurance
- −$17
- Flood insurance flood zone
- −$125 /mo · $1,502/yr
- HOA
- −$0
- Vacancy / Maint / Mgmt
- −$359
- Net cashflow
- $980
Break-even live
Sensitivity live
| Price | -10% $1,003 | -5% $992 | +0% $980 | +5% $969 | +10% $958 |
|---|---|---|---|---|---|
| Rent | -10% $845 | -5% $913 | +0% $980 | +5% $1,048 | +10% $1,115 |
| Rate | -1.0pp $1,000 | -0.5pp $990 | base $980 | +0.5pp $970 | +1.0pp $959 |
UW: 25.0% down · 7.5% · 30yr · 1.5% tax · 5.0% vac · 8.0% maint · 8.0% mgmt
Financing live
Cash to close
- Down payment
- $9,975
- Closing costs
- $1,197
- Reserves months
- —
- Total cash needed
- —
Loan-product check · same deal, 3 products live
Conventional
25% down · 7.5% · 30yr
- Down + closing
- —
- Monthly P&I
- —
- Monthly cashflow
- —
- DSCR
- —
- Eligible?
- —
Personal DTI + credit; lowest rate.
DSCR
20% down · 8.5% · 30yr
- Down + closing
- —
- Monthly P&I
- —
- Monthly cashflow
- —
- DSCR
- —
- Eligible?
- —
No personal income docs; deal must DSCR.
Hard money
10% down · 12.0% · 12mo
- Down + closing
- —
- Monthly P&I
- —
- Monthly cashflow
- —
- DSCR
- —
- Eligible?
- —
Short-term bridge; refi at stabilization.
Rent comps 6 comps
| Address | Beds | Baths | Sqft | Rent | $/sqft | DOM | Units | Dist |
|---|---|---|---|---|---|---|---|---|
| 69510 Parkside Dr Desert Hot Springs, CA | 1.0 | 1.0 | 1150 | $1,450 | $1.26 | 45d | 1 | 0.34mi |
| 69470 Midpark Dr Desert Hot Springs, CA | 1.0 | 1.0 | 1298 | $1,500 | $1.16 | 45d | 1 | 0.39mi |
| 18070 Langlois Rd #257 Desert Hot Springs, CA | 2.0 | 2.0 | 1056 | $1,850 | $1.75 | 45d | 1 | 1.04mi |
| 18070 Langlois Rd Dsrt Hot Spgs, CA | 2.0 | 2.0 | 950 | $1,850 | $1.95 | 0d | 1 | 1.04mi |
| 18070 Langlois Rd Dsrt Hot Spgs, CA | 2.0 | 2.0 | 950 | $1,850 | $1.95 | 25d | 1 | 1.04mi |
| 70875 Dillon Rd Desert Hot Springs, CA | 2.0 | 2.0 | 720 | $2,200 | $3.06 | 45d | 1 | 1.09mi |
Listing history 11 events
-
2026-06-21days on market $39,900 Active 15 DOM
-
2026-06-18days on market $39,900 Active 12 DOM
-
2026-06-17days on market $39,900 Active 11 DOM
-
2026-06-16days on market $39,900 Active 10 DOM
-
2026-06-15days on market $39,900 Active 9 DOM
-
2026-06-13days on market $39,900 Active 7 DOM
-
2026-06-13days on market $39,900 Active 6 DOM
-
2026-06-09days on market $39,900 Active 3 DOM
-
2026-06-08days on market $39,900 Active 2 DOM
-
2026-06-07remarks 691-char remark
-
2026-06-07$39,900 Active 1 DOM
ⓘ Source: listings_history table (triggers on properties + properties_extension) + one-shot
backfill from property_details.listing_events for pre-trigger history.
Tax reassessment forecast CA · Resets to sale price
- Current annual tax
- $230 · $19/mo
- Projected year-2 tax
- $303 · $25/mo
- Expected delta
- +$73/yr (+$6/mo · 31.7%)
ⓘ Screening estimate from a state-policy table — verify with the county assessor before closing.
Climate risk First Street
- Flood 1/10 Low FEMA zone A · 0% chance over 30 yrs
- Wildfire 5/10 Major
- Heat 8/10 Severe 6 d/yr ≥109°F today · 16 d/yr by 30 yrs out
- Wind 1/10 Low
- Air quality 5/10 Major 6 unhealthy d/yr today · 8 by 30 yrs out
Nearby sold comps map
Loading sold comps map…
Walkable amenities ~0.75 mi
Loading nearby amenities…
Taxation est. · year 1
- Rental income
- $20,514
- − Mortgage interest
- −$2,235
- − Property taxes
- −$230
- − Insurance
- −$1,702
- − Repairs & maintenance
- −$1,641
- − Management
- −$1,641
- − Depreciation
- −$1,161
- Taxable income
- $11,904
- Est. tax owed @ 24.0%
- −$2,857
- After-tax cash flow
- $8,906/yr
For passive investors: Depreciation is non-cash, so a rental often shows a tax loss while cash-flowing — sheltering income. Rental losses are passive: they offset passive income freely, and up to $25,000/yr can offset ordinary (W-2) income if you actively participate and your MAGI is under $100k (phasing out to $0 by $150k); unused losses carry forward. On sale, claimed depreciation is recaptured at up to 25%, and gains may owe capital-gains tax (a 1031 exchange can defer both). Figures are a year-1 estimate at your 24.0% rate — not tax advice; consult a CPA.
Schools (NCES district)
- District
- Palm Springs Unified
- NCES district ID
- 0629550
- Math proficiency
- 21% ▼ -7.00%
- Reading proficiency
- 42% ▬ 0.00%
- Median HH income
- $43,638
- Composite
- 26.76/100
- National rank
- #7131
- State rank
- #328 of 517 in CA
Livability — Desert Edge
- Score
- 68/100
- State rank
- #297
- US rank
- #9953
Category grades
Schools grade is shown separately in the Schools card above.
Census & demographics
- Census place
- Desert Edge, CA
- County
- Riverside County · 2,287,001 people
- Metro
- Riverside-San Bernardino-Ontario, CA
- Population (ZIP)
- 41,615
- Household income
- $54,023
- Rent vs Own
- Severe rent burden
- 2095.0
Population outlook (Riverside County) Hauer SSP2
- Today (2025)
- 2,664,475 people
- By 2030
- 2,802,692 · +5.2%
- By 2040
- 3,050,904 · +14.5%
- By 2050
- 3,256,783 · +22.2%
- By 2075
- 3,655,058 · +37.2%
- By 2100
- 3,766,594 · +41.4%
Race, ethnicity, and origin ACS 2023
- Neighborhood character
- Majority Hispanic (64%)
- Race & ethnicity
- Hispanic / Latino 64% Two or more races 27% White 23% Black 7% Native American 2% Asian 2%
- Hispanic origin (detail)
- Mexican 53%
- Common ancestry
- Lithuanian 1% Romanian 1% Italian 1%
- Foreign-born
- 27% · Canada, Vietnam
- Languages at home
- 47% English-only · Spanish 50% Russian/Polish/Slavic 1%
Political lean MEDSL · Riverside
- 2024 margin
- Toss-up / Even · D 48.0% · R 49.3% · Other 2.6%
- 2008→2024 swing
- -3.6pp toward R · 2008: 2.3pp · 2024: -1.3pp
- All cycles
- 2024: R+1.3 2020: D+8.0 2016: D+4.3 2012: R+0.4 2008: D+2.3
Not yet ingested
- Civics
- —
Market trends
- HPI YoY
- ▼ -102.10%
- Current HPI
- 418.4691
- Rent YoY
- ▲ 3.66%
- Metro
- Riverside-San Bernardino-Ontario, CA
- State GDP YoY
- ▲ 3.21%
- F500 in state
- 116
Industry mix (Fortune 500 HQ in CA)
| Industry | F500 HQs | Revenue |
|---|---|---|
| Technology | 27 | $1,492B |
|
||
| Financial Services | 3 | $174B |
|
||
| Retail | 3 | $44B |
|
||
| Insurance | 3 | $26B |
|
||
| Media / Entertainment | 2 | $115B |
|
||
| Pharmaceuticals / Biotech | 2 | $62B |
|
||
Price history
+59.6% since first listed21 events — show timeline
- 2026-06-06 Listed $39,900 CRMLS
- 2023-01-20 Price Changed $50,000 CRMLS
- 2023-01-19 Sold (MLS) $50,000 CRMLS
- 2022-12-31 Pending — CRMLS
- 2022-12-08 Price Changed $51,555 CRMLS
- 2022-12-05 Price Changed $52,555 CRMLS
- 2022-12-04 Price Changed $53,555 CRMLS
- 2022-12-01 Price Changed $54,555 CRMLS
- 2022-11-16 Price Changed $55,555 CRMLS
- 2022-11-01 Price Changed $53,500 CRMLS
- 2022-10-31 Price Changed $55,500 CRMLS
- 2022-10-26 Price Changed $55,000 CRMLS
- 2022-10-21 Price Changed $57,500 CRMLS
- 2022-10-12 Listed $57,000 CRMLS
- 2022-10-01 Listing Removed — GPSMLS
- 2022-08-31 Listed $65,500 GPSMLS
- 2022-08-17 Coming Soon — GPSMLS
- 2022-07-15 Listed — TheMLS
- 2005-03-02 Sold (MLS) $23,750 GPSMLS
- 2005-03-02 Sold (MLS) $23,750 GPSMLS
- 2004-12-22 Listed $25,000 GPSMLS
Property tax history
+3.9%/yrLatest (2025): $230 · -2.1% YoY. Source: county tax records.
Cash-flow waterfall
monthlySold comps — $/sqft
last 12 mo · ≤1 miLoading sold comps…