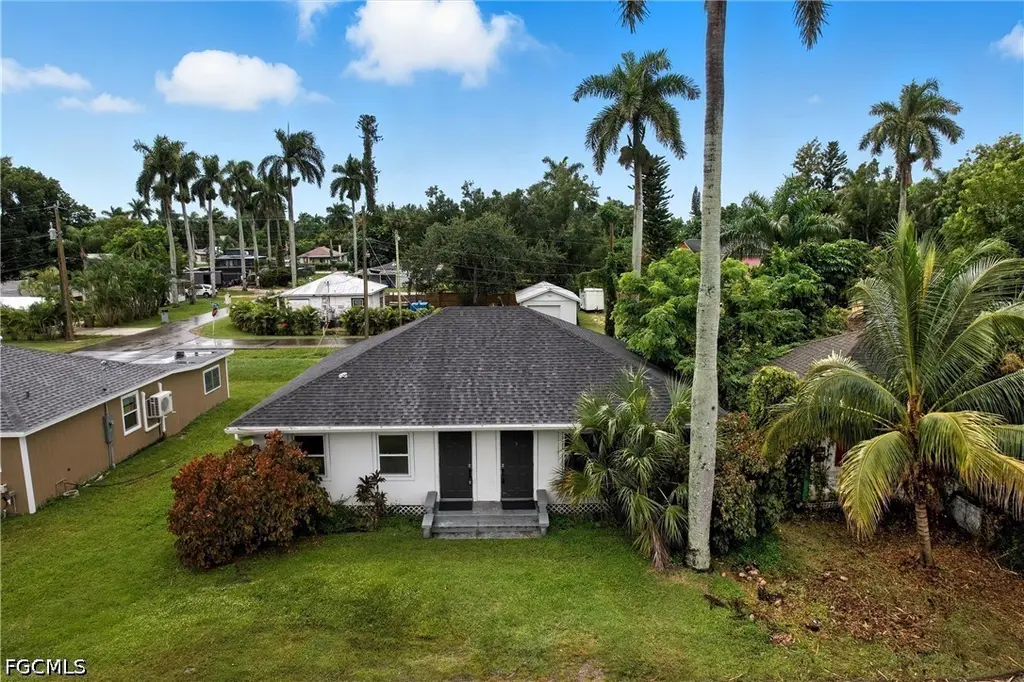
25 Cypress St · North Fort Myers, FL
Flood risk 9/10 · Severe
- FEMA flood zone
- AE
- Chance of flooding over 30 yrs
- 0.99%
- Est. flood insurance / yr
- $1,737 – $8,500
Fire risk 1/10 · Minimal
- Est. fire insurance / yr
- $947 – $1,759
Heat risk 10/10 · Severe
- Hot days now (above 107°F)
- 7 days/yr
- Hot days in 30 yrs
- 29 days/yr
Wind risk 10/10 · Severe
- Chance of severe wind over 30 yrs
- 99.0%
Air-quality risk 2/10 · Minimal
- Unhealthy air days now
- 1 days/yr
- Unhealthy air days in 30 yrs
- 1 days/yr
Risk factors via First Street. Map © Google.
Why this score? — see what drove the B- grade
The composite is a weighted blend of 9 inputs, each scored 0–100. Each bar is that input's sub-score; the figure is the points it added to the 100-point composite (weight × sub-score).
- Cash flow +30.0/30.0
- DSCR +10.0/10.0
- 1% rule +9.1/10.0
- ARV discount +7.5/15.0
- Schools +4.1/10.0
- Livability +3.7/5.0
- Condition / age +2.5/5.0
- Rent growth +2.0/5.0
- Appreciation +0.0/10.0
$229,900
🖨 Deal sheet (PDF) 📄 Offer letter ✓ Due diligence
Listing remarks
* Accepting Back-Up Offers, 2020 Roof * Welcome to 25 Cypress Street in North Fort Myers, a beautifully updated duplex that delivers modern comfort and outstanding value. This property offers an excellent opportunity for investors seeking strong rental income, or for buyers interested in living in one unit while leasing the other. Extensively renovated in 2020, both units were upgraded with impact windows, a new roof, fresh exterior paint, and complete interior remodels, creating a truly move-in-ready property with long-term peace of mind. Each unit has been carefully maintained and thoughtfully improved, including new flooring installed throughout in 2024, giving both sides a clean, conte
Key facts
- Ac replaced
- 2020 roof
- New flooring
Tags
Property features AI
Finance
- Other: Tenant is responsible for application fee, cable TV, electricity, and water; Pets allowed
- Financial info: Gross scheduled income (multi-unit): $37,800; Operating expenses (multi-unit): $3,780
- HOA & community: No association fee; Non-gated community
Exterior
- Utilities: Cable available; Septic tank; Well water
- Home design: Resale property; Zoned TFC-2
- Construction: Stucco and wood frame construction; Shingle roof
- Exterior features: No notable exterior features listed; Rectangular lot; Lot dimensions approximately 53 x 101 x 55 x 101
Interior
- Flooring: Vinyl
- Bathrooms: 2 full bathrooms
- Heating & cooling: Central heating (electric); Central air conditioning (electric)
- Interior features: Single hung windows; Vinyl flooring
Neighborhood map
What this means for you Summary
Snapshot
- This is a 4-bed/2.0-bath single-family listed at $230k.
Deal economics
- At list price, monthly cash flow is $548 ($7k/yr) — positive.
- The deal already cash-flows at list — no discount required.
- Meets the 1% rule at list price ($3k rent vs $230k).
- Recommended offer: $223k (3.0% below list) — sets the bar for market timing.
- Cap rate 11.4% vs local median 3.6% in North Fort Myers — top-decile yield for the area; either an underpriced asset or a hidden risk that comps aren't pricing in. Stress-test before assuming the spread holds.
Location & tenants
- Location reads 74/100 on livability (#269 in FL, #4,409 nationally) — a middle-class / working-renter tenant base. Strengths: cost of living A+, housing A+, health & safety A+; Watch: employment C-, amenities F, commute F.
- Lee (suburban): math 47% / reading 50% proficiency, ranked #42 of 73 in FL (top 58%) — families likely to look elsewhere, expect single-tenant / working-renter base with shorter leases.
- Market conditions: Rents soft (-1.9%/yr); 472 active listings in the ZIP; 19 comparable units currently listed for rent nearby; rentals at typical pace (median 24d on market — plan ~3-4 weeks tenant-placement turnaround); 15,411 units permitted in Lee County in 2024 (4,686 in 5+ unit buildings).
- At $3,244/mo this rent would consume 68% of the median local household income ($57k/yr) (locally 468% of renters already pay >50% of income on rent) — very limited rent-growth headroom before tenants either downsize or default.
Forward outlook
- Local home prices are declining (-3.0%/yr); year-one equity from $2k of loan paydown is wiped out by about $7k of value loss. Plan a longer hold.
- Lee County population projected at +44% by 2050 — long-run rental-demand tailwind backs the buy-and-hold thesis.
Negotiation context
- It's been on market 34 days — a 3% lower offer ($223k) is reasonable based on typical stale-listing flexibility.
- 17 sale attempts since 9y ago with the ask held roughly flat each time — persistent listings suggest the price (not the market) is what's stuck; bring a comps-based counter.
- Current owner paid $25k; list at $230k implies a 820% gain — meaningful room to come down on a strong offer.
Risks & watch-outs
- Watch-outs: flood insurance adds $427/mo; built in 1944 — expect roof / HVAC / electrical / plumbing capex.
- Climate carrying-cost: in FEMA flood zone AE (mandatory federal flood insurance); severe wind risk, 99% chance of damaging wind over 30y; extreme-heat days projected 7→29/yr by 2055 (HVAC capex compounding) — expect insurance premiums to compound above CPI over the hold.
Questions for the listing agent
- It's been on market 34 days. Have you received any prior offers? Is the seller open to a 3% concession, seller financing, or rate buy-down credit?
- Built in 1944 — when were the roof, HVAC, electrical panel, plumbing, and water heater last replaced?
- What's the actual annual flood-insurance premium (NFIP or private), and is the property in a SFHA with mandatory coverage?
- Is there a deadline driving the sale (1031 exchange, divorce, estate, relocation)? That informs how much negotiation room exists.
- What's the average days-on-market for RENTAL listings here right now (not sales)? A rising rental-DOM trend means longer vacancies and softer asking-rent achievability than the comps imply.
- What's the recent tenant-quality profile in this submarket — average credit score on applications, eviction rate, late-payment / NSF rate, and stable-employment percentage? A property-management company in the area should have these aggregated.
- How much new for-sale + rental construction is in the pipeline within 1–3 miles? Heavy new supply typically softens prices + rents 12–24 months out; constrained supply supports both.
Investment metrics
- 1% rule
- 1.41% ✓
- Cap rate
- 11.38%
- Cash-on-cash
- 18.16%
- DSCR
- 1.81
- GRM
- 5.9
CMA / ARV
No comps found within radius.
Show comp detail 6 sales within ~0.75 mi
| Address | Dist | Beds/Ba | Sqft | Sold | Price | $/sf | Match |
|---|---|---|---|---|---|---|---|
| 26 Cypress St | 0.02mi | 3/1.0 (-1) | 832 | 7mo | $122,500 | $147 | 72 |
| 83 Oak St | 0.17mi | 3/2.0 (-1) | 1,004 | 12mo | $85,000 | $85 | 65 |
| 1383 Harbor View Dr | 0.71mi | 3/2.0 (-1) | 1,578 | 4mo | $390,000 | $247 | 46 |
| 400 E North Shore Dr | 0.63mi | 3/2.0 (-1) | 1,282 | 13mo | $340,000 | $265 | 42 |
| 1329 Sunrise Dr | 0.59mi | 3/2.0 (-1) | 1,248 | 23mo | $305,000 | $244 | 36 |
| 1320 Harbor View Dr | 0.70mi | 3/2.0 (-1) | 1,420 | 18mo | $225,000 | $158 | 35 |
Match score weights: distance 35% · size 25% · config 20% · recency 20%. Top-matched comps best support the ARV.
Projected returns pro-forma
-3.0% appreciation · 0.0% rent growth · sell at horizon
- IRR
- -5.0%
- Equity multiple
- 0.82×
- Total profit
- $-11,572
- Equity at exit
- $34,279
- IRR
- -0.2%
- Equity multiple
- 0.99×
- Total profit
- $-645
- Equity at exit
- $19,878
Cash invested: $64,372 (down + closing). Projections, not guarantees.
Landlord ↔ Tenant lean methodology
- Overall (STATE)
- 87 Strongly Landlord-Friendly
- State Florida
- 87 Strongly Landlord-Friendly · R+3
- County
- — inherits STATE
- City
- — inherits STATE
ZIP-level market 33903
- Rents YoY
- -1.9%
- Active inventory
- 472
- Price-to-rent
- 5.9×
Monthly cashflow live
- Estimated rent
- $3,244 high interval (Pro) →
- Mortgage (P&I)
- −$1,206
- Tax est. 1.5%
- −$287 /mo · $3,448/yr
- Insurance
- −$96
- Flood insurance flood zone
- −$427 /mo · $5,118/yr
- HOA
- −$0
- Vacancy / Maint / Mgmt
- −$681
- Net cashflow
- $548
Break-even live
Sensitivity live
| Price | -10% $706 | -5% $627 | +0% $548 | +5% $468 | +10% $389 |
|---|---|---|---|---|---|
| Rent | -10% $291 | -5% $419 | +0% $548 | +5% $676 | +10% $804 |
| Rate | -1.0pp $663 | -0.5pp $606 | base $548 | +0.5pp $488 | +1.0pp $427 |
UW: 25.0% down · 7.5% · 30yr · 1.5% tax · 5.0% vac · 8.0% maint · 8.0% mgmt
Financing live
Cash to close
- Down payment
- $57,475
- Closing costs
- $6,897
- Reserves months
- —
- Total cash needed
- —
Loan-product check · same deal, 3 products live
Conventional
25% down · 7.5% · 30yr
- Down + closing
- —
- Monthly P&I
- —
- Monthly cashflow
- —
- DSCR
- —
- Eligible?
- —
Personal DTI + credit; lowest rate.
DSCR
20% down · 8.5% · 30yr
- Down + closing
- —
- Monthly P&I
- —
- Monthly cashflow
- —
- DSCR
- —
- Eligible?
- —
No personal income docs; deal must DSCR.
Hard money
10% down · 12.0% · 12mo
- Down + closing
- —
- Monthly P&I
- —
- Monthly cashflow
- —
- DSCR
- —
- Eligible?
- —
Short-term bridge; refi at stabilization.
Rent comps 19 comps
| Address | Beds | Baths | Sqft | Rent | $/sqft | DOM | Units | Dist |
|---|---|---|---|---|---|---|---|---|
| 3414 Hancock Bridge Pkwy #403 North Fort Myers, FL | 3.0 | 2.0 | 1786 | $4,500 | $2.52 | 4d | 1 | 0.60mi |
| 3414 Hancock Bridge Pkwy #403 North Fort Myers, FL | 3.0 | 2.0 | 1786 | $4,500 | $2.52 | 3d | 1 | 0.60mi |
| 3414 Hancock Bridge Pkwy #1204 North Fort Myers, FL | 3.0 | 2.5 | 2188 | $5,900 | $2.70 | 24d | 1 | 0.60mi |
| 3426 Hancock Bridge Pkwy Ph 05 North Fort Myers, FL | 3.0 | 2.5 | 2330 | $3,750 | $1.61 | 24d | 1 | 0.64mi |
| 3426 Hancock Bridge Pkwy Ph 02 North Fort Myers, FL | 3.0 | 2.5 | 2457 | $7,500 | $3.05 | 24d | 1 | 0.64mi |
| 3426 Hancock Bridge Pkwy #902 North Fort Myers, FL | 3.0 | 2.0 | 1931 | $3,200 | $1.66 | 4d | 1 | 0.64mi |
| 3350 N Key Dr #713 North Fort Myers, FL | 3.0 | 2.0 | 1207 | $2,250 | $1.86 | 4d | 1 | 0.68mi |
| 3350 N Key Dr Unit B911 North Fort Myers, FL | 3.0 | 2.0 | 1283 | $3,800 | $2.96 | 24d | 1 | 0.68mi |
| 1398 Evalena Ln North Fort Myers, FL | 3.0 | 2.0 | 1479 | $1,849 | $1.25 | 2d | 1 | 0.69mi |
| 1201 Betmar Blvd North Fort Myers, FL | 3.0 | 2.0 | 1380 | $2,200 | $1.59 | 4d | 1 | 0.83mi |
| 69 E Mariana Ave Unit B North Fort Myers, FL | 3.0 | 1.0 | 1000 | $1,795 | $1.79 | 4d | 1 | 0.85mi |
| 1275 Gramac Dr North Fort Myers, FL | 3.0 | 2.0 | 1013 | $1,575 | $1.55 | 24d | 1 | 1.01mi |
| 1275 Gramac Dr North Fort Myers, FL | 3.0 | 2.0 | 1013 | $1,550 | $1.53 | 4d | 1 | 1.01mi |
| 1299 Old Bridge Rd North Fort Myers, FL | 4.0 | 3.0 | 1582 | $2,200 | $1.39 | 24d | 1 | 1.08mi |
| 1310 Thompson St North Fort Myers, FL | 3.0 | 3.0 | 1387 | $2,800 | $2.02 | 24d | 1 | 1.27mi |
| 1895 N Tamiami Trl Unit C17 North Fort Myers, FL | 3.0 | 1.0 | — | $1,600 | — | 24d | 1 | 1.35mi |
| 1195 Green Ave North Fort Myers, FL | 3.0 | 2.0 | 1250 | $1,850 | $1.48 | 24d | 1 | 1.40mi |
| 1439 Glick Dr North Fort Myers, FL | 3.0 | 1.0 | 1134 | $1,500 | $1.32 | 2d | 1 | 1.40mi |
| 3171 Sea Trawler Bnd #1803 North Fort Myers, FL | 3.0 | 2.0 | 2144 | $3,900 | $1.82 | 24d | 1 | 1.44mi |
Listing history 44 events
-
2026-05-15status Pending
-
2026-05-13status Active
-
2026-05-09status Pending
-
2026-05-02price $229,900
-
2026-04-08$239,900 Active
-
2026-04-07historical
-
2026-01-17price $259,990
-
2025-11-21price $269,990
-
2025-10-16$279,990 Active
-
2025-10-11historical $1,099
-
2025-10-09price $1,099
-
2025-08-28$1,199
-
2025-08-28historical $1,199
-
2025-08-28$1,199
-
2025-08-26historical $1,299
-
2025-07-30price $1,299
-
2025-07-18$1,399
-
2025-07-18historical $1,399
-
2025-07-16$1,399
-
2025-06-09historical
-
2025-06-06historical $1,500
-
2025-05-28status Active
-
2025-05-28historical
-
2025-05-27$299,000 Active
-
2025-05-25price $1,500
-
2025-04-02$1,600
-
2025-02-22historical $1,575
-
2025-02-21$1,575
-
2025-02-20historical $1,275
-
2024-12-07historical $1,275
-
2024-12-05$1,275
-
2024-11-07$1,575
-
2024-03-24historical $1,575
-
2024-02-28price $1,575
-
2024-02-10$1,675
-
2018-11-30soldstatus $25,000 Sold
-
2018-11-20status Pending
-
2018-10-17price $40,000
-
2018-10-17status Active
-
2018-09-20status Pending
-
2018-08-21$45,000 Active
-
2017-12-28soldstatus $32,500 Sold
-
2017-12-11status Pending
-
2017-12-08$32,500 Active
ⓘ Source: listings_history table (triggers on properties + properties_extension) + one-shot
backfill from property_details.listing_events for pre-trigger history.
Climate risk First Street
- Flood 9/10 Extreme FEMA zone AE · 99% chance over 30 yrs
- Wildfire 1/10 Low
- Heat 10/10 Extreme 7 d/yr ≥107°F today · 29 d/yr by 30 yrs out
- Wind 10/10 Extreme 99% chance of damaging wind over 30 yrs
- Air quality 2/10 Low 1 unhealthy d/yr today · 1 by 30 yrs out
Nearby sold comps map
Loading sold comps map…
Walkable amenities ~0.75 mi
Loading nearby amenities…
Taxation est. · year 1
- Rental income
- $38,931
- − Mortgage interest
- −$12,878
- − Property taxes
- −$3,448
- − Insurance
- −$6,268
- − Repairs & maintenance
- −$3,114
- − Management
- −$3,114
- − Depreciation
- −$6,688
- Taxable income
- $3,419
- Est. tax owed @ 24.0%
- −$821
- After-tax cash flow
- $5,751/yr
For passive investors: Depreciation is non-cash, so a rental often shows a tax loss while cash-flowing — sheltering income. Rental losses are passive: they offset passive income freely, and up to $25,000/yr can offset ordinary (W-2) income if you actively participate and your MAGI is under $100k (phasing out to $0 by $150k); unused losses carry forward. On sale, claimed depreciation is recaptured at up to 25%, and gains may owe capital-gains tax (a 1031 exchange can defer both). Figures are a year-1 estimate at your 24.0% rate — not tax advice; consult a CPA.
Schools (NCES district)
- District
- Lee
- NCES district ID
- 1201080
- Math proficiency
- 47% ▼ -11.00%
- Reading proficiency
- 50% ▼ -4.00%
- Median HH income
- $49,518
- Composite
- 41.49/100
- National rank
- #3458
- State rank
- #42 of 73 in FL
Livability — North Fort Myers
- Score
- 74/100
- State rank
- #269
- US rank
- #4409
Category grades
Schools grade is shown separately in the Schools card above.
Census & demographics
- Census place
- North Fort Myers, FL
- County
- Lee County · 788,662 people
- City population
- 57,035
- Metro
- Cape Coral-Fort Myers, FL
- Population (ZIP)
- 23,655
- Household income
- $56,993
- Rent vs Own
- Severe rent burden
- 468.0
Population outlook (Lee County) Hauer SSP2
- Today (2025)
- 871,946 people
- By 2030
- 955,468 · +9.6%
- By 2040
- 1,113,587 · +27.7%
- By 2050
- 1,256,891 · +44.1%
- By 2075
- 1,560,270 · +78.9%
- By 2100
- 1,726,848 · +98.0%
Race, ethnicity, and origin ACS 2023
- Neighborhood character
- Predominantly White (81%)
- Race & ethnicity
- White 81% Hispanic / Latino 14% Two or more races 8% Black 2%
- Hispanic origin (detail)
- Mexican 3% Puerto Rican 3% Cuban 3%
- Common ancestry
- Lithuanian 4% Romanian 4% Italian 3%
- Foreign-born
- 11% · Canada
- Languages at home
- 88% English-only · Spanish 9% Other Indo-European 1%
Political lean MEDSL · Lee
- 2024 margin
- Strong R (+28.4) · D 35.5% · R 63.9%
- 2008→2024 swing
- -18.0pp toward R · 2008: -10.4pp · 2024: -28.4pp
- All cycles
- 2024: R+28.4 2020: R+19.2 2016: R+20.4 2012: R+16.6 2008: R+10.4
Not yet ingested
- Civics
- —
Market trends
- HPI YoY
- ▼ -172.26%
- Current HPI
- 256.773
- Rent YoY
- ▼ -1.94%
- Metro
- Cape Coral-Fort Myers, FL
- State GDP YoY
- ▲ 3.28%
- F500 in state
- 36
Industry mix (Fortune 500 HQ in FL)
| Industry | F500 HQs | Revenue |
|---|---|---|
| Industrial Technology | 2 | $29B |
|
||
| Insurance | 2 | $17B |
|
||
| Retail | 1 | $60B |
|
||
| Technology Distribution | 1 | $58B |
|
||
| Homebuilding | 1 | $35B |
|
||
| Technology Manufacturing | 1 | $35B |
|
||
Price history
+607.4% since first listed44 events — show timeline
- 2026-05-15 Pending — FORTMLS
- 2026-05-13 Relisted — FORTMLS
- 2026-05-09 Pending — FORTMLS
- 2026-05-02 Price Changed $229,900 FORTMLS
- 2026-04-08 Listed $239,900 FORTMLS
- 2026-04-07 Listing Removed — FORTMLS
- 2026-01-17 Price Changed $259,990 FORTMLS
- 2025-11-21 Price Changed $269,990 FORTMLS
- 2025-10-16 Listed $279,990 FORTMLS
- 2025-10-11 Rental Removed $1,099 NAPLESMLS
- 2025-10-09 Price Changed $1,099 NAPLESMLS
- 2025-08-28 Listed for Rent $1,199 NAPLESMLS
- 2025-08-28 Rental Removed $1,199 FORTMLS
- 2025-08-28 Listed for Rent $1,199 FORTMLS
- 2025-08-26 Rental Removed $1,299 FORTMLS
- 2025-07-30 Price Changed $1,299 FORTMLS
- 2025-07-18 Listed for Rent $1,399 FORTMLS
- 2025-07-18 Rental Removed $1,399 NAPLESMLS
- 2025-07-16 Listed for Rent $1,399 NAPLESMLS
- 2025-06-09 Listing Removed — FORTMLS
- 2025-06-06 Rental Removed $1,500 GFLMLS
- 2025-05-28 Relisted — FORTMLS
- 2025-05-28 Listing Removed — FORTMLS
- 2025-05-27 Listed $299,000 FORTMLS
- 2025-05-25 Price Changed $1,500 GFLMLS
- 2025-04-02 Listed for Rent $1,600 GFLMLS
- 2025-02-22 Rental Removed $1,575 PROPERTYWARE
- 2025-02-21 Listed for Rent $1,575 PROPERTYWARE
- 2025-02-20 Rental Removed $1,275 FORTMLS
- 2024-12-07 Rental Removed $1,275 CONNECTLINX
- 2024-12-05 Listed for Rent $1,275 CONNECTLINX
- 2024-11-07 Listed for Rent $1,575 FORTMLS
- 2024-03-24 Rental Removed $1,575 PROPERTYWARE
- 2024-02-28 Price Changed $1,575 PROPERTYWARE
- 2024-02-10 Listed for Rent $1,675 PROPERTYWARE
- 2018-11-30 Sold (MLS) $25,000 FORTMLS
- 2018-11-20 Pending — FORTMLS
- 2018-10-17 Price Changed $40,000 FORTMLS
- 2018-10-17 Relisted — FORTMLS
- 2018-09-20 Pending — FORTMLS
- 2018-08-21 Listed $45,000 FORTMLS
- 2017-12-28 Sold (MLS) $32,500 FORTMLS
- 2017-12-11 Pending — FORTMLS
- 2017-12-08 Listed $32,500 FORTMLS
Cash-flow waterfall
monthlySold comps — $/sqft
last 12 mo · ≤1 miLoading sold comps…