8925 Beechwood Dr · Oshtemo, MI
Flood risk No data
- FEMA flood zone
- —
- Chance of flooding over 30 yrs
- —
- Est. flood insurance / yr
- —
Fire risk No data
- Est. fire insurance / yr
- —
Heat risk No data
- Hot days now (above threshold)
- —
- Hot days in 30 yrs
- —
Wind risk No data
- Chance of severe wind over 30 yrs
- —
Air-quality risk No data
- Unhealthy air days now
- —
- Unhealthy air days in 30 yrs
- —
Risk factors via First Street. Map © Google.
Why this score? — see what drove the B- grade
The composite is a weighted blend of 9 inputs, each scored 0–100. Each bar is that input's sub-score; the figure is the points it added to the 100-point composite (weight × sub-score).
- Cash flow +30.0/30.0
- DSCR +10.0/10.0
- 1% rule +9.6/10.0
- ARV discount +7.5/15.0
- Schools +5.1/10.0
- Livability +2.5/5.0
- Condition / age +2.2/5.0
- Rent growth +1.3/5.0
- Appreciation +0.0/10.0
$79,900
🖨 Deal sheet (PDF) 📄 Offer letter ✓ Due diligence
Listing remarks MLS
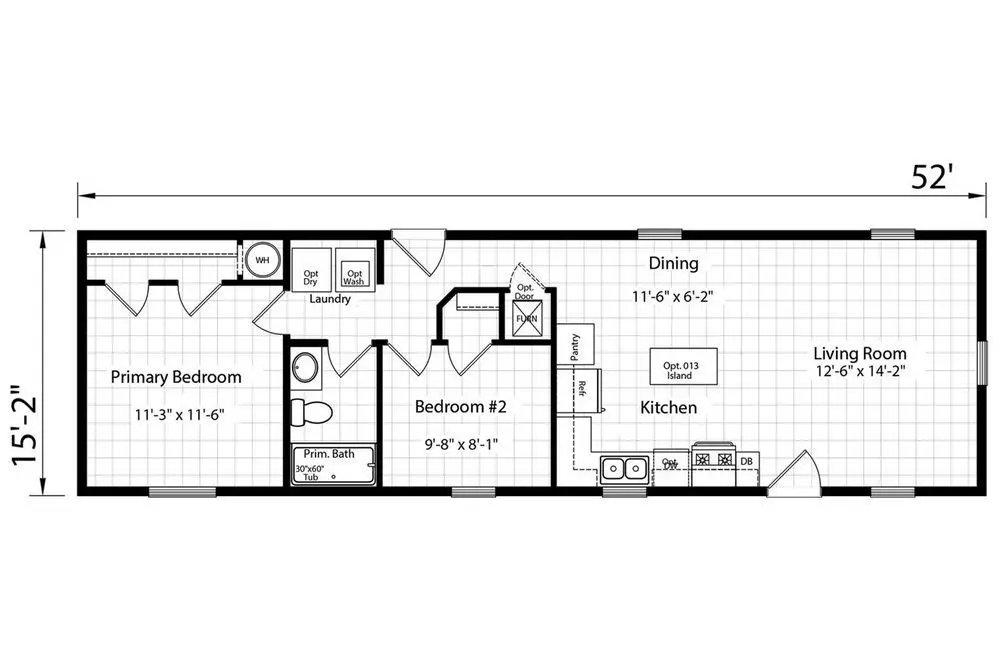
Limited Time: 2 Months FREE RENT! Enjoy this gorgeous 2 bedroom, 2 bathroom home in Woodland Estates! Open concept with amazing light, beautiful flooring, and modern finishes. Central heat & air, plus full kitchen with oven, fridge, and microwave. Includes a 2-car driveway! E. H. O. Free application: Code 311RENT50OFFAPP Apply Click Here
Key facts
- Built 2025
- Listed 253 days
Neighborhood map
What this means for you Summary
Snapshot
- This is a 2-bed/1.0-bath manufactured listed at $80k. Condition is rated fair.
Deal economics
- At list price, monthly cash flow is $370 ($4k/yr) — positive.
- The deal already cash-flows at list — no discount required.
- Meets the 1% rule at list price ($1k rent vs $80k).
- Recommended offer: $70k (12.0% below list) — sets the bar for market timing.
Location & tenants
- Location reads: area grade B — affects rentability + tenant quality, not the cash-flow math above.
- Mattawan Consolidated School (suburban): math 51% / reading 62% proficiency, ranked #50 of 540 in MI (top 9%) — acceptable for families but not a draw, mixed tenant base, ~2y average lease; only 15% free/reduced lunch — higher-income household profile.
- Market conditions: Rents falling (-5.0%/yr); 378 active listings in the ZIP; 1 comparable units currently listed for rent nearby; solid renter incomes; 339 units permitted in Kalamazoo County in 2024 (22 in 5+ unit buildings).
- This rent is only 17% of the median local income ($81k/yr) — well below the 30% rent-burden line; pricing power to push rent on renewal without tenant pushback.
Forward outlook
- Local home prices are declining (-3.0%/yr); year-one equity from $552 of loan paydown is wiped out by about $2k of value loss. Plan a longer hold.
- Kalamazoo County population projected at +18% by 2050 — long-run rental-demand tailwind backs the buy-and-hold thesis.
- At projected returns (-3.0% appreciation + 0.0% rent growth), your $22k cash investment doubles in ~8 years — after that, you're playing with house money.
Negotiation context
- It's been on market 253 days — a 12% lower offer ($70k) is reasonable based on typical stale-listing flexibility.
- 3 sale attempts; this cycle's ask is 6564% above the opening price — seller raised mid-cycle; expect resistance to lowballs.
Questions for the listing agent
- It's been on market 253 days. Have you received any prior offers? Is the seller open to a 12% concession, seller financing, or rate buy-down credit?
- Have any recent inspections been done? Can we get a copy of the seller's disclosures and any deferred-maintenance estimates?
- Why hasn't it sold? Are there any deal-killer items the seller is aware of (foundation, flood, title, zoning, code violations)?
- Is there a deadline driving the sale (1031 exchange, divorce, estate, relocation)? That informs how much negotiation room exists.
- What's the average days-on-market for RENTAL listings here right now (not sales)? A rising rental-DOM trend means longer vacancies and softer asking-rent achievability than the comps imply.
- What's the recent tenant-quality profile in this submarket — average credit score on applications, eviction rate, late-payment / NSF rate, and stable-employment percentage? A property-management company in the area should have these aggregated.
- How much new for-sale + rental construction is in the pipeline within 1–3 miles? Heavy new supply typically softens prices + rents 12–24 months out; constrained supply supports both.
Investment metrics
- 1% rule
- 1.46% ✓
- Cap rate
- 11.86%
- Cash-on-cash
- 19.87%
- DSCR
- 1.88
- GRM
- 5.7
CMA / ARV
- ARV (median comp)
- $238,638
- List price
- $79,900
- Delta
- -66.52%
- Verdict
- UNDERPRICED
- Comps
- 1 within 2.0 mi
Projected returns pro-forma
-3.0% appreciation · 0.0% rent growth · sell at horizon
- IRR
- 8.5%
- Equity multiple
- 1.32×
- Total profit
- $7,237
- Equity at exit
- $11,913
- IRR
- 15.1%
- Equity multiple
- 2.05×
- Total profit
- $23,522
- Equity at exit
- $6,908
Cash invested: $22,372 (down + closing). Projections, not guarantees.
Landlord ↔ Tenant lean methodology
- Overall (STATE)
- 62 Landlord-Friendly
- State Michigan
- 62 Landlord-Friendly · EVEN
- County
- — inherits STATE
- City
- — inherits STATE
ZIP-level market 49009
- Rents YoY
- -5.0%
- Active inventory
- 378
- Price-to-rent
- 5.7×
Monthly cashflow live
- Estimated rent
- $1,168 medium interval (Pro) →
- Mortgage (P&I)
- −$419
- Tax est. 1.5%
- −$100 /mo · $1,198/yr
- Insurance
- −$33
- HOA
- −$0
- Vacancy / Maint / Mgmt
- −$245
- Net cashflow
- $370
Break-even live
Sensitivity live
| Price | -10% $426 | -5% $398 | +0% $370 | +5% $343 | +10% $315 |
|---|---|---|---|---|---|
| Rent | -10% $278 | -5% $324 | +0% $370 | +5% $416 | +10% $463 |
| Rate | -1.0pp $411 | -0.5pp $391 | base $370 | +0.5pp $350 | +1.0pp $329 |
UW: 25.0% down · 7.5% · 30yr · 1.5% tax · 5.0% vac · 8.0% maint · 8.0% mgmt
Financing live
Cash to close
- Down payment
- $19,975
- Closing costs
- $2,397
- Reserves months
- —
- Total cash needed
- —
Loan-product check · same deal, 3 products live
Conventional
25% down · 7.5% · 30yr
- Down + closing
- —
- Monthly P&I
- —
- Monthly cashflow
- —
- DSCR
- —
- Eligible?
- —
Personal DTI + credit; lowest rate.
DSCR
20% down · 8.5% · 30yr
- Down + closing
- —
- Monthly P&I
- —
- Monthly cashflow
- —
- DSCR
- —
- Eligible?
- —
No personal income docs; deal must DSCR.
Hard money
10% down · 12.0% · 12mo
- Down + closing
- —
- Monthly P&I
- —
- Monthly cashflow
- —
- DSCR
- —
- Eligible?
- —
Short-term bridge; refi at stabilization.
Rent comps 1 comps
| Address | Beds | Baths | Sqft | Rent | $/sqft | DOM | Units | Dist |
|---|---|---|---|---|---|---|---|---|
| 4797 S 4th St Kalamazoo, MI | 2.0–3.0 | 1.0–2.0 | 1064 | $1,059 | $1.00 | 14d | 1 | 0.05mi |
Listing history 21 events
-
2026-06-18days on market $79,900 Active 253 DOM
-
2026-06-17days on market $79,900 Active 252 DOM
-
2026-06-16days on market $79,900 Active 251 DOM
-
2026-06-15days on market $79,900 Active 250 DOM
-
2026-06-14days on market $79,900 Active 248 DOM
-
2026-06-13days on market $79,900 Active 247 DOM
-
2026-06-10days on market $79,900 Active 245 DOM
-
2026-06-09days on market $79,900 Active 244 DOM
-
2026-06-08days on market $79,900 Active 243 DOM
-
2026-06-07days on market $79,900 Active 242 DOM
-
2026-06-05days on market $79,900 Active 239 DOM
-
2026-06-03days on market $79,900 Active 238 DOM
-
2026-06-02days on market $79,900 Active 237 DOM
-
2026-06-01days on market $79,900 Active 236 DOM
-
2026-05-31days on market $79,900 Active 235 DOM
-
2026-05-30days on market $79,900 Active 234 DOM
-
2026-01-21historical $1,199
-
2026-01-20$1,199
-
2025-10-14historical $1,389
-
2025-10-09$1,389
-
2025-10-08$79,900 Active 347-char remark
Show marketing remark (347 chars)
Limited Time: 2 Months FREE RENT! Enjoy this gorgeous 2 bedroom, 2 bathroom home in Woodland Estates! Open concept with amazing light, beautiful flooring, and modern finishes. Central heat & air, plus full kitchen with oven, fridge, and microwave. Includes a 2-car driveway! E. H. O. Free application: Code 311RENT50OFFAPP Apply Click Here
ⓘ Source: listings_history table (triggers on properties + properties_extension) + one-shot
backfill from property_details.listing_events for pre-trigger history.
Nearby sold comps map
Loading sold comps map…
Walkable amenities ~0.75 mi
Loading nearby amenities…
Taxation est. · year 1
- Rental income
- $14,013
- − Mortgage interest
- −$4,476
- − Property taxes
- −$1,198
- − Insurance
- −$400
- − Repairs & maintenance
- −$1,121
- − Management
- −$1,121
- − Depreciation
- −$2,324
- Taxable income
- $3,373
- Est. tax owed @ 24.0%
- −$810
- After-tax cash flow
- $3,635/yr
For passive investors: Depreciation is non-cash, so a rental often shows a tax loss while cash-flowing — sheltering income. Rental losses are passive: they offset passive income freely, and up to $25,000/yr can offset ordinary (W-2) income if you actively participate and your MAGI is under $100k (phasing out to $0 by $150k); unused losses carry forward. On sale, claimed depreciation is recaptured at up to 25%, and gains may owe capital-gains tax (a 1031 exchange can defer both). Figures are a year-1 estimate at your 24.0% rate — not tax advice; consult a CPA.
Condition & rehab AI · 1 photo
This manufactured home requires moderate repairs and maintenance, with a focus on painting, landscaping, and HVAC maintenance to improve its resale and rental value.
Repairs flagged
- Minor kitchen cabinets — Standard kitchen cabinets may need touch-up paint.
- Minor bathroom fixtures — Standard bathroom fixtures may need cleaning or minor repairs.
- Minor paint touch-ups — Interior walls and paint may need touch-ups for a fresh look.
- Minor landscaping — Landscaping may need trimming and planting to enhance curb appeal.
Value-add opportunities
- Both Painting and touch-up work — Fresh paint enhances both resale and rental value.
- Both Landscaping improvements — Enhanced landscaping improves curb appeal and rental value.
- Rental HVAC maintenance — A well-maintained HVAC system improves tenant satisfaction and reduces maintenance costs.
Renovation cost estimate screening
| Repair item | Severity | Est. cost |
|---|---|---|
| kitchen cabinets · Standard kitchen cabinets may need touch-up paint. | Minor | $500–3,000 |
| bathroom fixtures · Standard bathroom fixtures may need cleaning or minor repairs. | Minor | $500–3,000 |
| paint touch-ups · Interior walls and paint may need touch-ups for a fresh look. | Minor | $500–3,000 |
| landscaping · Landscaping may need trimming and planting to enhance curb appeal. | Minor | $500–3,000 |
| Total estimated repair cost · 4 items | $2,000–12,000 |
Value-add ROI direction
- Both Painting and touch-up work — Fresh paint enhances both resale and rental value. ↑
- Both Landscaping improvements — Enhanced landscaping improves curb appeal and rental value. ↑
- Rental HVAC maintenance — A well-maintained HVAC system improves tenant satisfaction and reduces maintenance costs. ↑
ⓘ Cost ranges are severity-bucket heuristics (US national rule-of-thumb). Get contractor quotes + a written scope before underwriting a rehab budget.
Schools (NCES district)
- District
- Mattawan Consolidated School
- NCES district ID
- 2623250
- Math proficiency
- 51% ▼ -8.00%
- Reading proficiency
- 62% ▼ -5.00%
- Median HH income
- $76,525
- Composite
- 50.67/100
- National rank
- #1825
- State rank
- #50 of 540 in MI
Livability — Oshtemo
No livability data for this city. (Only ~50 U.S. cities are tracked.)
Census & demographics
- County
- Kalamazoo County · 224,317 people
- Metro
- Kalamazoo-Portage, MI
- Population (ZIP)
- 47,971
- Household income
- $80,930
- Rent vs Own
- Severe rent burden
- 1579.0
Population outlook (Kalamazoo County) Hauer SSP2
- Today (2025)
- 280,982 people
- By 2030
- 292,068 · +3.9%
- By 2040
- 312,191 · +11.1%
- By 2050
- 331,196 · +17.9%
- By 2075
- 379,021 · +34.9%
- By 2100
- 396,579 · +41.1%
Race, ethnicity, and origin ACS 2023
- Neighborhood character
- Predominantly White (75%)
- Race & ethnicity
- White 75% Two or more races 9% Black 8% Asian 5% Hispanic / Latino 4%
- Common ancestry
- Iranian 9% Romanian 6% Lithuanian 2%
- Foreign-born
- 9% · Canada, China
- Languages at home
- 88% English-only · Other Indo-European 3% Arabic 2% Spanish 2%
Political lean MEDSL · Kalamazoo
- 2024 margin
- D (+17.7) · D 58.0% · R 40.3% · Other 1.7%
- 2008→2024 swing
- -1.8pp toward R · 2008: 19.5pp · 2024: 17.7pp
- All cycles
- 2024: D+17.7 2020: D+18.7 2016: D+12.8 2012: D+13.3 2008: D+19.5
Not yet ingested
- Civics
- —
Market trends
- HPI YoY
- ▼ -207.34%
- Current HPI
- 209.5649
- Rent YoY
- ▼ -4.96%
- Metro
- Kalamazoo-Portage, MI
- State GDP YoY
- ▲ 1.37%
- F500 in state
- 28
Industry mix (Fortune 500 HQ in MI)
| Industry | F500 HQs | Revenue |
|---|---|---|
| Automotive Parts | 3 | $48B |
|
||
| Automotive | 2 | $372B |
|
||
| Chemicals | 1 | $45B |
|
||
| Automotive Retail | 1 | $29B |
|
||
| Healthcare / Medical Devices | 1 | $23B |
|
||
| Automotive Technology | 1 | $20B |
|
||
Price history
-98.5% since first listed5 events — show timeline
- 2026-01-21 Rental Removed $1,199 Avail
- 2026-01-20 Listed for Rent $1,199 Avail
- 2025-10-14 Rental Removed $1,389 Avail
- 2025-10-09 Listed for Rent $1,389 Avail
- 2025-10-08 Listed $79,900 ForSaleByOwner.com
Cash-flow waterfall
monthlySold comps — $/sqft
last 12 mo · ≤1 miLoading sold comps…