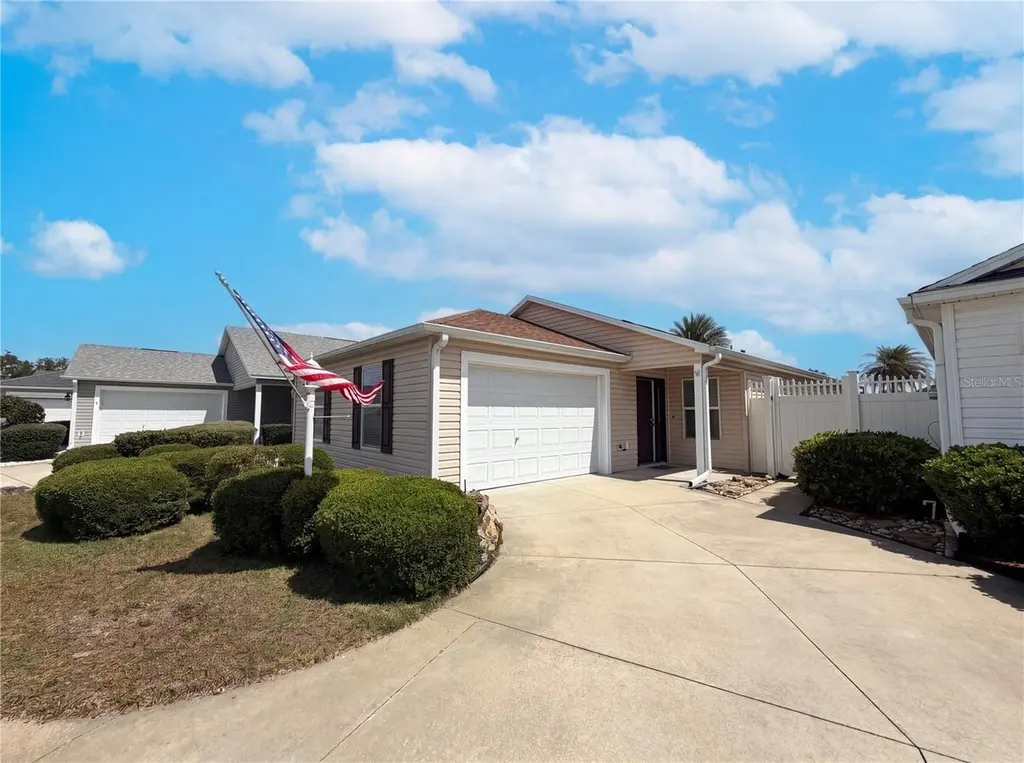
2589 Alcade Pl · The Villages, FL
Flood risk 1/10 · Minimal
- FEMA flood zone
- X (unshaded)
- Chance of flooding over 30 yrs
- 0.0%
- Est. flood insurance / yr
- $507 – $1,088
Fire risk 3/10 · Minor
- Est. fire insurance / yr
- $947 – $1,759
Heat risk 9/10 · Severe
- Hot days now (above 108°F)
- 7 days/yr
- Hot days in 30 yrs
- 24 days/yr
Wind risk 9/10 · Severe
- Chance of severe wind over 30 yrs
- 99.0%
Air-quality risk 2/10 · Minimal
- Unhealthy air days now
- 1 days/yr
- Unhealthy air days in 30 yrs
- 2 days/yr
Risk factors via First Street. Map © Google.
Why this score? — see what drove the C grade
The composite is a weighted blend of 9 inputs, each scored 0–100. Each bar is that input's sub-score; the figure is the points it added to the 100-point composite (weight × sub-score).
- ARV discount +15.0/15.0
- Cash flow +12.6/30.0
- Appreciation +10.0/10.0
- Schools +5.2/10.0
- 1% rule +4.1/10.0
- DSCR +3.7/10.0
- Livability +3.5/5.0
- Rent growth +2.5/5.0
- Condition / age +2.5/5.0
$278,000
🖨 Deal sheet (PDF) 📄 Offer letter ✓ Due diligence
Listing remarks
One or more photo(s) has been virtually staged. Welcome to 2589 Alcade Place, where everyday living feels like a getaway. Nestled in the highly sought-after Village of Collier within The Villages, this beautifully maintained home offers the perfect blend of comfort, convenience, and lifestyle. Built in 2014 this 3-bedroom, 2-bath home offers 1,357 sq ft of bright, inviting living space with an open-concept layout, vaulted ceilings, and a seamless flow designed for both entertaining and everyday living. Natural light fills the home, creating a warm and welcoming atmosphere from the moment you walk in. The spacious kitchen is designed to bring family and friends together, featuring ample cab
Key facts
- Resort-style pools
- Spacious kitchen
- Screened porch
Tags
Property features AI
Finance
- Other: Lease restrictions apply; Unfurnished; Number of rooms: 6
- Financial info: CDD present; Total monthly fees listed as $204 (total annual fees $2,448)
- HOA & community: Community features include clubhouse, fitness center, pool, park, playground, tennis courts, pickleball courts, shuffleboard, golf course, recreation facilities, dog park, sidewalks, community mailbox, street lights; Golf carts allowed; Senior community; Pets allowed; Association amenities include pool; Association fee includes pool
Exterior
- Parking: Driveway; Garage door opener; Ground-level attached garage; 1-car garage
- Security: Smoke detector(s)
- Utilities: Public water; Public sewer; Electricity connected; Sewer connected; Water connected; Cable available; BB/HS internet available; Underground utilities; Irrigation equipment
- Home design: Single family residence; Attached property; One-story (single level); North-facing
- Construction: Vinyl siding; Shingle roof; Slab foundation; Completed condition; Built as part of a planned unit development
- Exterior features: Covered screened rear porch; Patio/porch with sliding doors; Rain gutters; Sidewalk; Masonry and vinyl fencing; Mature landscaping; Landscaped lot; Paved, asphalt road access
Interior
- Kitchen: Dishwasher; Microwave; Range; Refrigerator; Eat-in kitchen
- Bedrooms: 3 bedrooms
- Flooring: Carpet; Ceramic tile; Vinyl
- Bathrooms: 2 full bathrooms
- Heating & cooling: Central heating (electric); Central air conditioning
- Interior features: Ceiling fans; Eat-in kitchen; Living room/dining room combo; Open floorplan; Thermostat; Vaulted ceilings; Walk-in closets; Window treatments (blinds)
- Laundry & utility: Inside laundry room; Washer hookup; Electric dryer hookup
Neighborhood map
What this means for you Summary
Snapshot
- This is a 3-bed/2.0-bath single-family listed at $278k.
Deal economics
- At list price, monthly cash flow is $-37 ($-446/yr) — negative.
- To cash-flow at today's rent, offer at most $271k (2.4% below list).
- To meet the 1% rule (rent ≥ 1% of price), the offer needs to be $254k (8.5% below list).
- Recommended offer: $254k (8.5% below list) — sets the bar for 1% rule.
- Cap rate 6.1% vs local median 5.0% in The Villages — meaningfully above typical; check what's discounted (condition, days-on-market, listing class) to confirm the premium yield is real.
Location & tenants
- Location reads 70/100 on livability (#431 in FL) — a middle-class / working-renter tenant base. Strengths: crime A+, housing A, employment B+; Watch: amenities F, commute F, health & safety F.
- Sumter (rural): math 61% / reading 61% proficiency, ranked #11 of 73 in FL (top 15%) — acceptable for families but not a draw, mixed tenant base, ~2y average lease.
- Zoned schools: Wildwood Elementary School (math 49% / reading 52%, grade D+, #1,055 of 2,144 statewide, top 50%, 940 students, 76% FRL); South Sumter Middle School (math 55% / reading 54%, grade B-, #183 of 571 statewide, top 34%, 897 students, 61% FRL) — zoned schools average 68% FRL vs 51% district-wide (18 pts higher); higher-poverty schools than district average — tighter screening recommended.
- Market conditions: 269 active listings in the ZIP; 12 comparable units currently listed for rent nearby; rentals at typical pace (median 23d on market — plan ~3-4 weeks tenant-placement turnaround); solid renter incomes; 3,961 units permitted in Sumter County in 2024 (248 in 5+ unit buildings).
- This rent runs 32% of the median local income ($97k/yr) — at the standard rent-burdened threshold; future hikes will face affordability resistance.
Forward outlook
- In year one you build about $30k of equity ($2k loan paydown + $28k appreciation (10.0% local appreciation)).
- Sumter County population projected at +45% by 2050 — long-run rental-demand tailwind backs the buy-and-hold thesis.
- At projected returns (10.0% appreciation + 3.0% rent growth), your $78k cash investment doubles in ~3 years — after that, you're playing with house money.
- By year 2, paydown + projected appreciation supports a ~$48k cash-out refi (75% LTV) — recoverable capital for the next deal without selling this one.
Negotiation context
- Only 6 days on market — expect competitive offers; lowballing is unlikely to land.
Risks & watch-outs
- Climate carrying-cost: severe wind risk, 99% chance of damaging wind over 30y; extreme-heat days projected 7→24/yr by 2055 (HVAC capex compounding) — expect insurance premiums to compound above CPI over the hold.
Questions for the listing agent
- What do current leases actually rent for vs. the listed asking? Can we see a recent rent roll and the last 12 months of T-12 income?
- What does the HOA fee cover, when was the last increase, and are there any pending special assessments or reserve-fund shortfalls?
- Is there a deadline driving the sale (1031 exchange, divorce, estate, relocation)? That informs how much negotiation room exists.
- Schools are A-rated — typically a magnet for longer-tenancy family renters. What's the average tenant stay here, and is there a school-zone premium baked into asking?
- What's the average days-on-market for RENTAL listings here right now (not sales)? A rising rental-DOM trend means longer vacancies and softer asking-rent achievability than the comps imply.
- What's the recent tenant-quality profile in this submarket — average credit score on applications, eviction rate, late-payment / NSF rate, and stable-employment percentage? A property-management company in the area should have these aggregated.
- How much new for-sale + rental construction is in the pipeline within 1–3 miles? Heavy new supply typically softens prices + rents 12–24 months out; constrained supply supports both.
Investment metrics
- 1% rule
- 0.91% ✗
- Cap rate
- 6.13%
- Cash-on-cash
- -0.57%
- DSCR
- 0.97
- GRM
- 9.1
CMA / ARV
- ARV (on-the-fly)
- $352,820
- Comps found
- 12
Show comp detail 12 sales within ~0.75 mi
| Address | Dist | Beds/Ba | Sqft | Sold | Price | $/sf | Match |
|---|---|---|---|---|---|---|---|
| 3493 Habersham Ct | 0.43mi | 3/2.0 | 1,446 (+7%) | 6mo | $438,000 | $303 | 64 |
| 3457 Carrabelle Ct | 0.06mi | 2/2.0 (-1) | 1,156 (-15%) | 5mo | $285,000 | $247 | 63 |
| 3554 Marianna Pl | 0.39mi | 3/2.0 | 1,416 (+4%) | 17mo | $410,000 | $290 | 60 |
| 3481 Oldham Ln | 0.48mi | 3/2.0 | 1,504 (+11%) | 2mo | $385,000 | $256 | 58 |
| 2932 Beadle Pl | 0.60mi | 3/2.0 | 1,473 (+8%) | 4mo | $440,000 | $299 | 54 |
| 3459 Oldham Ln | 0.48mi | 3/2.0 | 1,446 (+7%) | 15mo | $420,000 | $290 | 54 |
| 3438 Alwyne Ave | 0.12mi | 2/2.0 (-1) | 1,188 (-12%) | 19mo | $277,000 | $233 | 53 |
| 3562 Farrell Ave | 0.63mi | 3/2.0 | 1,473 (+8%) | 4mo | $435,000 | $295 | 53 |
| 3382 Carrabelle Ct | 0.19mi | 2/2.0 (-1) | 1,156 (-15%) | 12mo | $285,000 | $247 | 52 |
| 2621 Margaret Pl | 0.22mi | 2/2.0 (-1) | 1,156 (-15%) | 20mo | $300,000 | $260 | 43 |
| 3090 Loyola Ct | 0.69mi | 2/2.0 (-1) | 1,156 (-15%) | 6mo | $265,000 | $229 | 33 |
| 3407 Melbourne Ln | 0.75mi | 3/2.0 | 1,559 (+15%) | 11mo | $394,000 | $253 | 31 |
Match score weights: distance 35% · size 25% · config 20% · recency 20%. Top-matched comps best support the ARV.
Projected returns pro-forma
10.0% appreciation · 3.0% rent growth · sell at horizon
- IRR
- 23.9%
- Equity multiple
- 2.92×
- Total profit
- $149,153
- Equity at exit
- $250,444
- IRR
- 21.2%
- Equity multiple
- 6.67×
- Total profit
- $441,322
- Equity at exit
- $540,093
Cash invested: $77,840 (down + closing). Projections, not guarantees.
Landlord ↔ Tenant lean methodology
- Overall (STATE)
- 87 Strongly Landlord-Friendly
- State Florida
- 87 Strongly Landlord-Friendly · R+3
- County
- — inherits STATE
- City
- — inherits STATE
ZIP-level market 32163
- Home prices YoY
- 9.8%
- Active inventory
- 269
- Price-to-rent
- 9.1×
Monthly cashflow live
- Estimated rent
- $2,543 high interval (Pro) →
- Mortgage (P&I)
- −$1,458
- Tax from tax record
- −$269 /mo · $3,223/yr
- Insurance
- −$116
- HOA
- −$204
- Vacancy / Maint / Mgmt
- −$534
- Net cashflow
- $-37
Break-even live
Sensitivity live
| Price | -10% $120 | -5% $41 | +0% $-37 | +5% $-116 | +10% $-195 |
|---|---|---|---|---|---|
| Rent | -10% $-238 | -5% $-138 | +0% $-37 | +5% $63 | +10% $164 |
| Rate | -1.0pp $103 | -0.5pp $34 | base $-37 | +0.5pp $-109 | +1.0pp $-183 |
UW: 25.0% down · 7.5% · 30yr · 1.5% tax · 5.0% vac · 8.0% maint · 8.0% mgmt
Financing live
Cash to close
- Down payment
- $69,500
- Closing costs
- $8,340
- Reserves months
- —
- Total cash needed
- —
Loan-product check · same deal, 3 products live
Conventional
25% down · 7.5% · 30yr
- Down + closing
- —
- Monthly P&I
- —
- Monthly cashflow
- —
- DSCR
- —
- Eligible?
- —
Personal DTI + credit; lowest rate.
DSCR
20% down · 8.5% · 30yr
- Down + closing
- —
- Monthly P&I
- —
- Monthly cashflow
- —
- DSCR
- —
- Eligible?
- —
No personal income docs; deal must DSCR.
Hard money
10% down · 12.0% · 12mo
- Down + closing
- —
- Monthly P&I
- —
- Monthly cashflow
- —
- DSCR
- —
- Eligible?
- —
Short-term bridge; refi at stabilization.
Rent comps 12 comps
| Address | Beds | Baths | Sqft | Rent | $/sqft | DOM | Units | Dist |
|---|---|---|---|---|---|---|---|---|
| 2577 Lindewood St The Villages, FL | 2.0 | 2.0 | 1206 | $2,495 | $2.07 | 22d | 1 | 0.09mi |
| 6629 Dan DiCiolla Dr Wildwood, FL | 1.0–3.0 | 1.0–2.5 | 1075 | $2,399 | $2.23 | 22d | 44 | 0.54mi |
| 3480 Kewadin Ave The Villages, FL | 2.0 | 2.0 | 1758 | $2,500 | $1.42 | 22d | 1 | 0.58mi |
| 7011 Homestead Lp Wildwood, FL | 1.0–3.0 | 1.0–2.0 | 998 | $1,759 | $1.76 | 22d | 22 | 0.69mi |
| 3064 Gulfport Ct The Villages, FL | 2.0 | 2.0 | 1602 | $2,800 | $1.75 | 22d | 1 | 0.76mi |
| 3025 Bartow Ln The Villages, FL | 3.0 | 2.0 | 1415 | $3,500 | $2.47 | 22d | 1 | 0.83mi |
| 2910 Monument Way The Villages, FL | 2.0 | 2.0 | 1494 | $2,600 | $1.74 | 22d | 1 | 1.13mi |
| 1016 Century Dr Wildwood, FL | 2.0 | 2.0 | 1022 | $1,399 | $1.37 | 22d | 1 | 1.22mi |
| 5267 Dragonfly Dr Wildwood, FL | 3.0 | 2.5 | 1688 | $1,945 | $1.15 | 22d | 1 | 1.23mi |
| 5115 Spanish Harbor Dr Wildwood, FL | 1.0–3.0 | 1.0–2.0 | 990 | $1,680 | $1.70 | 22d | 29 | 1.29mi |
| 5339 Loblolly Ln Wildwood, FL | 3.0 | 2.5 | 1688 | $2,000 | $1.18 | 22d | 1 | 1.34mi |
| 605 Sunnyside Dr Wildwood, FL | 2.0 | 2.0 | 900 | $1,275 | $1.42 | 22d | 1 | 1.35mi |
HOA detail
- Monthly dues
- $204 · $2,448/yr
Listing history 1 events
-
2026-05-21$278,000 Active
ⓘ Source: listings_history table (triggers on properties + properties_extension) + one-shot
backfill from property_details.listing_events for pre-trigger history.
Tax reassessment forecast FL · Resets to sale price
- Current annual tax
- $3,223 · $269/mo
- Projected year-2 tax
- $3,223 · $269/mo
- Expected delta
- $0/yr ($0/mo · 0.0%)
ⓘ Screening estimate from a state-policy table — verify with the county assessor before closing.
Climate risk First Street
- Flood 1/10 Low FEMA zone X (unshaded) · 0% chance over 30 yrs
- Wildfire 3/10 Moderate
- Heat 9/10 Extreme 7 d/yr ≥108°F today · 24 d/yr by 30 yrs out
- Wind 9/10 Extreme 99% chance of damaging wind over 30 yrs
- Air quality 2/10 Low 1 unhealthy d/yr today · 2 by 30 yrs out
Nearby sold comps map
Loading sold comps map…
Walkable amenities ~0.75 mi
Loading nearby amenities…
Taxation est. · year 1
- Rental income
- $30,518
- − Mortgage interest
- −$15,572
- − Property taxes
- −$3,223
- − Insurance
- −$1,390
- − Repairs & maintenance
- −$2,441
- − Management
- −$2,441
- − HOA
- −$2,448
- − Depreciation
- −$8,087
- Taxable loss
- −$5,086
- Est. tax savings @ 24.0%
- +$1,221
- After-tax cash flow
- $774/yr
For passive investors: Depreciation is non-cash, so a rental often shows a tax loss while cash-flowing — sheltering income. Rental losses are passive: they offset passive income freely, and up to $25,000/yr can offset ordinary (W-2) income if you actively participate and your MAGI is under $100k (phasing out to $0 by $150k); unused losses carry forward. On sale, claimed depreciation is recaptured at up to 25%, and gains may owe capital-gains tax (a 1031 exchange can defer both). Figures are a year-1 estimate at your 24.0% rate — not tax advice; consult a CPA.
Schools (NCES district)
- District
- Sumter
- NCES district ID
- 1201800
- Math proficiency
- 61% ▼ -4.00%
- Reading proficiency
- 61% ▼ -2.00%
- Median HH income
- $48,240
- Composite
- 51.74/100
- National rank
- #1682
- State rank
- #11 of 73 in FL
Livability — The Villages
- Score
- 70/100
- State rank
- #431
- US rank
- #7363
Category grades
Schools grade is shown separately in the Schools card above.
Census & demographics
- Census place
- The Villages, FL
- County
- Sumter County · 110,591 people
- City population
- 83,973
- Metro
- The Villages, FL
- Population (ZIP)
- 28,549
- Household income
- $96,775
- Rent vs Own
- Severe rent burden
- 307.0
Population outlook (Sumter County) Hauer SSP2
- Today (2025)
- 161,172 people
- By 2030
- 180,083 · +11.7%
- By 2040
- 209,892 · +30.2%
- By 2050
- 234,186 · +45.3%
- By 2075
- 284,602 · +76.6%
- By 2100
- 317,039 · +96.7%
Race, ethnicity, and origin ACS 2023
- Neighborhood character
- Predominantly White (95%)
- Race & ethnicity
- White 95% Two or more races 2% Hispanic / Latino 2% Asian 1%
- Common ancestry
- Romanian 6% Lithuanian 3% Iranian 3%
- Foreign-born
- 6% · Canada, Vietnam
- Languages at home
- 96% English-only · Spanish 2% Vietnamese 1% Other Indo-European 0%
Political lean MEDSL · Sumter
- 2024 margin
- Solid R (+37.6) · D 30.9% · R 68.6%
- 2008→2024 swing
- -10.6pp toward R · 2008: -27.0pp · 2024: -37.6pp
- All cycles
- 2024: R+37.6 2020: R+36.1 2016: R+39.2 2012: R+34.9 2008: R+27.0
Not yet ingested
- Civics
- —
Market trends
- HPI YoY
- ▲ 20.47%
- Current HPI
- 229.0075
- Rent YoY
- —
- Metro
- The Villages, FL
- State GDP YoY
- ▲ 3.28%
- F500 in state
- 36
Industry mix (Fortune 500 HQ in FL)
| Industry | F500 HQs | Revenue |
|---|---|---|
| Industrial Technology | 2 | $29B |
|
||
| Insurance | 2 | $17B |
|
||
| Retail | 1 | $60B |
|
||
| Technology Distribution | 1 | $58B |
|
||
| Homebuilding | 1 | $35B |
|
||
| Technology Manufacturing | 1 | $35B |
|
||
Price history
1 event — show timeline
- 2026-05-21 Listed $278,000 Stellar MLS as Distributed by MLS Grid
Property tax history
+7.3%/yrLatest (2025): $3,223 · +1.9% YoY. Source: county tax records.
Cash-flow waterfall
monthlySold comps — $/sqft
last 12 mo · ≤1 miLoading sold comps…