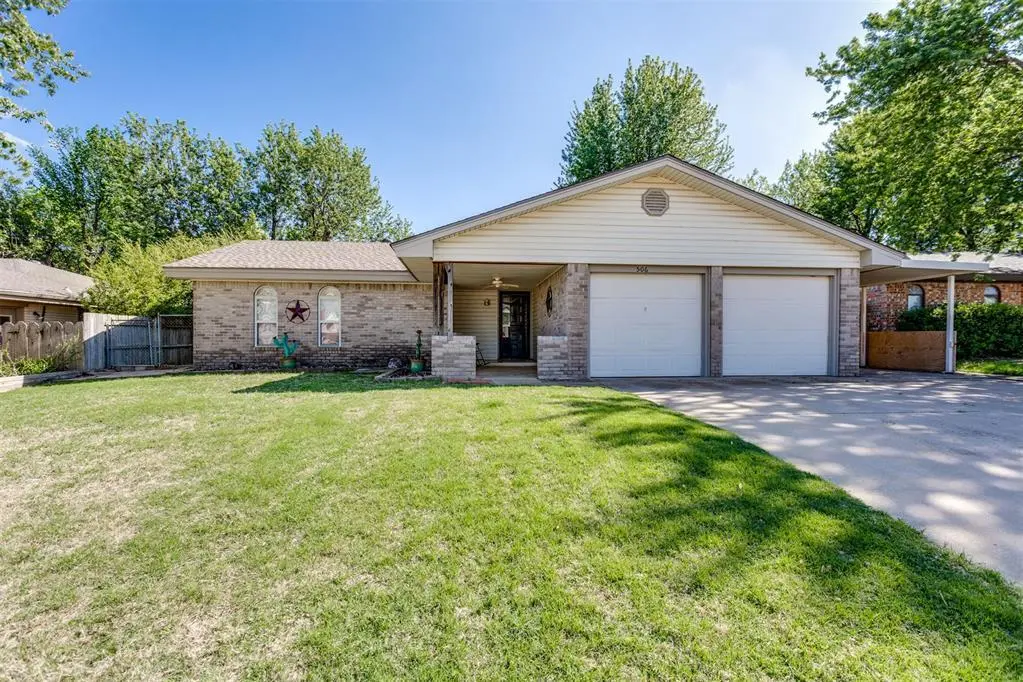
506 Queensboro Pl · Yukon, OK
Flood risk 1/10 · Minimal
- FEMA flood zone
- X (unshaded)
- Chance of flooding over 30 yrs
- 0.0%
- Est. flood insurance / yr
- $507 – $1,088
Fire risk 4/10 · Minor
- Est. fire insurance / yr
- $2,463 – $4,575
Heat risk 6/10 · Moderate
- Hot days now (above 107°F)
- 7 days/yr
- Hot days in 30 yrs
- 19 days/yr
Wind risk 2/10 · Minimal
- Chance of severe wind over 30 yrs
- 2.0%
Air-quality risk 1/10 · Minimal
- Unhealthy air days now
- 0 days/yr
- Unhealthy air days in 30 yrs
- 0 days/yr
Risk factors via First Street. Map © Google.
Why this score? — see what drove the D grade
The composite is a weighted blend of 9 inputs, each scored 0–100. Each bar is that input's sub-score; the figure is the points it added to the 100-point composite (weight × sub-score).
- Cash flow +14.7/30.0
- ARV discount +9.7/15.0
- DSCR +4.5/10.0
- Livability +3.4/5.0
- 1% rule +3.1/10.0
- Rent growth +2.8/5.0
- Schools +2.8/10.0
- Condition / age +2.5/5.0
- Appreciation +0.0/10.0
$194,500
🖨 Deal sheet 📄 Offer letter ✓ Due diligence
Listing remarks
Welcome home to this well-kept 3 bedroom, 2 full bath property nestled in one of Yukon’s most established and convenient areas. The classic brick and frame exterior sets the tone, while the extra-wide driveway and additional parking pad offer the perfect spot for a motorcycle, small trailer, or extra vehicle. Step inside to a warm living area featuring a brick fireplace with built-ins and a beamed ceiling that adds character and comfort. The kitchen and dining spaces flow easily for everyday living, and one of the bedrooms has been thoughtfully transitioned into a storage and workspace, ideal for hobbies, crafts, or organization. Outdoor living shines here, too. Enjoy a covered front
Key facts
- Covered front porch
- Extra-wide driveway
- Brick fireplace
Tags
Neighborhood map
What this means for you Summary
Snapshot
- This is a 3-bed/2.0-bath single-family listed at $194k.
Deal economics
- At list price, monthly cash flow is $49 ($590/yr) — positive.
- The deal already cash-flows at list — no discount required.
- To meet the 1% rule (rent ≥ 1% of price), the offer needs to be $157k (19.4% below list).
- Recommended offer: $157k (19.4% below list) — sets the bar for 1% rule.
- Cap rate 6.6% vs local median 4.9% in Yukon — top-decile yield for the area; either an underpriced asset or a hidden risk that comps aren't pricing in. Stress-test before assuming the spread holds.
Location & tenants
- Location reads 67/100 on livability (#96 in OK) — a middle-class / working-renter tenant base. Strengths: cost of living A+, housing A+, crime A-; Watch: amenities F, commute F, health & safety F.
- Yukon (suburban): math 30% / reading 32% proficiency, ranked #47 of 270 in OK (top 17%) — families likely to look elsewhere, expect single-tenant / working-renter base with shorter leases.
- Zoned schools: Myers Es (math 34% / reading 24%, grade F, #255 of 845 statewide, top 35%, 456 students, 0% FRL); Yukon Hs (math 26% / reading 38%, grade F, #67 of 447 statewide, top 16%, 2,833 students, 0% FRL) — zoned schools average 0% FRL vs 32% district-wide (32 pts lower); this property's tenant base skews higher-income than the district average.
- Market conditions: Rents rising (+1.2%/yr); 1560 active listings in the ZIP; 23 comparable units currently listed for rent nearby; rentals leasing fast (median 11d on market — plan ~1-2 weeks tenant-placement turnaround); solid renter incomes; 260 units permitted in Canadian County in 2024 (0 in 5+ unit buildings).
Forward outlook
- Local home prices are declining (-3.0%/yr); year-one equity from $1k of loan paydown is wiped out by about $6k of value loss. Plan a longer hold.
- Canadian County population projected at +64% by 2050 — long-run rental-demand tailwind backs the buy-and-hold thesis.
Negotiation context
- Only 1 days on market — expect competitive offers; lowballing is unlikely to land.
Risks & watch-outs
- Climate carrying-cost: extreme-heat days projected 7→19/yr by 2055 (HVAC capex compounding) — expect insurance premiums to compound above CPI over the hold.
Questions for the listing agent
- Built in 1971 — when were the roof, HVAC, electrical panel, plumbing, and water heater last replaced?
- Is there a deadline driving the sale (1031 exchange, divorce, estate, relocation)? That informs how much negotiation room exists.
- The area grade is low — what's the realistic commute time and amenity access for the typical tenant pool here? Any planned neighborhood developments (good or bad) we should know about?
- What's the average days-on-market for RENTAL listings here right now (not sales)? A rising rental-DOM trend means longer vacancies and softer asking-rent achievability than the comps imply.
- What's the recent tenant-quality profile in this submarket — average credit score on applications, eviction rate, late-payment / NSF rate, and stable-employment percentage? A property-management company in the area should have these aggregated.
- How much new for-sale + rental construction is in the pipeline within 1–3 miles? Heavy new supply typically softens prices + rents 12–24 months out; constrained supply supports both.
Investment metrics
- 1% rule
- 0.81% ✗
- Cap rate
- 6.60%
- Cash-on-cash
- 1.08%
- DSCR
- 1.05
- GRM
- 10.3
CMA / ARV
- ARV (on-the-fly)
- $204,490
- Comps found
- 12
Show comp detail 12 sales within ~0.75 mi
| Address | Dist | Beds/Ba | Sqft | Sold | Price | $/sf | Match |
|---|---|---|---|---|---|---|---|
| 506 Queensboro Pl | 0.00mi | 3/2.0 | 1,430 (0%) | 1mo | $200,000 | $140 | 99 |
| 401 Walnut Ave | 0.24mi | 3/2.0 | 1,435 (+0%) | 3mo | $220,000 | $153 | 86 |
| 616 Kingston Dr | 0.12mi | 2/1.5 (-1) | 1,477 (+3%) | 2mo | $187,000 | $127 | 80 |
| 621 Cherry | 0.13mi | 3/1.5 | 1,600 (+12%) | 3mo | $230,000 | $144 | 70 |
| 709 Queensboro Pl | 0.18mi | 4/2.0 (+1) | 1,538 (+8%) | 5mo | $220,000 | $143 | 69 |
| 621 Kingston Dr | 0.15mi | 3/1.5 | 1,233 (-14%) | 2mo | $202,500 | $164 | 67 |
| 903 S 3rd St | 0.23mi | 3/2.0 | 1,261 (-12%) | 5mo | $222,800 | $177 | 65 |
| 1016 Maple Ave | 0.71mi | 3/1.5 | 1,454 (+2%) | 1mo | $175,000 | $120 | 62 |
| 103 Pine Ave | 0.54mi | 3/2.0 | 1,300 (-9%) | 3mo | $184,000 | $142 | 58 |
| 1710 Ronald St | 0.64mi | 3/1.5 | 1,501 (+5%) | 4mo | $236,900 | $158 | 57 |
| 109 W Vandament Ave | 0.50mi | 3/1.0 | 1,584 (+11%) | 2mo | $155,000 | $98 | 53 |
| 218 Klondike Dr | 0.74mi | 3/1.5 | 1,615 (+13%) | 3mo | $202,000 | $125 | 40 |
Match score weights: distance 35% · size 25% · config 20% · recency 20%. Top-matched comps best support the ARV.
Projected returns pro-forma
-3.0% appreciation · 1.19% rent growth · sell at horizon
- IRR
- -16.4%
- Equity multiple
- 0.43×
- Total profit
- $-31,263
- Equity at exit
- $29,001
- IRR
- -11.4%
- Equity multiple
- 0.37×
- Total profit
- $-34,581
- Equity at exit
- $16,817
Cash invested: $54,460 (down + closing). Projections, not guarantees.
Landlord ↔ Tenant lean methodology
- Overall (STATE)
- 83 Strongly Landlord-Friendly
- State Oklahoma
- 83 Strongly Landlord-Friendly · R+20
- County
- — inherits STATE
- City
- — inherits STATE
ZIP-level market 73099
- Rents YoY
- 1.2%
- Active inventory
- 1560
- Price-to-rent
- 10.3×
Monthly cashflow live
- Estimated rent
- $1,568 high interval (Pro) →
- Mortgage (P&I)
- −$1,020
- Tax from tax record
- −$88 /mo · $1,062/yr
- Insurance
- −$81
- HOA
- −$0
- Vacancy / Maint / Mgmt
- −$329
- Net cashflow
- $49
Break-even live
UW: 25.0% down · 7.5% · 30yr · 1.5% tax · 5.0% vac · 8.0% maint · 8.0% mgmt
Financing live
Cash to close
- Down payment
- $48,625
- Closing costs
- $5,835
- Reserves months
- —
- Total cash needed
- —
Loan-product check · same deal, 3 products live
Conventional
25% down · 7.5% · 30yr
- Down + closing
- —
- Monthly P&I
- —
- Monthly cashflow
- —
- DSCR
- —
- Eligible?
- —
Personal DTI + credit; lowest rate.
DSCR
20% down · 8.5% · 30yr
- Down + closing
- —
- Monthly P&I
- —
- Monthly cashflow
- —
- DSCR
- —
- Eligible?
- —
No personal income docs; deal must DSCR.
Hard money
10% down · 12.0% · 12mo
- Down + closing
- —
- Monthly P&I
- —
- Monthly cashflow
- —
- DSCR
- —
- Eligible?
- —
Short-term bridge; refi at stabilization.
Rent comps 23 comps
| Address | Beds | Baths | Sqft | Rent | $/sqft | DOM | Units | Dist |
|---|---|---|---|---|---|---|---|---|
| 617 Queensboro Pl Yukon, OK | 4.0 | 2.0 | 1643 | $1,595 | $0.97 | 1d | 1 | 0.10mi |
| 315 Willow Pl Yukon, OK | 3.0 | 1.5 | 1044 | $1,425 | $1.36 | 23d | 1 | 0.30mi |
| 315 Willow Pl Yukon, OK | 3.0 | 1.5 | 1044 | $1,425 | $1.36 | 4d | 1 | 0.30mi |
| 1000 Cornwell Dr Yukon, OK | 1.0–2.0 | 1.0–1.5 | 950 | $975 | $1.03 | 1d | 5 | 0.40mi |
| 404 S 2nd St Yukon, OK | 2.0–3.0 | 1.0–1.5 | 934 | $875 | $0.94 | 1d | 2 | 0.44mi |
| 116 Pine Ave Yukon, OK | 3.0 | 1.0 | 1156 | $1,400 | $1.21 | 17d | 1 | 0.50mi |
| 202 Dianna Dr Yukon, OK | 3.0 | 1.5 | 939 | $1,599 | $1.70 | 14d | 1 | 0.66mi |
| 203 Gray ST Yukon, OK | 3.0 | 2.0 | 1138 | $2,850 | $2.50 | 23d | 1 | 0.89mi |
| 201 E Main St Yukon, OK | 3.0 | 2.5 | 1601 | $1,900 | $1.19 | 1d | 1 | 0.90mi |
| 224 N 3rd St Yukon, OK | 3.0 | 2.5 | 1342 | $1,500 | $1.12 | 11d | 1 | 0.90mi |
| 116 Seminole Ln Yukon, OK | 3.0 | 2.0 | 1766 | $1,700 | $0.96 | 1d | 1 | 0.93mi |
| 102 Chickasaw Ln Yukon, OK | 3.0 | 2.0 | 1468 | $1,445 | $0.98 | 23d | 1 | 0.93mi |
| 55 N Ranchwood Blvd Yukon, OK | 1.0–2.0 | 1.0–1.5 | 790 | $1,075 | $1.36 | 1d | 5 | 1.04mi |
| 1305 Creek Dr Yukon, OK | 3.0 | 2.0 | 1317 | $1,400 | $1.06 | 10d | 1 | 1.05mi |
| 100 N Kimbell Rd Yukon, OK | 1.0–2.0 | 1.0 | 900 | $850 | $0.94 | 1d | 4 | 1.10mi |
| 908 Ranchoak Ct Yukon, OK | 3.0 | 2.0 | 1200 | $1,000 | $0.83 | 14d | 1 | 1.15mi |
| 730 Arlington Dr Yukon, OK | 3.0 | 2.0 | 1376 | $1,495 | $1.09 | 11d | 1 | 1.17mi |
| 12600 NW 10th St Yukon, OK | 1.0–2.0 | 1.0–2.0 | 1118 | $2,245 | $2.01 | 1d | 8 | 1.34mi |
| 1006 Richmond St Yukon, OK | 3.0 | 2.0 | 1171 | $1,395 | $1.19 | 23d | 1 | 1.35mi |
| 1001 Walsh Ln Yukon, OK | 3.0 | 2.0 | 1596 | $1,540 | $0.96 | 23d | 1 | 1.37mi |
| 1018 Arlington Dr Yukon, OK | 3.0 | 2.0 | 1313 | $1,560 | $1.19 | 4d | 1 | 1.39mi |
| 307 Vickie Dr Yukon, OK | 3.0 | 2.0 | 1523 | $1,495 | $0.98 | 16d | 1 | 1.40mi |
| 925 Saint James Ct Unit 1 Yukon, OK | 3.0 | 2.0 | 1325 | $1,425 | $1.08 | 10d | 1 | 1.43mi |
Listing history 2 events
-
2026-04-22status Pending
-
2026-04-20$194,500 Active
ⓘ Source: listings_history table (triggers on properties + properties_extension) + one-shot
backfill from property_details.listing_events for pre-trigger history.
Tax reassessment forecast OK · Resets to sale price
- Current annual tax
- $1,062 · $88/mo
- Projected year-2 tax
- $1,750 · $146/mo
- Expected delta
- +$688/yr (+$57/mo · 64.8%)
ⓘ Screening estimate from a state-policy table — verify with the county assessor before closing.
Climate risk First Street
- Flood 1/10 Low FEMA zone X (unshaded) · 0% chance over 30 yrs
- Wildfire 4/10 Moderate
- Heat 6/10 Major 7 d/yr ≥107°F today · 19 d/yr by 30 yrs out
- Wind 2/10 Low 2% chance of damaging wind over 30 yrs
- Air quality 1/10 Low 0 unhealthy d/yr today · 0 by 30 yrs out
Nearby sold comps map
Loading sold comps map…
Walkable amenities ~0.75 mi
Loading nearby amenities…
Taxation est. · year 1
- Rental income
- $18,815
- − Mortgage interest
- −$10,895
- − Property taxes
- −$1,062
- − Insurance
- −$972
- − Repairs & maintenance
- −$1,505
- − Management
- −$1,505
- − Depreciation
- −$5,658
- Taxable loss
- −$2,783
- Est. tax savings @ 24.0%
- +$668
- After-tax cash flow
- $1,258/yr
For passive investors: Depreciation is non-cash, so a rental often shows a tax loss while cash-flowing — sheltering income. Rental losses are passive: they offset passive income freely, and up to $25,000/yr can offset ordinary (W-2) income if you actively participate and your MAGI is under $100k (phasing out to $0 by $150k); unused losses carry forward. On sale, claimed depreciation is recaptured at up to 25%, and gains may owe capital-gains tax (a 1031 exchange can defer both). Figures are a year-1 estimate at your 24.0% rate — not tax advice; consult a CPA.
Schools (NCES district)
- District
- Yukon
- NCES district ID
- 4033480
- Math proficiency
- 30% ▼ -16.00%
- Reading proficiency
- 32% ▼ -10.00%
- Median HH income
- $63,741
- Composite
- 28.35/100
- National rank
- #6776
- State rank
- #47 of 270 in OK
Livability — Yukon
- Score
- 67/100
- State rank
- #96
- US rank
- #10958
Category grades
Schools grade is shown separately in the Schools card above.
Census & demographics
- Census place
- Yukon, OK
- County
- Canadian County · 154,341 people
- City population
- 91,014
- Metro
- Oklahoma City, OK
- Population (ZIP)
- 91,014
- Household income
- $88,030
- Rent vs Own
- Severe rent burden
- 1838.0
Population outlook (Canadian County) Hauer SSP2
- Today (2025)
- 174,062 people
- By 2030
- 195,170 · +12.1%
- By 2040
- 239,293 · +37.5%
- By 2050
- 285,457 · +64.0%
- By 2075
- 403,766 · +132.0%
- By 2100
- 498,766 · +186.5%
Race, ethnicity, and origin ACS 2023
- Neighborhood character
- Predominantly White (73%)
- Race & ethnicity
- White 73% Two or more races 11% Hispanic / Latino 10% Black 3% Asian 3% Native American 3%
- Hispanic origin (detail)
- Mexican 7%
- Common ancestry
- Italian 2% Slovak 1% Portuguese 1%
- Foreign-born
- 5% · Canada, Vietnam
- Languages at home
- 91% English-only · Spanish 5% Vietnamese 2% Other Asian/Pacific 1%
Political lean MEDSL · Canadian
- 2024 margin
- Solid R (+40.4) · D 28.8% · R 69.2% · Other 2.0%
- 2008→2024 swing
- +11.9pp toward D · 2008: -52.2pp · 2024: -40.4pp
- All cycles
- 2024: R+40.4 2020: R+43.3 2016: R+51.2 2012: R+54.4 2008: R+52.2
Not yet ingested
- Civics
- —
Market trends
- HPI YoY
- ▼ -206.04%
- Current HPI
- 244.6836
- Rent YoY
- ▲ 1.19%
- Metro
- Oklahoma City, OK
- State GDP YoY
- ▲ 1.55%
- F500 in state
- 6
Industry mix (Fortune 500 HQ in OK)
| Industry | F500 HQs | Revenue |
|---|---|---|
| Energy | 3 | $48B |
|
||
Price history
2 events — show timeline
- 2026-04-22 Pending — MLSOK
- 2026-04-20 Listed $194,500 MLSOK
Property tax history
+0.8%/yrLatest (2025): $1,062 · -2.3% YoY. Source: county tax records.
Cash-flow waterfall
monthlySold comps — $/sqft
last 12 mo · ≤1 miLoading sold comps…