244 Paschel Ave · Hurlburt Field, FL
Flood risk 1/10 · Minimal
- FEMA flood zone
- X (unshaded)
- Chance of flooding over 30 yrs
- 0.0%
- Est. flood insurance / yr
- $507 – $1,088
Fire risk 6/10 · Moderate
- Est. fire insurance / yr
- $947 – $1,759
Heat risk 10/10 · Severe
- Hot days now (above 104°F)
- 7 days/yr
- Hot days in 30 yrs
- 23 days/yr
Wind risk 9/10 · Severe
- Chance of severe wind over 30 yrs
- 99.0%
Air-quality risk 2/10 · Minimal
- Unhealthy air days now
- 1 days/yr
- Unhealthy air days in 30 yrs
- 2 days/yr
Risk factors via First Street. Map © Google.
Why this score? — see what drove the C grade
The composite is a weighted blend of 9 inputs, each scored 0–100. Each bar is that input's sub-score; the figure is the points it added to the 100-point composite (weight × sub-score).
- Cash flow +25.2/30.0
- DSCR +8.3/10.0
- ARV discount +7.5/15.0
- 1% rule +5.8/10.0
- Schools +5.2/10.0
- Livability +2.5/5.0
- Condition / age +2.5/5.0
- Rent growth +2.4/5.0
- Appreciation +0.0/10.0
$179,900
🖨 Deal sheet 📄 Offer letter ✓ Due diligence
Listing remarks MLS
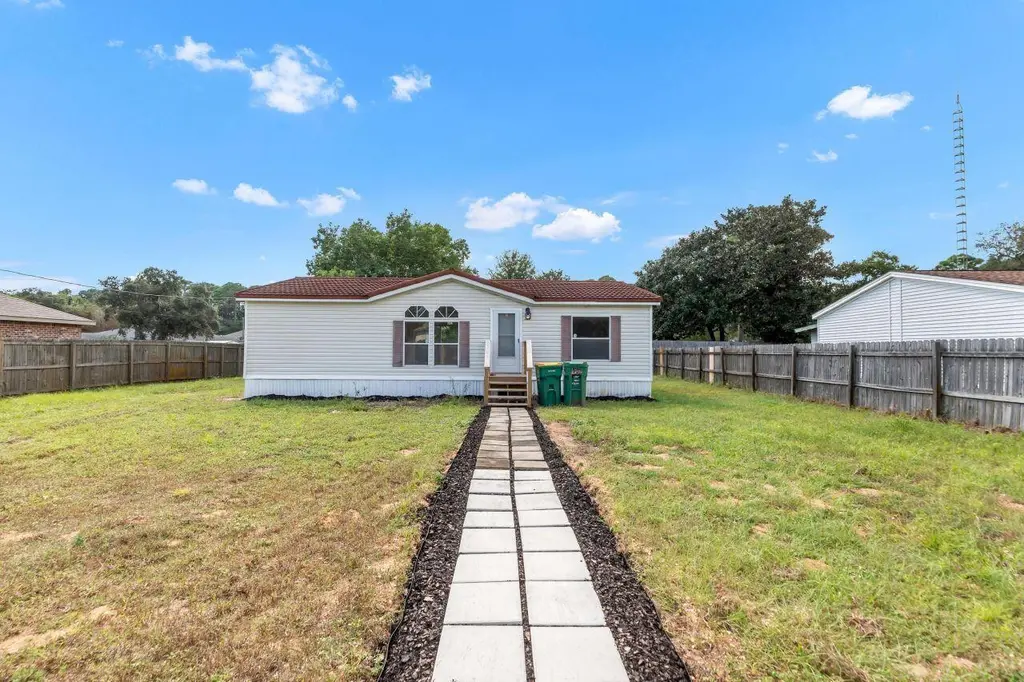
Welcome to this beautifully updated 2006-built mobile home on a . 22-acre lot in Mary Esther! Just a few miles west of Hurlburt Field, this property is tucked away at the end of a quiet street, offering privacy and comfort. Inside, you'll find: * A brand-new kitchen with modern appliances * Fresh paint throughout * New flooring, fixtures, and doors * 2 spacious bedrooms, each with its own full bathroom * The home also features a tiled roof for durability * Backyard complete with a storage shed. Whether you're looking for a starter home, downsizing, or investing, this one check all the boxes. Don't miss your chance to make it yours—schedule a showing today
Key facts
- Updated mobile home
- Tiled roof
- Brand new kitchen
Tags
Neighborhood map
What this means for you Summary
Snapshot
- This is a 2-bed/2.0-bath manufactured listed at $180k.
Deal economics
- At list price, monthly cash flow is $405 ($5k/yr) — positive.
- The deal already cash-flows at list — no discount required.
- Meets the 1% rule at list price ($2k rent vs $180k).
- Recommended offer: $158k (12.0% below list) — sets the bar for market timing.
- Cap rate 9.0% vs local median 4.6% in Hurlburt Field — top-decile yield for the area; either an underpriced asset or a hidden risk that comps aren't pricing in. Stress-test before assuming the spread holds.
Location & tenants
- Location reads: area grade C — affects rentability + tenant quality, not the cash-flow math above.
- Okaloosa (other): math 60% / reading 60% proficiency, ranked #12 of 73 in FL (top 16%) — acceptable for families but not a draw, mixed tenant base, ~2y average lease.
- Market conditions: Rents soft (-0.5%/yr); 175 active listings in the ZIP; 8 comparable units currently listed for rent nearby; rentals at typical pace (median 21d on market — plan ~3-4 weeks tenant-placement turnaround); solid renter incomes; 1,268 units permitted in Okaloosa County in 2024 (175 in 5+ unit buildings).
- This rent runs 30% of the median local income ($78k/yr) — at the standard rent-burdened threshold; future hikes will face affordability resistance.
Forward outlook
- Local home prices are declining (-3.0%/yr); year-one equity from $1k of loan paydown is wiped out by about $5k of value loss. Plan a longer hold.
- Okaloosa County population projected at +37% by 2050 — long-run rental-demand tailwind backs the buy-and-hold thesis.
Negotiation context
- It's been on market 128 days — a 12% lower offer ($158k) is reasonable based on typical stale-listing flexibility.
- 3 sale attempts since 29y ago; this cycle's ask has dropped $20k (10%) from the opening price — seller is motivated, your offer sets the floor, not the list.
Risks & watch-outs
- Climate carrying-cost: severe wind risk, 99% chance of damaging wind over 30y; major wildfire risk; extreme-heat days projected 7→23/yr by 2055 (HVAC capex compounding) — expect insurance premiums to compound above CPI over the hold.
Questions for the listing agent
- It's been on market 128 days. Have you received any prior offers? Is the seller open to a 12% concession, seller financing, or rate buy-down credit?
- Why hasn't it sold? Are there any deal-killer items the seller is aware of (foundation, flood, title, zoning, code violations)?
- Is there a deadline driving the sale (1031 exchange, divorce, estate, relocation)? That informs how much negotiation room exists.
- What's the average days-on-market for RENTAL listings here right now (not sales)? A rising rental-DOM trend means longer vacancies and softer asking-rent achievability than the comps imply.
- What's the recent tenant-quality profile in this submarket — average credit score on applications, eviction rate, late-payment / NSF rate, and stable-employment percentage? A property-management company in the area should have these aggregated.
- How much new for-sale + rental construction is in the pipeline within 1–3 miles? Heavy new supply typically softens prices + rents 12–24 months out; constrained supply supports both.
Investment metrics
- 1% rule
- 1.08% ✓
- Cap rate
- 9.00%
- Cash-on-cash
- 9.66%
- DSCR
- 1.43
- GRM
- 7.7
CMA / ARV
- ARV (median comp)
- $101,000
- List price
- $179,900
- Delta
- 78.12%
- Verdict
- OVERPRICED
- Comps
- 3 within 2.0 mi
Projected returns pro-forma
-3.0% appreciation · 0.0% rent growth · sell at horizon
- IRR
- -5.0%
- Equity multiple
- 0.82×
- Total profit
- $-9,070
- Equity at exit
- $26,824
- IRR
- 1.0%
- Equity multiple
- 1.06×
- Total profit
- $3,157
- Equity at exit
- $15,554
Cash invested: $50,372 (down + closing). Projections, not guarantees.
Landlord ↔ Tenant lean methodology
- Overall (STATE)
- 87 Strongly Landlord-Friendly
- State Florida
- 87 Strongly Landlord-Friendly · R+3
- County
- — inherits STATE
- City
- — inherits STATE
ZIP-level market 32569
- Home prices YoY
- -26.5%
- Rents YoY
- -0.5%
- Active inventory
- 175
- Price-to-rent
- 7.7×
Monthly cashflow live
- Estimated rent
- $1,946 high interval (Pro) →
- Mortgage (P&I)
- −$943
- Tax from tax record
- −$113 /mo · $1,360/yr
- Insurance
- −$75
- HOA
- −$0
- Vacancy / Maint / Mgmt
- −$409
- Net cashflow
- $405
Break-even live
UW: 25.0% down · 7.5% · 30yr · 1.5% tax · 5.0% vac · 8.0% maint · 8.0% mgmt
Financing live
Cash to close
- Down payment
- $44,975
- Closing costs
- $5,397
- Reserves months
- —
- Total cash needed
- —
Loan-product check · same deal, 3 products live
Conventional
25% down · 7.5% · 30yr
- Down + closing
- —
- Monthly P&I
- —
- Monthly cashflow
- —
- DSCR
- —
- Eligible?
- —
Personal DTI + credit; lowest rate.
DSCR
20% down · 8.5% · 30yr
- Down + closing
- —
- Monthly P&I
- —
- Monthly cashflow
- —
- DSCR
- —
- Eligible?
- —
No personal income docs; deal must DSCR.
Hard money
10% down · 12.0% · 12mo
- Down + closing
- —
- Monthly P&I
- —
- Monthly cashflow
- —
- DSCR
- —
- Eligible?
- —
Short-term bridge; refi at stabilization.
Rent comps 8 comps
| Address | Beds | Baths | Sqft | Rent | $/sqft | DOM | Units | Dist |
|---|---|---|---|---|---|---|---|---|
| 427 Bristol Cove Rd Mary Esther, FL | 3.0 | 2.0 | 1382 | $1,850 | $1.34 | 13d | 1 | 0.42mi |
| 427 Bristol Cove Rd Mary Esther, FL | 3.0 | 2.0 | 1382 | $2,000 | $1.45 | 43d | 1 | 0.42mi |
| 46 Kathleen Dr Mary Esther, FL | 3.0 | 2.0 | 1448 | $2,200 | $1.52 | 20d | 1 | 0.78mi |
| 20 Stowe Rd Mary Esther, FL | 3.0 | 2.0 | 1316 | $2,000 | $1.52 | 20d | 1 | 0.91mi |
| 806 Boulevard de Lorleans Mary Esther, FL | 3.0 | 2.0 | 1125 | $1,700 | $1.51 | 20d | 1 | 0.98mi |
| 806 Boulevard de Lorleans Mary Esther, FL | 3.0 | 2.0 | 1125 | $1,700 | $1.51 | 43d | 1 | 0.98mi |
| 324 Michael Cir Mary Esther, FL | 2.0 | 1.0 | 1000 | $1,350 | $1.35 | 43d | 1 | 1.20mi |
| 311 Evergreen Dr Mary Esther, FL | 3.0 | 2.0 | 1284 | $1,895 | $1.48 | 20d | 1 | 1.47mi |
Listing history 20 events
-
2026-06-18days on market $179,900 Active 128 DOM
-
2026-06-17days on market $179,900 Active 127 DOM
-
2026-06-16days on market $179,900 Active 126 DOM
-
2026-06-15days on market $179,900 Active 125 DOM
-
2026-06-14days on market $179,900 Active 123 DOM
-
2026-06-13days on market $179,900 Active 122 DOM
-
2026-06-10days on market $179,900 Active 120 DOM
-
2026-06-09days on market $179,900 Active 119 DOM
-
2026-06-08days on market $179,900 Active 118 DOM
-
2026-06-07days on market $179,900 Active 117 DOM
-
2026-06-05days on market $179,900 Active 114 DOM
-
2026-06-02days on market $179,900 Active 112 DOM
-
2026-06-01days on market $179,900 Active 111 DOM
-
2026-05-31days on market $179,900 Active 110 DOM
-
2026-05-30days on market $179,900 Active 109 DOM
-
2026-04-17price $179,900 675-char remark
Show marketing remark (675 chars)
Welcome to this beautifully updated 2006-built mobile home on a . 22-acre lot in Mary Esther! Just a few miles west of Hurlburt Field, this property is tucked away at the end of a quiet street, offering privacy and comfort. Inside, you'll find: * A brand-new kitchen with modern appliances * Fresh paint throughout * New flooring, fixtures, and doors * 2 spacious bedrooms, each with its own full bathroom * The home also features a tiled roof for durability * Backyard complete with a storage shed. Whether you're looking for a starter home, downsizing, or investing, this one check all the boxes. Don't miss your chance to make it yours—schedule a showing today
-
2026-02-09$199,900 Active 675-char remark
Show marketing remark (675 chars)
Welcome to this beautifully updated 2006-built mobile home on a . 22-acre lot in Mary Esther! Just a few miles west of Hurlburt Field, this property is tucked away at the end of a quiet street, offering privacy and comfort. Inside, you'll find: * A brand-new kitchen with modern appliances * Fresh paint throughout * New flooring, fixtures, and doors * 2 spacious bedrooms, each with its own full bathroom * The home also features a tiled roof for durability * Backyard complete with a storage shed. Whether you're looking for a starter home, downsizing, or investing, this one check all the boxes. Don't miss your chance to make it yours—schedule a showing today
-
2025-10-16price $199,900
-
2025-09-10$205,900 Active
-
1997-03-01$55,000
ⓘ Source: listings_history table (triggers on properties + properties_extension) + one-shot
backfill from property_details.listing_events for pre-trigger history.
Tax reassessment forecast FL · Resets to sale price
- Current annual tax
- $1,360 · $113/mo
- Projected year-2 tax
- $1,493 · $124/mo
- Expected delta
- +$134/yr (+$11/mo · 9.8%)
ⓘ Screening estimate from a state-policy table — verify with the county assessor before closing.
Climate risk First Street
- Flood 1/10 Low FEMA zone X (unshaded) · 0% chance over 30 yrs
- Wildfire 6/10 Major
- Heat 10/10 Extreme 7 d/yr ≥104°F today · 23 d/yr by 30 yrs out
- Wind 9/10 Extreme 99% chance of damaging wind over 30 yrs
- Air quality 2/10 Low 1 unhealthy d/yr today · 2 by 30 yrs out
Nearby sold comps map
Loading sold comps map…
Walkable amenities ~0.75 mi
Loading nearby amenities…
Taxation est. · year 1
- Rental income
- $23,348
- − Mortgage interest
- −$10,077
- − Property taxes
- −$1,360
- − Insurance
- −$900
- − Repairs & maintenance
- −$1,868
- − Management
- −$1,868
- − Depreciation
- −$5,233
- Taxable income
- $2,043
- Est. tax owed @ 24.0%
- −$490
- After-tax cash flow
- $4,375/yr
For passive investors: Depreciation is non-cash, so a rental often shows a tax loss while cash-flowing — sheltering income. Rental losses are passive: they offset passive income freely, and up to $25,000/yr can offset ordinary (W-2) income if you actively participate and your MAGI is under $100k (phasing out to $0 by $150k); unused losses carry forward. On sale, claimed depreciation is recaptured at up to 25%, and gains may owe capital-gains tax (a 1031 exchange can defer both). Figures are a year-1 estimate at your 24.0% rate — not tax advice; consult a CPA.
Schools (NCES district)
- District
- Okaloosa
- NCES district ID
- 1201380
- Math proficiency
- 60% ▼ -12.00%
- Reading proficiency
- 60% ▼ -4.00%
- Median HH income
- $55,601
- Composite
- 51.62/100
- National rank
- #1705
- State rank
- #12 of 73 in FL
Livability — Hurlburt Field
No livability data for this city. (Only ~50 U.S. cities are tracked.)
Census & demographics
- County
- Okaloosa County · 194,352 people
- City population
- 2,344
- Metro
- Crestview-Fort Walton Beach-Destin, FL
- Population (ZIP)
- 12,063
- Household income
- $77,718
- Rent vs Own
- Severe rent burden
- 416.0
Population outlook (Okaloosa County) Hauer SSP2
- Today (2025)
- 235,133 people
- By 2030
- 253,483 · +7.8%
- By 2040
- 289,537 · +23.1%
- By 2050
- 322,954 · +37.3%
- By 2075
- 399,624 · +70.0%
- By 2100
- 425,311 · +80.9%
Race, ethnicity, and origin ACS 2023
- Neighborhood character
- Diverse neighborhood (Simpson 0.58)
- Race & ethnicity
- White 63% Two or more races 12% Black 12% Hispanic / Latino 9% Asian 8%
- Hispanic origin (detail)
- Mexican 3% Puerto Rican 2%
- Common ancestry
- Slovak 5% Romanian 2% Lithuanian 2%
- Foreign-born
- 5% · Canada, South Korea, China
- Languages at home
- 89% English-only · Other Indo-European 4% Spanish 3% Tagalog/Filipino 1%
Political lean MEDSL · Okaloosa
- 2024 margin
- Solid R (+42.4) · D 28.2% · R 70.7% · Other 1.1%
- 2008→2024 swing
- +2.5pp toward D · 2008: -44.9pp · 2024: -42.4pp
- All cycles
- 2024: R+42.4 2020: R+39.1 2016: R+47.8 2012: R+49.4 2008: R+44.9
Not yet ingested
- Civics
- —
Market trends
- HPI YoY
- ▼ -97.13%
- Current HPI
- 269.266
- Rent YoY
- ▼ -0.45%
- Metro
- Crestview-Fort Walton Beach-Destin, FL
- State GDP YoY
- ▲ 3.28%
- F500 in state
- 36
Industry mix (Fortune 500 HQ in FL)
| Industry | F500 HQs | Revenue |
|---|---|---|
| Industrial Technology | 2 | $29B |
|
||
| Insurance | 2 | $17B |
|
||
| Retail | 1 | $60B |
|
||
| Technology Distribution | 1 | $58B |
|
||
| Homebuilding | 1 | $35B |
|
||
| Technology Manufacturing | 1 | $35B |
|
||
Price history
+227.1% since first listed5 events — show timeline
- 2026-04-17 Price Changed $179,900 ECAR
- 2026-02-09 Listed $199,900 ECAR
- 2025-10-16 Price Changed $199,900 ECAR
- 2025-09-10 Listed $205,900 ECAR
- 1997-03-01 Listed $55,000 ECAR
Property tax history
+12.2%/yrLatest (2025): $1,360 · +16.1% YoY. Source: county tax records.
Cash-flow waterfall
monthlySold comps — $/sqft
last 12 mo · ≤1 miLoading sold comps…