421 NE 14th Ave · Hallandale Beach, FL
Flood risk No data
- FEMA flood zone
- —
- Chance of flooding over 30 yrs
- —
- Est. flood insurance / yr
- —
Fire risk No data
- Est. fire insurance / yr
- —
Heat risk No data
- Hot days now (above threshold)
- —
- Hot days in 30 yrs
- —
Wind risk No data
- Chance of severe wind over 30 yrs
- —
Air-quality risk No data
- Unhealthy air days now
- —
- Unhealthy air days in 30 yrs
- —
Risk factors via First Street. Map © Google.
Why this score? — see what drove the B grade
The composite is a weighted blend of 9 inputs, each scored 0–100. Each bar is that input's sub-score; the figure is the points it added to the 100-point composite (weight × sub-score).
- Cash flow +28.9/30.0
- 1% rule +10.0/10.0
- DSCR +10.0/10.0
- ARV discount +7.5/15.0
- Schools +4.1/10.0
- Livability +4.0/5.0
- Condition / age +4.0/5.0
- Rent growth +2.6/5.0
- Appreciation +0.0/10.0
$250,000
🖨 Deal sheet (PDF) 📄 Offer letter ✓ Due diligence
Listing remarks
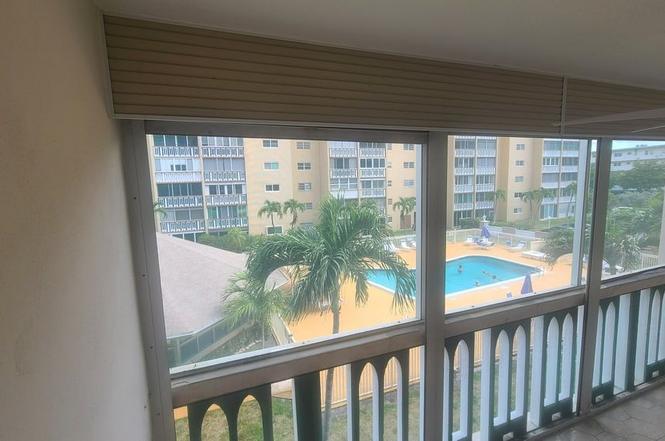
55+ commmunity Great pool view from apt. 2 bedroom 2 bath rnew vanities, toilets , & medicine cabinets in art deco baths. New flooring just painted lg rooms many closets New kitchen quartz countertops stainless steal appliances. Close to expressways, casinos, beach, shopping, , worship, airports. Exercise room suana and clubhouse. Easy to see call lisa 9548174919
Key facts
- Quartz countertops
- New kitchen
- Exercise room
Tags
Neighborhood map
What this means for you Summary
Snapshot
- This is a 2-bed/2.0-bath condo listed at $250k. Condition is rated good.
Deal economics
- At list price, monthly cash flow is $847 ($10k/yr) — positive.
- The deal already cash-flows at list — no discount required.
- Meets the 1% rule at list price ($4k rent vs $250k).
- Cap rate 10.4% vs local median 5.2% in Hallandale Beach — top-decile yield for the area; either an underpriced asset or a hidden risk that comps aren't pricing in. Stress-test before assuming the spread holds.
Location & tenants
- Location reads 81/100 on livability (#86 in FL, #1,400 nationally) — a professional / high-income tenant draw. Strengths: commute A+, health & safety A+, crime B+; Watch: employment D-.
- Broward (suburban): math 42% / reading 53% proficiency, ranked #46 of 73 in FL (top 63%) — families likely to look elsewhere, expect single-tenant / working-renter base with shorter leases.
- Zoned schools: Gulfstream Academy of Hallandale Beach (math 32% / reading 40%, grade F, #1,670 of 2,144 statewide, top 78%, 1,317 students, 73% FRL); Nova Middle School (math 44% / reading 53%, grade C-, #274 of 571 statewide, top 50%, 1,284 students, 68% FRL); Nova High School (math 22% / reading 56%, grade F, #312 of 667 statewide, top 48%, 2,227 students, 59% FRL) — zoned schools average 67% FRL vs 51% district-wide (16 pts higher); higher-poverty schools than district average — tighter screening recommended.
- Market conditions: Rents flat; 1380 active listings in the ZIP; 40 comparable units currently listed for rent nearby; rentals at typical pace (median 23d on market — plan ~3-4 weeks tenant-placement turnaround); 2,111 units permitted in Broward County in 2024 (1,265 in 5+ unit buildings).
- At $4,010/mo this rent would consume 92% of the median local household income ($52k/yr) (locally 3293% of renters already pay >50% of income on rent) — very limited rent-growth headroom before tenants either downsize or default.
Forward outlook
- Local home prices are declining (-3.0%/yr); year-one equity from $2k of loan paydown is wiped out by about $8k of value loss. Plan a longer hold.
- Broward County population projected at +34% by 2050 — long-run rental-demand tailwind backs the buy-and-hold thesis.
Negotiation context
- Only 11 days on market — expect competitive offers; lowballing is unlikely to land.
Questions for the listing agent
- Built in 1972 — when were the roof, HVAC, electrical panel, plumbing, and water heater last replaced?
- What does the HOA fee cover, when was the last increase, and are there any pending special assessments or reserve-fund shortfalls?
- Any open or pending special assessments — roof, HVAC, plumbing, elevator, façade? What's the per-unit balance and payoff schedule, and is the seller paying it off at close or rolling it to the buyer?
- Is there a deadline driving the sale (1031 exchange, divorce, estate, relocation)? That informs how much negotiation room exists.
- What's the average days-on-market for RENTAL listings here right now (not sales)? A rising rental-DOM trend means longer vacancies and softer asking-rent achievability than the comps imply.
- What's the recent tenant-quality profile in this submarket — average credit score on applications, eviction rate, late-payment / NSF rate, and stable-employment percentage? A property-management company in the area should have these aggregated.
- How much new apartment / multifamily construction is in the pipeline within 1–3 miles? Heavy new supply (>2% of stock underway) typically softens rents 12–24 months out; light construction supports rent growth.
Investment metrics
- 1% rule
- 1.60% ✓
- Cap rate
- 10.36%
- Cash-on-cash
- 14.52%
- DSCR
- 1.65
- GRM
- 5.2
CMA / ARV
No comps found within radius.
Projected returns pro-forma
-3.0% appreciation · 0.43% rent growth · sell at horizon
- IRR
- 1.5%
- Equity multiple
- 1.05×
- Total profit
- $3,761
- Equity at exit
- $37,276
- IRR
- 7.7%
- Equity multiple
- 1.50×
- Total profit
- $35,075
- Equity at exit
- $21,615
Cash invested: $70,000 (down + closing). Projections, not guarantees.
Landlord ↔ Tenant lean methodology
- Overall (STATE)
- 87 Strongly Landlord-Friendly
- State Florida
- 87 Strongly Landlord-Friendly · R+3
- County
- — inherits STATE
- City
- — inherits STATE
ZIP-level market 33009
- Rents YoY
- 0.4%
- Active inventory
- 1380
- Price-to-rent
- 5.2×
Monthly cashflow live
- Estimated rent
- $4,010 high interval (Pro) →
- Mortgage (P&I)
- −$1,311
- Tax est. 1.5%
- −$312 /mo · $3,750/yr
- Insurance
- −$104
- HOA est. from 3 same-building comps
- −$593
- Vacancy / Maint / Mgmt
- −$842
- Net cashflow
- $847
Break-even live
Sensitivity live
| Price | -10% $1,020 | -5% $934 | +0% $847 | +5% $761 | +10% $674 |
|---|---|---|---|---|---|
| Rent | -10% $530 | -5% $689 | +0% $847 | +5% $1,006 | +10% $1,164 |
| Rate | -1.0pp $973 | -0.5pp $911 | base $847 | +0.5pp $782 | +1.0pp $716 |
UW: 25.0% down · 7.5% · 30yr · 1.5% tax · 5.0% vac · 8.0% maint · 8.0% mgmt
Financing live
Cash to close
- Down payment
- $62,500
- Closing costs
- $7,500
- Reserves months
- —
- Total cash needed
- —
Loan-product check · same deal, 3 products live
Conventional
25% down · 7.5% · 30yr
- Down + closing
- —
- Monthly P&I
- —
- Monthly cashflow
- —
- DSCR
- —
- Eligible?
- —
Personal DTI + credit; lowest rate.
DSCR
20% down · 8.5% · 30yr
- Down + closing
- —
- Monthly P&I
- —
- Monthly cashflow
- —
- DSCR
- —
- Eligible?
- —
No personal income docs; deal must DSCR.
Hard money
10% down · 12.0% · 12mo
- Down + closing
- —
- Monthly P&I
- —
- Monthly cashflow
- —
- DSCR
- —
- Eligible?
- —
Short-term bridge; refi at stabilization.
Rent comps 40 comps
| Address | Beds | Baths | Sqft | Rent | $/sqft | DOM | Units | Dist |
|---|---|---|---|---|---|---|---|---|
| 1124 NE 7th St Hallandale Beach, FL | 3.0 | 2.0 | 1320 | $3,900 | $2.95 | 24d | 1 | 0.17mi |
| 906 NE 6th St Hallandale Beach, FL | 3.0 | 2.0 | 1080 | $4,250 | $3.94 | 14d | 1 | 0.28mi |
| 906 NE 6th St Hallandale Beach, FL | 3.0 | 2.0 | 1080 | $4,250 | $3.94 | 7d | 1 | 0.28mi |
| 906 NE 6th St Hallandale Beach, FL | 3.0 | 2.0 | 1080 | $4,250 | $3.94 | 26d | 1 | 0.28mi |
| 1755 E Hallandale Beach Blvd Unit 1407E Hallandale Beach, FL | 2.0 | 2.0 | 1354 | $3,650 | $2.70 | 26d | 1 | 0.36mi |
| 1755 E Hallandale Beach Blvd Unit 2207E Hallandale Beach, FL | 2.0 | 2.0 | 1354 | $3,950 | $2.92 | 26d | 1 | 0.36mi |
| 1745 E Hallandale Beach Blvd Unit 2302W Hallandale Beach, FL | 3.0 | 2.0 | 1481 | $3,900 | $2.63 | 26d | 1 | 0.37mi |
| 1745 E Hallandale Beach Blvd Unit 2302W Hallandale Beach, FL | 3.0 | 2.0 | 1481 | $3,900 | $2.63 | 17d | 1 | 0.37mi |
| 1745 E Hallandale Beach Blvd Unit 802W Hallandale Beach, FL | 3.0 | 2.0 | 1481 | $3,600 | $2.43 | 26d | 1 | 0.37mi |
| 1001 NE 10th St Unit 2 Hallandale Beach, FL | 3.0 | 2.0 | 1270 | $3,600 | $2.83 | 26d | 1 | 0.42mi |
| 1180 E Hallandale Beach Blvd Unit 1241877P Hallandale Beach, FL | 1.0–2.0 | 1.0–2.0 | 844 | $5,453 | $6.46 | 5d | 2 | 0.47mi |
| 101 Diplomat Pkwy Hallandale Beach, FL | 1.0 | 1.0 | 859 | $3,740 | $4.35 | 26d | 1 | 0.49mi |
| 110 N Federal Hwy #1401 Hallandale Beach, FL | 2.0 | 2.0 | 1220 | $3,999 | $3.28 | 9d | 1 | 0.52mi |
| 401 N Federal Hwy Hallandale Beach, FL | 1.0–3.0 | 1.0–2.0 | 973 | $2,765 | $2.84 | 17d | 48 | 0.53mi |
| 1528 Wiley St Hollywood, FL | 2.0 | 1.0 | 1488 | $4,100 | $2.76 | 26d | 1 | 0.61mi |
| 2500 Parkview Dr #2518 Hallandale Beach, FL | 2.0 | 2.0 | 1280 | $4,000 | $3.12 | 16d | 1 | 0.65mi |
| 2500 Parkview Dr #2518 Hallandale Beach, FL | 2.0 | 2.0 | 1280 | $4,000 | $3.12 | 9d | 1 | 0.65mi |
| 2602 E Hallandale Beach Blvd Unit 1227270P Hallandale Beach, FL | 2.0 | 1.0–2.0 | 640 | $4,219 | $6.59 | 0d | 3 | 0.82mi |
| 2601 E Hallandale Beach Blvd Unit 1227344P Hallandale Beach, FL | 1.0–2.0 | 1.0–2.0 | 844 | $4,219 | $5.00 | 3d | 2 | 0.82mi |
| 200 E Pembroke Rd Hallandale Beach, FL | 3.0 | 1.0–2.0 | 1006 | $3,472 | $3.45 | 1d | 63 | 0.83mi |
| 2602 E Hallandale Beach Blvd Hallandale Beach, FL | 1.0–2.0 | 1.0–2.0 | 1092 | $5,950 | $5.45 | 26d | 3 | 0.83mi |
| 2602 E Hallandale Beach Blvd Hallandale Beach, FL | 1.0–2.0 | 1.0–2.0 | 1070 | $5,950 | $5.56 | 22d | 4 | 0.83mi |
| 2600 E Hallandale Beach Blvd Unit T3208 Hallandale Beach, FL | 2.0 | 2.0 | 1030 | $6,950 | $6.75 | 26d | 1 | 0.84mi |
| 2600 E Hallandale Beach Blvd Unit T3110 Hallandale Beach, FL | 2.0 | 2.0 | 1028 | $3,650 | $3.55 | 26d | 1 | 0.84mi |
| 2600 E Hallandale Beach Blvd Unit T3307 Hallandale Beach, FL | 2.0 | 2.0 | 1030 | $4,500 | $4.37 | 26d | 1 | 0.84mi |
| 201 Golden Isles Dr #302 Hallandale Beach, FL | 2.0 | 2.0 | 1150 | $3,975 | $3.46 | 26d | 1 | 0.92mi |
| 4010 S Ocean Dr Hollywood, FL | 1.0–3.0 | 1.0–3.5 | 1078 | $7,250 | $6.73 | 26d | 5 | 0.92mi |
| 121 Golden Isles Dr #1 Hallandale Beach, FL | 2.0 | 2.0 | 1379 | $4,000 | $2.90 | 26d | 1 | 0.94mi |
| 2721 E Hallandale Beach Blvd Unit 1049818P Hollywood, FL | 1.0–2.0 | 1.0–2.0 | 946 | $5,897 | $6.23 | 5d | 2 | 0.94mi |
| 3800 S Ocean Dr #1818 Hollywood, FL | 2.0 | 2.0 | 1270 | $3,800 | $2.99 | 7d | 1 | 0.94mi |
| 3800 S Ocean Dr #1818 Hollywood, FL | 2.0 | 2.0 | 1270 | $4,200 | $3.31 | 9d | 1 | 0.94mi |
| 2723 E Hallandale Beach Blvd Unit 1049813P Hollywood, FL | 3.0 | 2.0 | 1496 | $6,498 | $4.34 | 5d | 1 | 0.95mi |
| 3800 S Ocean Dr Hollywood, FL | 2.0 | 2.0 | 1301 | $3,775 | $2.90 | 7d | 2 | 0.95mi |
| 3800 S Ocean Dr Hollywood, FL | 2.0 | 2.0 | 1302 | $3,750 | $2.88 | 6d | 3 | 0.95mi |
| 4010 S Ocean Dr Unit 1227249P Hollywood, FL | 1.0–3.0 | 1.5–2.5 | 1140 | $5,730 | $5.02 | 1d | 3 | 0.95mi |
| 4010 S Ocean Dr Unit T3708 Hollywood, FL | 3.0 | 2.5 | 1361 | $8,000 | $5.88 | 26d | 1 | 0.95mi |
| 4010 S Ocean Dr Unit R1108 Hollywood, FL | 3.0 | 2.5 | 1361 | $12,999 | $9.55 | 26d | 1 | 0.95mi |
| 4010 S Ocean Dr Unit T3609 Hollywood, FL | 2.0 | 2.0 | 1060 | $6,300 | $5.94 | 26d | 1 | 0.95mi |
| 4010 S Ocean Dr Unit T3609 Hollywood, FL | 2.0 | 2.0 | 1060 | $6,300 | $5.94 | 5d | 1 | 0.95mi |
| 4010 S Ocean Dr Unit R504 Hollywood, FL | 3.0 | 2.0 | 1122 | $10,000 | $8.91 | 9d | 1 | 0.95mi |
HOA detail condo
- Monthly dues
- $0 · $0/yr
- Likely covers
- pool
- Assessments
- None detected in remarks — confirm with the listing agent.
Listing history 7 events
-
2026-06-21days on market $250,000 Active 11 DOM
-
2026-06-18days on market $250,000 Active 8 DOM
-
2026-06-17days on market $250,000 Active 7 DOM
-
2026-06-16days on market $250,000 Active 6 DOM
-
2026-06-15days on market $250,000 Active 5 DOM
-
2026-06-13remarks 366-char remark
-
2026-06-13$250,000 Active 3 DOM
ⓘ Source: listings_history table (triggers on properties + properties_extension) + one-shot
backfill from property_details.listing_events for pre-trigger history.
Nearby sold comps map
Loading sold comps map…
Walkable amenities ~0.75 mi
Loading nearby amenities…
Taxation est. · year 1
- Rental income
- $48,119
- − Mortgage interest
- −$14,004
- − Property taxes
- −$3,750
- − Insurance
- −$1,250
- − Repairs & maintenance
- −$3,850
- − Management
- −$3,850
- − HOA
- −$7,116
- − Depreciation
- −$7,273
- Taxable income
- $7,028
- Est. tax owed @ 24.0%
- −$1,687
- After-tax cash flow
- $8,479/yr
For passive investors: Depreciation is non-cash, so a rental often shows a tax loss while cash-flowing — sheltering income. Rental losses are passive: they offset passive income freely, and up to $25,000/yr can offset ordinary (W-2) income if you actively participate and your MAGI is under $100k (phasing out to $0 by $150k); unused losses carry forward. On sale, claimed depreciation is recaptured at up to 25%, and gains may owe capital-gains tax (a 1031 exchange can defer both). Figures are a year-1 estimate at your 24.0% rate — not tax advice; consult a CPA.
Condition & rehab AI · 13 photos
This property is in good condition with recent updates, including new flooring, kitchen, and bathrooms. It is move-in ready with a good curb appeal and is located in a desirable area with easy access to amenities.
Value-add opportunities
- Both Landscaping — Enhances curb appeal and adds value for both resale and rental.
- Both Blinds — Improves privacy and aesthetic appeal, enhancing both resale and rental value.
Renovation cost estimate screening
Value-add ROI direction
- Both Landscaping — Enhances curb appeal and adds value for both resale and rental. ↑
- Both Blinds — Improves privacy and aesthetic appeal, enhancing both resale and rental value. ↑
ⓘ Cost ranges are severity-bucket heuristics (US national rule-of-thumb). Get contractor quotes + a written scope before underwriting a rehab budget.
Schools (NCES district)
- District
- Broward
- NCES district ID
- 1200180
- Math proficiency
- 42% ▼ -18.00%
- Reading proficiency
- 53% ▼ -5.00%
- Median HH income
- $52,139
- Composite
- 40.88/100
- National rank
- #3621
- State rank
- #46 of 73 in FL
Livability — Hallandale Beach
- Score
- 81/100
- State rank
- #86
- US rank
- #1400
Category grades
Schools grade is shown separately in the Schools card above.
Census & demographics
- Census place
- Hallandale Beach, FL
- County
- Broward County · 1,963,430 people
- City population
- 44,021
- Metro
- Miami-Fort Lauderdale-Pompano Beach, FL
- Population (ZIP)
- 44,502
- Household income
- $52,079
- Rent vs Own
- Severe rent burden
- 3293.0
Population outlook (Broward County) Hauer SSP2
- Today (2025)
- 2,207,033 people
- By 2030
- 2,360,704 · +7.0%
- By 2040
- 2,661,208 · +20.6%
- By 2050
- 2,946,698 · +33.5%
- By 2075
- 3,602,273 · +63.2%
- By 2100
- 3,970,984 · +79.9%
Race, ethnicity, and origin ACS 2023
- Neighborhood character
- Diverse neighborhood (Simpson 0.67)
- Race & ethnicity
- Hispanic / Latino 39% White 39% Two or more races 24% Black 17% Asian 1%
- Hispanic origin (detail)
- Mexican 2% Puerto Rican 3% Cuban 9% Dominican 3% Salvadoran 2%
- Common ancestry
- Scotch-Irish 5% Hispanic 5% Subsaharan African 3%
- Foreign-born
- 51% · Canada, Jamaica, Dominican Republic
- Languages at home
- 38% English-only · Spanish 36% Russian/Polish/Slavic 12% French/Haitian/Cajun 7%
Political lean MEDSL · Broward
- 2024 margin
- D (+17.0) · D 58.0% · R 41.0%
- 2008→2024 swing
- -17.8pp toward R · 2008: 34.7pp · 2024: 17.0pp
- All cycles
- 2024: D+17.0 2020: D+29.8 2016: D+35.0 2012: D+34.9 2008: D+34.7
Not yet ingested
- Civics
- —
Market trends
- HPI YoY
- ▼ -299.13%
- Current HPI
- 329.9081
- Rent YoY
- ▲ 0.43%
- Metro
- Miami-Fort Lauderdale-Pompano Beach, FL
- State GDP YoY
- ▲ 3.28%
- F500 in state
- 36
Industry mix (Fortune 500 HQ in FL)
| Industry | F500 HQs | Revenue |
|---|---|---|
| Industrial Technology | 2 | $29B |
|
||
| Insurance | 2 | $17B |
|
||
| Retail | 1 | $60B |
|
||
| Technology Distribution | 1 | $58B |
|
||
| Homebuilding | 1 | $35B |
|
||
| Technology Manufacturing | 1 | $35B |
|
||
Price history
1 event — show timeline
- 2026-06-10 Listed $250,000 ForSaleByOwner.com
Cash-flow waterfall
monthlySold comps — $/sqft
last 12 mo · ≤1 miLoading sold comps…