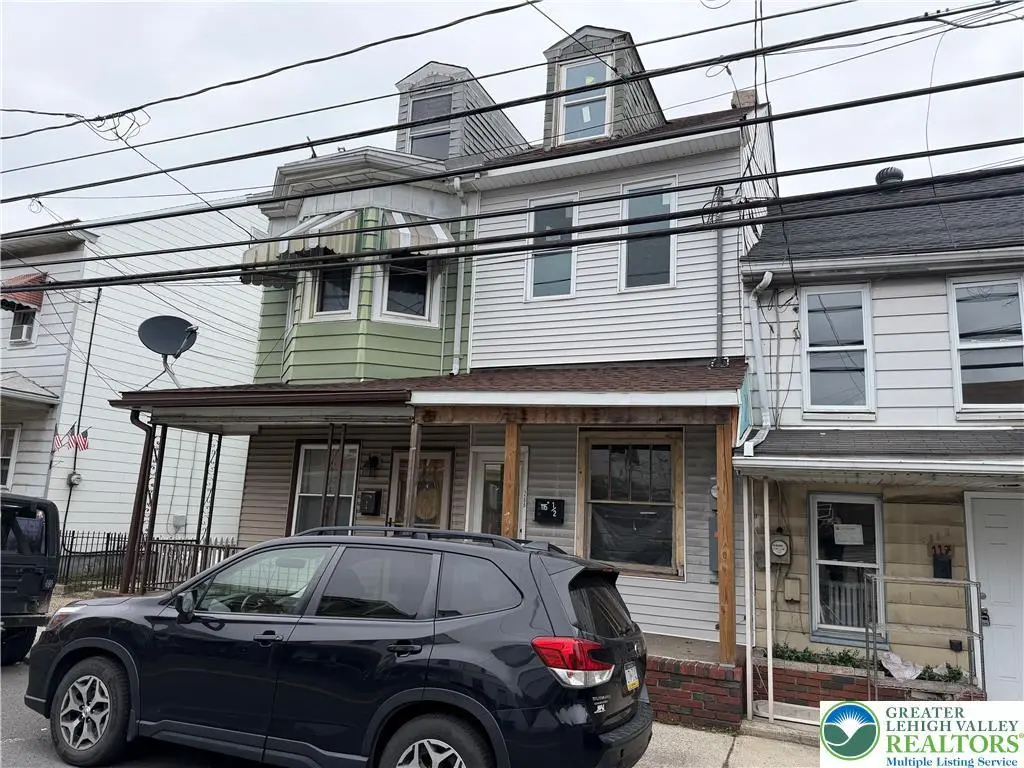
115 S 3rd St · Minersville, PA
Flood risk 1/10 · Minimal
- FEMA flood zone
- X (unshaded)
- Chance of flooding over 30 yrs
- 0.0%
- Est. flood insurance / yr
- $473 – $860
Fire risk 1/10 · Minimal
- Est. fire insurance / yr
- $511 – $949
Heat risk 5/10 · Moderate
- Hot days now (above 95°F)
- 7 days/yr
- Hot days in 30 yrs
- 16 days/yr
Wind risk 4/10 · Minor
- Chance of severe wind over 30 yrs
- 8.0%
Air-quality risk 2/10 · Minimal
- Unhealthy air days now
- 1 days/yr
- Unhealthy air days in 30 yrs
- 3 days/yr
Risk factors via First Street. Map © Google.
Why this score? — see what drove the B+ grade
The composite is a weighted blend of 9 inputs, each scored 0–100. Each bar is that input's sub-score; the figure is the points it added to the 100-point composite (weight × sub-score).
- Cash flow +30.0/30.0
- 1% rule +10.0/10.0
- DSCR +10.0/10.0
- ARV discount +7.5/15.0
- Appreciation +7.3/10.0
- Livability +3.5/5.0
- Schools +3.0/10.0
- Rent growth +2.5/5.0
- Condition / age +2.5/5.0
$39,900
🖨 Deal sheet (PDF) 📄 Offer letter ✓ Due diligence
Listing remarks
Investor opportunity in Minersville! This property is completely gutted and ready for a full renovation, offering a blank slate to bring your vision to life. Updates include a new 200-amp electrical service and a few new windows already installed, saving time and upfront costs. Ideal for investors or buyers looking for a full rehab project with strong potential. Property is being sold as-is.
Key facts
- Few new windows
- Built 1930
- Listed 34 days
Tags
Property features AI
Finance
- Other: Property contains 1 unit (Unit 1: 2 beds, 1 bath)
- Financial info: Insurance expense listed: $600
Exterior
- Parking: On-street parking
- Utilities: Public water; Public sewer
- Home design: Two-story building; Zoned R
- Construction: Vinyl siding
- Exterior features: On-street parking
Interior
- Bedrooms: 2 bedrooms (Unit 1)
- Bathrooms: 1 full bathroom
- Interior features: Two-story interior
Neighborhood map
What this means for you Summary
Snapshot
- This is a 3-bed/2.0-bath single-family listed at $40k.
Deal economics
- At list price, monthly cash flow is $633 ($8k/yr) — positive.
- The deal already cash-flows at list — no discount required.
- Meets the 1% rule at list price ($1k rent vs $40k).
- Recommended offer: $39k (3.0% below list) — sets the bar for market timing.
- Cap rate 25.3% vs local median 8.8% in Minersville — top-decile yield for the area; either an underpriced asset or a hidden risk that comps aren't pricing in. Stress-test before assuming the spread holds.
Location & tenants
- Location reads 70/100 on livability (#742 in PA) — a middle-class / working-renter tenant base. Strengths: cost of living A+, health & safety A+, crime A; Watch: commute F, employment F.
- Minersville Area SD (town): math 21% / reading 50% proficiency, ranked #420 of 539 in PA (top 78%) — families likely to look elsewhere, expect single-tenant / working-renter base with shorter leases.
- Zoned schools: Minersville Area El Ctr (math 24% / reading 56%, grade F, #942 of 1,518 statewide, top 62%, 466 students, 98% FRL); Minersville Area Jshs (math 17% / reading 42%, grade F, #349 of 437 statewide, top 81%, 527 students, 96% FRL) — zoned schools average 97% FRL vs 39% district-wide (57 pts higher); higher-poverty schools than district average — tighter screening recommended.
- Market conditions: 38 active listings in the ZIP; 1 comparable units currently listed for rent nearby; 169 units permitted in Schuylkill County in 2024 (0 in 5+ unit buildings).
Forward outlook
- In year one you build about $2k of equity ($276 loan paydown + $2k appreciation (4.7% local appreciation)).
- Schuylkill County population projected at -16% by 2050 — secular population decline; favor cash flow + early exit over multi-decade hold.
- At projected returns (4.7% appreciation + 3.0% rent growth), your $11k cash investment doubles in ~2 years — after that, you're playing with house money.
Negotiation context
- It's been on market 34 days — a 3% lower offer ($39k) is reasonable based on typical stale-listing flexibility.
- Current owner paid $32k; 23% above their basis — modest negotiation headroom, anchor on the comps not their cost.
Risks & watch-outs
- Watch-outs: built in 1930 — expect roof / HVAC / electrical / plumbing capex.
- Climate carrying-cost: extreme-heat days projected 7→16/yr by 2055 (HVAC capex compounding) — expect insurance premiums to compound above CPI over the hold.
Questions for the listing agent
- It's been on market 34 days. Have you received any prior offers? Is the seller open to a 3% concession, seller financing, or rate buy-down credit?
- Built in 1930 — when were the roof, HVAC, electrical panel, plumbing, and water heater last replaced?
- Is there a deadline driving the sale (1031 exchange, divorce, estate, relocation)? That informs how much negotiation room exists.
- What's the average days-on-market for RENTAL listings here right now (not sales)? A rising rental-DOM trend means longer vacancies and softer asking-rent achievability than the comps imply.
- What's the recent tenant-quality profile in this submarket — average credit score on applications, eviction rate, late-payment / NSF rate, and stable-employment percentage? A property-management company in the area should have these aggregated.
- How much new for-sale + rental construction is in the pipeline within 1–3 miles? Heavy new supply typically softens prices + rents 12–24 months out; constrained supply supports both.
Investment metrics
- 1% rule
- 2.88% ✓
- Cap rate
- 25.32%
- Cash-on-cash
- 67.97%
- DSCR
- 4.02
- GRM
- 2.9
CMA / ARV
- ARV (median comp)
- $93,890
- List price
- $39,900
- Delta
- -57.50%
- Verdict
- UNDERPRICED
- Comps
- 20 within 1.0 mi
Show comp detail 8 sales within ~0.75 mi
| Address | Dist | Beds/Ba | Sqft | Sold | Price | $/sf | Match |
|---|---|---|---|---|---|---|---|
| 124 S 3rd St | 0.03mi | 2/1.0 (-1) | 1,101 (+3%) | 6mo | $86,000 | $78 | 80 |
| 401 Spring St | 0.29mi | 3/1.5 | 1,136 (+6%) | 11mo | $180,000 | $158 | 65 |
| 227 Middle St | 0.12mi | 3/1.0 | 1,200 (+12%) | 13mo | $19,000 | $16 | 60 |
| 226 Spruce St | 0.10mi | 3/1.0 | 926 (-14%) | 19mo | $45,000 | $49 | 53 |
| 516 Baker St | 0.37mi | 2/1.0 (-1) | 984 (-8%) | 10mo | $105,000 | $107 | 52 |
| 325 Washington St | 0.39mi | 3/1.0 | 1,204 (+12%) | 7mo | $175,650 | $146 | 51 |
| 500 Spring St | 0.31mi | 2/1.5 (-1) | 960 (-10%) | 20mo | $157,000 | $164 | 45 |
| 227 Llewellyn Rd | 0.50mi | 3/1.0 | 1,171 (+9%) | 20mo | $50,000 | $43 | 40 |
Match score weights: distance 35% · size 25% · config 20% · recency 20%. Top-matched comps best support the ARV.
Projected returns pro-forma
4.65% appreciation · 3.0% rent growth · sell at horizon
- IRR
- 74.2%
- Equity multiple
- 5.36×
- Total profit
- $48,725
- Equity at exit
- $21,771
- IRR
- 72.4%
- Equity multiple
- 11.10×
- Total profit
- $112,883
- Equity at exit
- $36,897
Cash invested: $11,172 (down + closing). Projections, not guarantees.
Landlord ↔ Tenant lean methodology
- Overall (STATE)
- 62 Landlord-Friendly
- State Pennsylvania
- 62 Landlord-Friendly · EVEN
- County
- — inherits STATE
- City
- — inherits STATE
ZIP-level market 17954
- Home prices YoY
- 2.3%
- Active inventory
- 38
- Price-to-rent
- 2.9×
Monthly cashflow live
- Estimated rent
- $1,150 medium interval (Pro) →
- Mortgage (P&I)
- −$209
- Tax est. 1.5%
- −$50 /mo · $598/yr
- Insurance
- −$17
- HOA
- −$0
- Lot rent
- −$0
- Vacancy / Maint / Mgmt
- −$242
- Net cashflow
- $633
Break-even live
Sensitivity live
| Price | -10% $660 | -5% $647 | +0% $633 | +5% $619 | +10% $605 |
|---|---|---|---|---|---|
| Rent | -10% $542 | -5% $587 | +0% $633 | +5% $678 | +10% $724 |
| Rate | -1.0pp $653 | -0.5pp $643 | base $633 | +0.5pp $622 | +1.0pp $612 |
UW: 25.0% down · 7.5% · 30yr · 1.5% tax · 5.0% vac · 8.0% maint · 8.0% mgmt
Financing live
Cash to close
- Down payment
- $9,975
- Closing costs
- $1,197
- Reserves months
- —
- Total cash needed
- —
Loan-product check · same deal, 3 products live
Conventional
25% down · 7.5% · 30yr
- Down + closing
- —
- Monthly P&I
- —
- Monthly cashflow
- —
- DSCR
- —
- Eligible?
- —
Personal DTI + credit; lowest rate.
DSCR
20% down · 8.5% · 30yr
- Down + closing
- —
- Monthly P&I
- —
- Monthly cashflow
- —
- DSCR
- —
- Eligible?
- —
No personal income docs; deal must DSCR.
Hard money
10% down · 12.0% · 12mo
- Down + closing
- —
- Monthly P&I
- —
- Monthly cashflow
- —
- DSCR
- —
- Eligible?
- —
Short-term bridge; refi at stabilization.
Rent comps 1 comps
| Address | Beds | Baths | Sqft | Rent | $/sqft | DOM | Units | Dist |
|---|---|---|---|---|---|---|---|---|
| 504 Laurel St Minersville, PA | 3.0 | 2.0 | 1059 | $1,150 | $1.09 | 46d | 1 | 0.25mi |
Listing history 6 events
-
2026-06-02days on market $39,900 Active 34 DOM
-
2026-06-01days on market $39,900 Active 33 DOM
-
2026-05-31days on market $39,900 Active 32 DOM
-
2026-05-31days on market $39,900 Active 31 DOM
-
2026-04-29$39,900 Active 394-char remark
-
2002-01-25soldstatus $15,000
ⓘ Source: listings_history table (triggers on properties + properties_extension) + one-shot
backfill from property_details.listing_events for pre-trigger history.
Climate risk First Street
- Flood 1/10 Low FEMA zone X (unshaded) · 0% chance over 30 yrs
- Wildfire 1/10 Low
- Heat 5/10 Major 7 d/yr ≥95°F today · 16 d/yr by 30 yrs out
- Wind 4/10 Moderate 8% chance of damaging wind over 30 yrs
- Air quality 2/10 Low 1 unhealthy d/yr today · 3 by 30 yrs out
Nearby sold comps map
Loading sold comps map…
Walkable amenities ~0.75 mi
Loading nearby amenities…
Taxation est. · year 1
- Rental income
- $13,800
- − Mortgage interest
- −$2,235
- − Property taxes
- −$598
- − Insurance
- −$200
- − Repairs & maintenance
- −$1,104
- − Management
- −$1,104
- − Depreciation
- −$1,161
- Taxable income
- $7,398
- Est. tax owed @ 24.0%
- −$1,776
- After-tax cash flow
- $5,818/yr
For passive investors: Depreciation is non-cash, so a rental often shows a tax loss while cash-flowing — sheltering income. Rental losses are passive: they offset passive income freely, and up to $25,000/yr can offset ordinary (W-2) income if you actively participate and your MAGI is under $100k (phasing out to $0 by $150k); unused losses carry forward. On sale, claimed depreciation is recaptured at up to 25%, and gains may owe capital-gains tax (a 1031 exchange can defer both). Figures are a year-1 estimate at your 24.0% rate — not tax advice; consult a CPA.
Schools (NCES district)
- District
- Minersville Area SD
- NCES district ID
- 4215510
- Math proficiency
- 21% ▼ -12.00%
- Reading proficiency
- 50% ▼ -8.00%
- Median HH income
- $40,865
- Composite
- 29.77/100
- National rank
- #6433
- State rank
- #420 of 539 in PA
Livability — Minersville
- Score
- 70/100
- State rank
- #742
- US rank
- #7439
Category grades
Schools grade is shown separately in the Schools card above.
Census & demographics
- Census place
- Minersville, PA
- City population
- 27,121
- Population (ZIP)
- 4,564
Population outlook (Schuylkill County) Hauer SSP2
- Today (2025)
- 137,447 people
- By 2030
- 133,121 · -3.1%
- By 2040
- 124,172 · -9.7%
- By 2050
- 115,611 · -15.9%
- By 2075
- 100,796 · -26.7%
- By 2100
- 86,667 · -36.9%
Race, ethnicity, and origin ACS 2023
- Neighborhood character
- Predominantly White (81%)
- Race & ethnicity
- White 81% Two or more races 15% Hispanic / Latino 12%
- Hispanic origin (detail)
- Puerto Rican 11%
- Common ancestry
- Polish 5% Romanian 5% Subsaharan African 4%
- Foreign-born
- 3% · Canada, China
- Languages at home
- 97% English-only · Spanish 2%
Political lean MEDSL · Schuylkill
- 2024 margin
- Solid R (+42.1) · D 28.5% · R 70.6%
- 2008→2024 swing
- -33.4pp toward R · 2008: -8.7pp · 2024: -42.1pp
- All cycles
- 2024: R+42.1 2020: R+39.9 2016: R+43.4 2012: R+13.4 2008: R+8.7
Not yet ingested
- Civics
- —
Market trends
- HPI YoY
- ▲ 4.65%
- Current HPI
- 209.7647
- Rent YoY
- —
- Metro
- —
- State GDP YoY
- ▲ 1.68%
- F500 in state
- 34
Industry mix (Fortune 500 HQ in PA)
| Industry | F500 HQs | Revenue |
|---|---|---|
| Healthcare | 2 | $309B |
|
||
| Insurance | 2 | $27B |
|
||
| Telecommunications / Media | 1 | $124B |
|
||
| Industrial Distribution | 1 | $22B |
|
||
| Financial Services | 1 | $20B |
|
||
| Chemicals / Materials | 1 | $18B |
|
||
Price history
+116.7% since first listed3 events — show timeline
- 2026-06-01 Sold (MLS) $32,500 GLVRMLS
- 2026-04-29 Listed $39,900 GLVRMLS
- 2002-01-25 Sold (Public Records) $15,000 Public Records
Property tax history
+13.0%/yrLatest (2026): $3,158 · +193.6% YoY. Source: county tax records.
Cash-flow waterfall
monthlySold comps — $/sqft
last 12 mo · ≤1 miLoading sold comps…