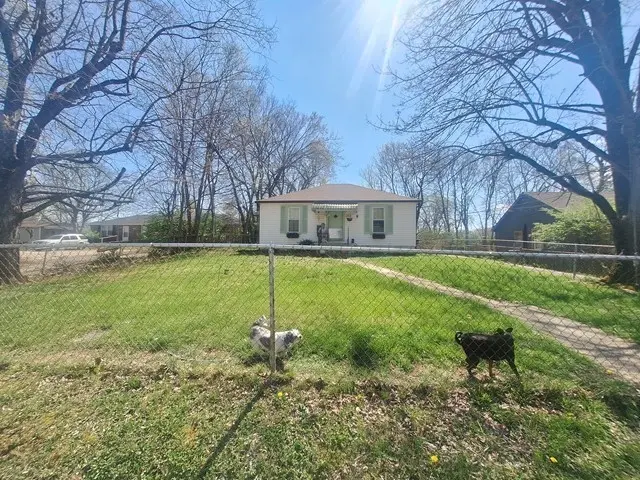
1252 Daniel St · Clarksville, TN
Flood risk 1/10 · Minimal
- FEMA flood zone
- X (unshaded)
- Chance of flooding over 30 yrs
- 0.0%
- Est. flood insurance / yr
- $507 – $1,088
Fire risk 1/10 · Minimal
- Est. fire insurance / yr
- $949 – $1,763
Heat risk 5/10 · Moderate
- Hot days now (above 108°F)
- 7 days/yr
- Hot days in 30 yrs
- 20 days/yr
Wind risk 4/10 · Minor
- Chance of severe wind over 30 yrs
- 9.0%
Air-quality risk 1/10 · Minimal
- Unhealthy air days now
- 0 days/yr
- Unhealthy air days in 30 yrs
- 0 days/yr
Risk factors via First Street. Map © Google.
Why this score? — see what drove the C+ grade
The composite is a weighted blend of 9 inputs, each scored 0–100. Each bar is that input's sub-score; the figure is the points it added to the 100-point composite (weight × sub-score).
- Cash flow +22.1/30.0
- ARV discount +15.0/15.0
- DSCR +7.1/10.0
- 1% rule +5.1/10.0
- Livability +4.2/5.0
- Rent growth +2.8/5.0
- Schools +2.5/10.0
- Condition / age +2.5/5.0
- Appreciation +0.0/10.0
$128,900
🖨 Deal sheet 📄 Offer letter ✓ Due diligence
Listing remarks MLS
Adorable remodeled cottage with fenced in yard. Storage building/Garage in back with plenty of parking area. Home has added on addition to be used as a hobby room or rec room. Close to APSU
Key facts
- Previously renovated
- Practical layout
- Central location
Tags
Property features AI
Exterior
- Parking: Concrete parking surface
- Utilities: Public water; Public sewer; Natural gas available
- Home design: Single family residence; One story
- Construction: Vinyl siding; Shingle roof; Existing construction
- Exterior features: Deck; Back yard fencing; Storage structure; Level lot
Interior
- Kitchen: Eat-in kitchen (13x20); Electric oven
- Bedrooms: 2 bedrooms (both on the main level); Bedroom 1: 15x13; Bedroom 2: 10x12
- Flooring: Laminate; Tile
- Bathrooms: 1 full bathroom
- Heating & cooling: Central heating (natural gas); Central air conditioning
- Interior features: Electric oven; Laminate and tile flooring; Crawl space basement; Living room fireplace
- Laundry & utility: Natural gas available; Water available
Neighborhood map
What this means for you Summary
Snapshot
- This is a 2-bed/1.0-bath single-family listed at $129k.
Deal economics
- At list price, monthly cash flow is $206 ($2k/yr) — positive.
- The deal already cash-flows at list — no discount required.
- Meets the 1% rule at list price ($1k rent vs $129k).
- Recommended offer: $125k (3.0% below list) — sets the bar for market timing.
- Cap rate 8.2% vs local median 3.5% in Clarksville — top-decile yield for the area; either an underpriced asset or a hidden risk that comps aren't pricing in. Stress-test before assuming the spread holds.
Location & tenants
- Location reads 84/100 on livability (#1 in TN, #798 nationally) — a professional / high-income tenant draw. Strengths: amenities A+, commute A+, cost of living A+; Watch: employment C-, crime D+.
- Montgomery County (urban): math 25% / reading 31% proficiency, ranked #65 of 139 in TN (top 47%) — low school quality limits family demand, transient renter base, plan for 1-2y turnover.
- Zoned schools: Barksdale Elementary (math 45% / reading 35%, grade F, #226 of 952 statewide, top 24%, 496 students, 0% FRL); Clarksville High (math 7% / reading 52%, grade F, #86 of 332 statewide, top 27%, 1,561 students, 0% FRL) — zoned schools average 0% FRL vs 40% district-wide (40 pts lower); this property's tenant base skews higher-income than the district average.
- Market conditions: Rents rising (+1.3%/yr); 604 active listings in the ZIP; 40 comparable units currently listed for rent nearby; rentals at typical pace (median 21d on market — plan ~3-4 weeks tenant-placement turnaround); 2,583 units permitted in Montgomery County in 2024 (617 in 5+ unit buildings).
Forward outlook
- Local home prices are declining (-3.0%/yr); year-one equity from $891 of loan paydown is wiped out by about $4k of value loss. Plan a longer hold.
- Montgomery County population projected at +49% by 2050 — long-run rental-demand tailwind backs the buy-and-hold thesis.
Negotiation context
- It's been on market 60 days — a 3% lower offer ($125k) is reasonable based on typical stale-listing flexibility.
- 3 sale attempts since 10y ago; this cycle's ask has dropped $31k (19%) from the opening price — seller is motivated, your offer sets the floor, not the list.
- Current owner paid $63k; list at $129k implies a 105% gain — meaningful room to come down on a strong offer.
Risks & watch-outs
- Watch-outs: built in 1952 — expect roof / HVAC / electrical / plumbing capex.
- Climate carrying-cost: extreme-heat days projected 7→20/yr by 2055 (HVAC capex compounding) — expect insurance premiums to compound above CPI over the hold.
Questions for the listing agent
- It's been on market 60 days. Have you received any prior offers? Is the seller open to a 3% concession, seller financing, or rate buy-down credit?
- Built in 1952 — when were the roof, HVAC, electrical panel, plumbing, and water heater last replaced?
- Is there a deadline driving the sale (1031 exchange, divorce, estate, relocation)? That informs how much negotiation room exists.
- Crime grade is D in this area — have there been break-ins, vandalism, or insurance claims at this property in the last 3 years? What carrier currently insures it and at what premium?
- What's the average days-on-market for RENTAL listings here right now (not sales)? A rising rental-DOM trend means longer vacancies and softer asking-rent achievability than the comps imply.
- What's the recent tenant-quality profile in this submarket — average credit score on applications, eviction rate, late-payment / NSF rate, and stable-employment percentage? A property-management company in the area should have these aggregated.
- How much new for-sale + rental construction is in the pipeline within 1–3 miles? Heavy new supply typically softens prices + rents 12–24 months out; constrained supply supports both.
Investment metrics
- 1% rule
- 1.01% ✓
- Cap rate
- 8.21%
- Cash-on-cash
- 6.86%
- DSCR
- 1.31
- GRM
- 8.2
CMA / ARV
- ARV (on-the-fly)
- $211,200
- Comps found
- 12
Show comp detail 12 sales within ~0.75 mi
| Address | Dist | Beds/Ba | Sqft | Sold | Price | $/sf | Match |
|---|---|---|---|---|---|---|---|
| 917 Lucas Ln | 0.12mi | 3/1.0 (+1) | 1,032 (-2%) | 10mo | $220,000 | $213 | 78 |
| 1231 Daniel St | 0.09mi | 2/1.0 | 953 (-10%) | 8mo | $187,000 | $196 | 73 |
| 775 Greenwood Ave | 0.47mi | 2/2.0 | 1,034 (-2%) | 0mo | $227,000 | $220 | 70 |
| 1227 Greenfield Dr | 0.10mi | 2/2.5 | 1,164 (+10%) | 2mo | $230,000 | $198 | 70 |
| 12271/2 Greenfield Dr | 0.11mi | 2/2.5 | 1,164 (+10%) | 7mo | $225,000 | $193 | 66 |
| 138 Cross Ln | 0.45mi | 2/1.0 | 1,000 (-5%) | 6mo | $194,000 | $194 | 66 |
| 1322 Vogue Hill Rd | 0.34mi | 3/1.0 (+1) | 1,000 (-5%) | 12mo | $225,000 | $225 | 60 |
| 803 Old Woodmont Blvd | 0.48mi | 3/1.0 (+1) | 1,125 (+6%) | 2mo | $224,900 | $200 | 60 |
| 758 Woodmont Blvd | 0.52mi | 2/1.0 | 925 (-12%) | 7mo | $205,000 | $222 | 49 |
| 913 Woodland St | 0.54mi | 3/1.0 (+1) | 950 (-10%) | 7mo | $77,500 | $82 | 47 |
| 914 Woodland St | 0.51mi | 3/2.0 (+1) | 1,204 (+14%) | 1mo | $260,000 | $216 | 43 |
| 1206 Talley Dr | 0.69mi | 3/1.0 (+1) | 912 (-14%) | 11mo | $135,000 | $148 | 31 |
Match score weights: distance 35% · size 25% · config 20% · recency 20%. Top-matched comps best support the ARV.
Projected returns pro-forma
-3.0% appreciation · 1.32% rent growth · sell at horizon
- IRR
- -7.6%
- Equity multiple
- 0.72×
- Total profit
- $-9,929
- Equity at exit
- $19,219
- IRR
- -0.2%
- Equity multiple
- 0.99×
- Total profit
- $-408
- Equity at exit
- $11,145
Cash invested: $36,092 (down + closing). Projections, not guarantees.
Landlord ↔ Tenant lean methodology
- Overall (STATE)
- 87 Strongly Landlord-Friendly
- State Tennessee
- 87 Strongly Landlord-Friendly · R+13
- County
- — inherits STATE
- City
- — inherits STATE
ZIP-level market 37040
- Home prices YoY
- -22.0%
- Rents YoY
- 1.3%
- Active inventory
- 604
- Price-to-rent
- 8.2×
Monthly cashflow live
- Estimated rent
- $1,305 high interval (Pro) →
- Mortgage (P&I)
- −$676
- Tax from tax record
- −$95 /mo · $1,136/yr
- Insurance
- −$54
- HOA
- −$0
- Vacancy / Maint / Mgmt
- −$274
- Net cashflow
- $206
Break-even live
UW: 25.0% down · 7.5% · 30yr · 1.5% tax · 5.0% vac · 8.0% maint · 8.0% mgmt
Financing live
Cash to close
- Down payment
- $32,225
- Closing costs
- $3,867
- Reserves months
- —
- Total cash needed
- —
Loan-product check · same deal, 3 products live
Conventional
25% down · 7.5% · 30yr
- Down + closing
- —
- Monthly P&I
- —
- Monthly cashflow
- —
- DSCR
- —
- Eligible?
- —
Personal DTI + credit; lowest rate.
DSCR
20% down · 8.5% · 30yr
- Down + closing
- —
- Monthly P&I
- —
- Monthly cashflow
- —
- DSCR
- —
- Eligible?
- —
No personal income docs; deal must DSCR.
Hard money
10% down · 12.0% · 12mo
- Down + closing
- —
- Monthly P&I
- —
- Monthly cashflow
- —
- DSCR
- —
- Eligible?
- —
Short-term bridge; refi at stabilization.
Rent comps 40 comps
| Address | Beds | Baths | Sqft | Rent | $/sqft | DOM | Units | Dist |
|---|---|---|---|---|---|---|---|---|
| 1251 Daniel St Clarksville, TN | 2.0 | 1.0 | 912 | $1,125 | $1.23 | 21d | 1 | 0.04mi |
| 865 Central Ave Unit 1367377P Clarksville, TN | 3.0 | 2.5 | 1377 | $2,445 | $1.78 | 21d | 1 | 0.23mi |
| 947 Wall St Clarksville, TN | 2.0 | 2.5 | 1032 | $1,299 | $1.26 | 13d | 1 | 0.23mi |
| 114 Valley View Cir Unit B Clarksville, TN | 3.0 | 2.0 | 1450 | $1,700 | $1.17 | 21d | 1 | 0.34mi |
| 857 Greenwood Ave Unit A Clarksville, TN | 2.0 | 1.0 | 861 | $995 | $1.16 | 21d | 1 | 0.38mi |
| 906 E Happy Hollow Dr Clarksville, TN | 3.0 | 2.0 | 1200 | $1,315 | $1.10 | 21d | 1 | 0.49mi |
| 701 Gracey Ave Clarksville, TN | 2.0 | 2.0 | 999 | $990 | $0.99 | 21d | 1 | 0.49mi |
| 767 Monroe St Unit A Clarksville, TN | 3.0 | 1.5 | 1066 | $1,275 | $1.20 | 21d | 1 | 0.51mi |
| 922 E Happy Hollow Dr Clarksville, TN | 3.0 | 2.0 | 1200 | $1,325 | $1.10 | 21d | 1 | 0.51mi |
| 925 Woody Hills Dr Clarksville, TN | 3.0 | 2.0 | 1205 | $1,895 | $1.57 | 13d | 1 | 0.51mi |
| 918 E Happy Hollow Dr Unit 922 Clarksville, TN | 3.0 | 2.0 | 1200 | $1,325 | $1.10 | 21d | 1 | 0.51mi |
| 441 Kelly Ln Clarksville, TN | 2.0–3.0 | 2.0 | 1051 | $925 | $0.88 | 21d | 1 | 0.52mi |
| 1494 Golf Club Ln Clarksville, TN | 2.0–3.0 | 2.5–3.0 | 1288 | $1,420 | $1.10 | 13d | 7 | 0.56mi |
| 464 Thompkins Ln Clarksville, TN | 3.0 | 1.5 | 1100 | $1,375 | $1.25 | 21d | 1 | 0.63mi |
| 919 Martin St Unit B6 Clarksville, TN | 2.0 | 2.5 | 1100 | $1,295 | $1.18 | 21d | 1 | 0.63mi |
| 625 Greenwood Ave Clarksville, TN | 2.0 | 1.0 | 800 | $1,000 | $1.25 | 21d | 1 | 0.66mi |
| 180 Clay Ridge Dr Clarksville, TN | 3.0 | 2.5 | 1412 | $1,695 | $1.20 | 21d | 1 | 0.73mi |
| 1010 Ridgecrest Dr Clarksville, TN | 2.0 | 1.0 | 775 | $1,150 | $1.48 | 13d | 1 | 0.76mi |
| 803 Golf View Pl Unit C Clarksville, TN | 2.0 | 1.5 | 1000 | $975 | $0.97 | 21d | 1 | 0.81mi |
| 945 Cumberland Dr Clarksville, TN | 3.0 | 2.5 | 1350 | $1,500 | $1.11 | 21d | 1 | 0.82mi |
| 839 Cumberland Dr Clarksville, TN | 3.0 | 2.5 | 1269 | $1,550 | $1.22 | 13d | 1 | 0.83mi |
| 839 Cumberland Dr Clarksville, TN | 3.0 | 2.5 | 1269 | $1,550 | $1.22 | 21d | 1 | 0.83mi |
| 813 Golf View Pl Apt B Clarksville, TN | 2.0 | 2.0 | 1050 | $985 | $0.94 | 21d | 1 | 0.83mi |
| 815 Golf View Pl Apt E Clarksville, TN | 2.0 | 1.5 | 1050 | $950 | $0.90 | 21d | 1 | 0.85mi |
| 1221 Madison St Unit 2 Clarksville, TN | 2.0 | 1.0 | 750 | $795 | $1.06 | 13d | 1 | 0.86mi |
| 254 Woodland Valley Ln Clarksville, TN | 2.0 | 2.5 | 1216 | $1,400 | $1.15 | 21d | 1 | 0.87mi |
| 335 Greenwood Ave Clarksville, TN | 2.0 | 2.5 | 1117 | $1,245 | $1.11 | 21d | 1 | 0.87mi |
| 1436 McCan Dr Clarksville, TN | 2.0 | 1.0 | 880 | $805 | $0.91 | 13d | 1 | 0.88mi |
| 1221 Madison St Unit 6 Clarksville, TN | 2.0 | 1.0 | 750 | $795 | $1.06 | 21d | 1 | 0.90mi |
| 219 Woodland Valley Ln Clarksville, TN | 2.0 | 2.5 | 1228 | $1,250 | $1.02 | 21d | 1 | 0.95mi |
| 127 Davis Ridge Ln Clarksville, TN | 2.0 | 2.5 | 1216 | $1,295 | $1.06 | 21d | 1 | 0.96mi |
| 218 Woodland Valley Ln Clarksville, TN | 2.0 | 2.5 | 1228 | $1,250 | $1.02 | 21d | 1 | 0.96mi |
| 300 Greenwood Ave Clarksville, TN | 1.0 | 1.5 | 1360 | $1,155 | $0.85 | 13d | 1 | 0.97mi |
| 121 Lookout Dr Unit Upstairs Clarksville, TN | 2.0 | 1.0 | 1476 | $1,025 | $0.69 | 13d | 1 | 0.99mi |
| 947 Charlotte St Clarksville, TN | 2.0 | 1.0 | 800 | $850 | $1.06 | 21d | 1 | 1.00mi |
| 545 12th St Clarksville, TN | 2.0 | 1.0 | 900 | $962 | $1.07 | 21d | 4 | 1.00mi |
| 412 Highland Cir Clarksville, TN | 2.0 | 1.0 | 775 | $1,095 | $1.41 | 13d | 1 | 1.03mi |
| 400 Highland Cir Clarksville, TN | 3.0 | 1.0 | 936 | $950 | $1.01 | 21d | 1 | 1.03mi |
| 330 S 7th St Unit B Clarksville, TN | 3.0 | 2.0 | 1152 | $1,475 | $1.28 | 21d | 1 | 1.07mi |
| 320 S 7th St Unit 330A Clarksville, TN | 3.0 | 2.0 | 1152 | $1,475 | $1.28 | 21d | 1 | 1.07mi |
Listing history 24 events
-
2026-06-09status $128,900 Pending 60 DOM
-
2026-06-08days on market $128,900 Active 60 DOM
-
2026-06-07days on market $128,900 Active 59 DOM
-
2026-06-05pricedays on market $128,900 Active 56 DOM
-
2026-06-03days on market $129,900 Active 55 DOM
-
2026-06-02days on market $129,900 Active 54 DOM
-
2026-05-31days on market $129,900 Active 52 DOM
-
2026-05-30days on market $129,900 Active 51 DOM
-
2026-05-14price $138,900
-
2026-05-07price $139,900
-
2026-04-30price $149,900
-
2026-04-23price $158,900
-
2026-04-09$159,900 Active
-
2017-09-04soldstatus $63,000 Closed 193-char remark
Show marketing remark (193 chars)
Adorable remodeled cottage with fenced in yard. Storage building/Garage in back with plenty of parking area. Home has added on addition to be used as a hobby room or rec room. Close to APSU
-
2017-09-01soldstatus $59,000
-
2017-06-05status Pending 193-char remark
Show marketing remark (193 chars)
Adorable remodeled cottage with fenced in yard. Storage building/Garage in back with plenty of parking area. Home has added on addition to be used as a hobby room or rec room. Close to APSU
-
2017-04-25price $62,400 193-char remark
Show marketing remark (193 chars)
Adorable remodeled cottage with fenced in yard. Storage building/Garage in back with plenty of parking area. Home has added on addition to be used as a hobby room or rec room. Close to APSU
-
2017-04-06$62,900 Active 193-char remark
Show marketing remark (193 chars)
Adorable remodeled cottage with fenced in yard. Storage building/Garage in back with plenty of parking area. Home has added on addition to be used as a hobby room or rec room. Close to APSU
-
2016-12-19soldstatus $30,000 Closed 108-char remark
Show marketing remark (108 chars)
Cute Cottage with fully fenced yard, 2 spacious bedrooms. Storage building. Located Downtown, close to APSU
-
2016-11-30status Pending 108-char remark
Show marketing remark (108 chars)
Cute Cottage with fully fenced yard, 2 spacious bedrooms. Storage building. Located Downtown, close to APSU
-
2016-11-09price $32,000 108-char remark
Show marketing remark (108 chars)
Cute Cottage with fully fenced yard, 2 spacious bedrooms. Storage building. Located Downtown, close to APSU
-
2016-09-20price $37,000 108-char remark
Show marketing remark (108 chars)
Cute Cottage with fully fenced yard, 2 spacious bedrooms. Storage building. Located Downtown, close to APSU
-
2016-08-14$42,000 Active 108-char remark
Show marketing remark (108 chars)
Cute Cottage with fully fenced yard, 2 spacious bedrooms. Storage building. Located Downtown, close to APSU
-
1999-03-30soldstatus $35,000
ⓘ Source: listings_history table (triggers on properties + properties_extension) + one-shot
backfill from property_details.listing_events for pre-trigger history.
Tax reassessment forecast TN · Resets to sale price
- Current annual tax
- $1,136 · $95/mo
- Projected year-2 tax
- $1,136 · $95/mo
- Expected delta
- $0/yr ($0/mo · 0.0%)
ⓘ Screening estimate from a state-policy table — verify with the county assessor before closing.
Climate risk First Street
- Flood 1/10 Low FEMA zone X (unshaded) · 0% chance over 30 yrs
- Wildfire 1/10 Low
- Heat 5/10 Major 7 d/yr ≥108°F today · 20 d/yr by 30 yrs out
- Wind 4/10 Moderate 9% chance of damaging wind over 30 yrs
- Air quality 1/10 Low 0 unhealthy d/yr today · 0 by 30 yrs out
Nearby sold comps map
Loading sold comps map…
Walkable amenities ~0.75 mi
Loading nearby amenities…
Taxation est. · year 1
- Rental income
- $15,657
- − Mortgage interest
- −$7,220
- − Property taxes
- −$1,136
- − Insurance
- −$644
- − Repairs & maintenance
- −$1,253
- − Management
- −$1,253
- − Depreciation
- −$3,750
- Taxable income
- $402
- Est. tax owed @ 24.0%
- −$96
- After-tax cash flow
- $2,381/yr
For passive investors: Depreciation is non-cash, so a rental often shows a tax loss while cash-flowing — sheltering income. Rental losses are passive: they offset passive income freely, and up to $25,000/yr can offset ordinary (W-2) income if you actively participate and your MAGI is under $100k (phasing out to $0 by $150k); unused losses carry forward. On sale, claimed depreciation is recaptured at up to 25%, and gains may owe capital-gains tax (a 1031 exchange can defer both). Figures are a year-1 estimate at your 24.0% rate — not tax advice; consult a CPA.
Schools (NCES district)
- District
- Montgomery County
- NCES district ID
- 4703030
- Math proficiency
- 25% ▼ -20.00%
- Reading proficiency
- 31% ▼ -10.00%
- Median HH income
- $50,423
- Composite
- 24.56/100
- National rank
- #7641
- State rank
- #65 of 139 in TN
Livability — Clarksville
- Score
- 84/100
- State rank
- #1
- US rank
- #798
Category grades
Schools grade is shown separately in the Schools card above.
Census & demographics
- Census place
- Clarksville, TN
- County
- Montgomery County · 211,371 people
- City population
- 211,371
- Metro
- Clarksville, TN-KY
- Population (ZIP)
- 64,977
- Household income
- $67,745
- Rent vs Own
- Severe rent burden
- 2670.0
Population outlook (Montgomery County) Hauer SSP2
- Today (2025)
- 236,633 people
- By 2030
- 258,978 · +9.4%
- By 2040
- 305,456 · +29.1%
- By 2050
- 353,147 · +49.2%
- By 2075
- 471,289 · +99.2%
- By 2100
- 564,122 · +138.4%
Race, ethnicity, and origin ACS 2023
- Neighborhood character
- Diverse neighborhood (Simpson 0.61)
- Race & ethnicity
- White 56% Black 25% Two or more races 11% Hispanic / Latino 10% Asian 2%
- Hispanic origin (detail)
- Mexican 6% Puerto Rican 2%
- Common ancestry
- Italian 4% Lithuanian 1% Slovak 1%
- Foreign-born
- 6% · Canada, South Korea
- Languages at home
- 90% English-only · Spanish 5% Other Asian/Pacific 1% Other Indo-European 1%
Political lean MEDSL · Montgomery
- 2024 margin
- R (+18.4) · D 40.0% · R 58.5% · Other 1.5%
- 2008→2024 swing
- -10.5pp toward R · 2008: -7.9pp · 2024: -18.4pp
- All cycles
- 2024: R+18.4 2020: R+12.7 2016: R+18.6 2012: R+10.5 2008: R+7.9
Not yet ingested
- Civics
- —
Market trends
- HPI YoY
- ▼ -75.79%
- Current HPI
- 269.0601
- Rent YoY
- ▲ 1.32%
- Metro
- Clarksville, TN-KY
- State GDP YoY
- ▲ 2.78%
- F500 in state
- 22
Industry mix (Fortune 500 HQ in TN)
| Industry | F500 HQs | Revenue |
|---|---|---|
| Healthcare | 3 | $91B |
|
||
| Retail | 3 | $72B |
|
||
| Transportation / Logistics | 1 | $88B |
|
||
| Paper / Packaging | 1 | $19B |
|
||
| Insurance | 1 | $13B |
|
||
| Energy | 1 | $12B |
|
||
Price history
+296.9% since first listed16 events — show timeline
- 2026-05-14 Price Changed $138,900 REALTRACS as Distributed by MLS Grid
- 2026-05-07 Price Changed $139,900 REALTRACS as Distributed by MLS Grid
- 2026-04-30 Price Changed $149,900 REALTRACS as Distributed by MLS Grid
- 2026-04-23 Price Changed $158,900 REALTRACS as Distributed by MLS Grid
- 2026-04-09 Listed $159,900 REALTRACS as Distributed by MLS Grid
- 2017-09-04 Sold (MLS) $63,000 REALTRACS as Distributed by MLS Grid
- 2017-09-01 Sold (Public Records) $59,000 Public Records
- 2017-06-05 Pending — REALTRACS as Distributed by MLS Grid
- 2017-04-25 Price Changed $62,400 REALTRACS as Distributed by MLS Grid
- 2017-04-06 Listed $62,900 REALTRACS as Distributed by MLS Grid
- 2016-12-19 Sold (MLS) $30,000 REALTRACS as Distributed by MLS Grid
- 2016-11-30 Pending — REALTRACS as Distributed by MLS Grid
- 2016-11-09 Price Changed $32,000 REALTRACS as Distributed by MLS Grid
- 2016-09-20 Price Changed $37,000 REALTRACS as Distributed by MLS Grid
- 2016-08-14 Listed $42,000 REALTRACS as Distributed by MLS Grid
- 1999-03-30 Sold (Public Records) $35,000 Public Records
Property tax history
+12.6%/yrLatest (2025): $1,136 · +1.3% YoY. Source: county tax records.
Cash-flow waterfall
monthlySold comps — $/sqft
last 12 mo · ≤1 miLoading sold comps…