 Multi-family
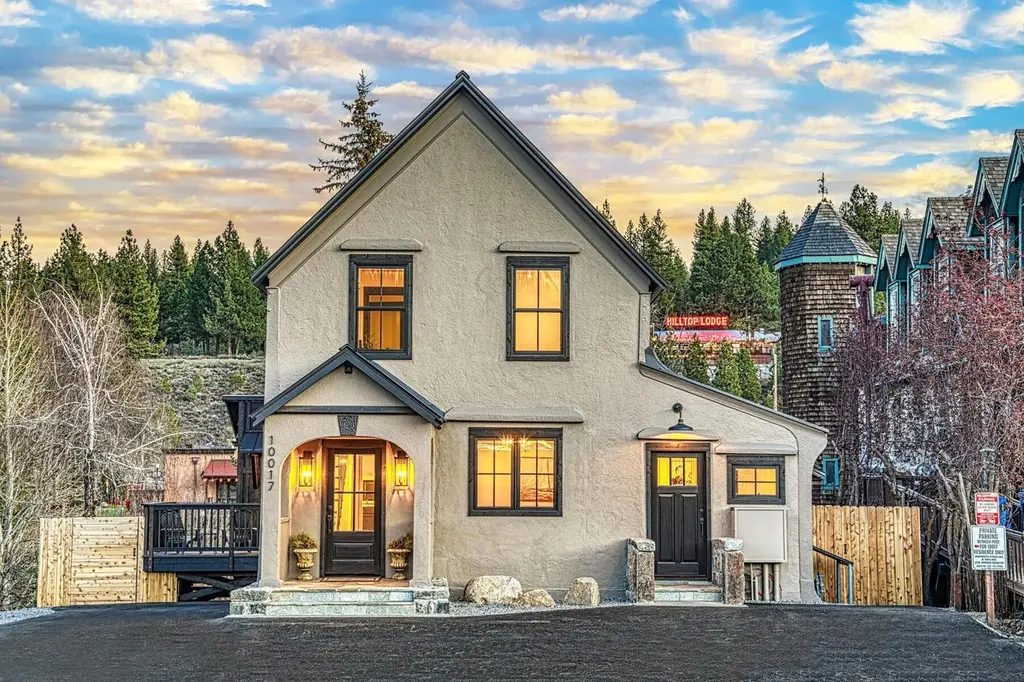
10017 East River St · Truckee, CA
Flood risk 9/10 · Severe
- FEMA flood zone
- X (unshaded)
- Chance of flooding over 30 yrs
- 0.99%
- Est. flood insurance / yr
- $507 – $1,088
Fire risk 7/10 · Major
- Est. fire insurance / yr
- $659 – $1,223
Heat risk 2/10 · Minimal
- Hot days now (above 87°F)
- 9 days/yr
- Hot days in 30 yrs
- 24 days/yr
Wind risk 1/10 · Minimal
- Chance of severe wind over 30 yrs
- —
Air-quality risk 8/10 · Major
- Unhealthy air days now
- 16 days/yr
- Unhealthy air days in 30 yrs
- 18 days/yr
Risk factors via First Street. Map © Google.
Why this score? — see what drove the C- grade
The composite is a weighted blend of 9 inputs, each scored 0–100. Each bar is that input's sub-score; the figure is the points it added to the 100-point composite (weight × sub-score).
- Cash flow +16.8/30.0
- ARV discount +7.5/15.0
- DSCR +5.2/10.0
- Appreciation +5.0/10.0
- Schools +4.4/10.0
- 1% rule +3.2/10.0
- Livability +2.9/5.0
- Rent growth +2.5/5.0
- Condition / age +2.5/5.0
$1,895,000
🖨 Deal sheet (PDF) 📄 Offer letter ✓ Due diligence
Multi-family units
County records classify this as Multi-Family (2-4 Unit). Listing-text estimate: 1 unit. estimate disagrees with records
Listing remarks
Fully remodeled and ideally located in the heart of Truckee, this historical property offers a rare opportunity to own a piece of local history while enjoying modern comfort and flexibility. Situated in the heart of one of America’s top-ranked ski towns, you’re just minutes from world-class resorts and year-round outdoor adventure. Zoned with the highly desirable DMU (Downtown Mixed Use) designation, this versatile multi-family property features two distinct living units, but could easily live as one single family home, plus the potential for private office space or a large mudroom—perfect for those seeking a live/work lifestyle or rental income opportunities. The lower le
Key facts
- Private office space
- Fully remodeled
- Historical property
Tags
Property features AI
Exterior
- Parking: Parking pad; No garage
- Utilities: Water from utility district; Sewer to utility district
- Home design: Mountain-style architecture; Single-family home; Two levels
- Construction: Frame construction; Metal roof; Concrete perimeter foundation; Property listed in Truckee subdivision
- Exterior features: Level topography; Street access
Interior
- Kitchen: Range; Oven; Microwave; Dishwasher; Garbage disposal; Refrigerator
- Bathrooms: 2 full bathrooms
- Heating & cooling: Electric heating; Central forced air heating
- Interior features: Like-new condition; Downtown view
- Laundry & utility: Hall laundry
Neighborhood map
What this means for you Summary
Snapshot
- This is a 4-bed/2.0-bath multifamily listed at $1.90M.
Deal economics
- At list price, monthly cash flow is $1k ($14k/yr) — positive.
- The deal already cash-flows at list — no discount required.
- To meet the 1% rule (rent ≥ 1% of price), the offer needs to be $1.56M (17.7% below list).
- Recommended offer: $1.56M (17.7% below list) — sets the bar for 1% rule.
- Cap rate 7.1% vs local median 2.0% in Truckee — top-decile yield for the area; either an underpriced asset or a hidden risk that comps aren't pricing in. Stress-test before assuming the spread holds.
Location & tenants
- Location reads 58/100 on livability (#697 in CA) — a working-class tenant base; expect higher turnover. Strengths: employment A+, housing B; Watch: amenities F, commute F, cost of living F.
- Tahoe-Truckee Unified (town): math 44% / reading 56% proficiency, ranked #136 of 517 in CA (top 26%) — acceptable for families but not a draw, mixed tenant base, ~2y average lease.
- Zoned schools: Glenshire Elementary (math 62% / reading 70%, grade B+, #176 of 1,571 statewide, top 11%, 500 students, 12% FRL); Alder Creek Middle (math 41% / reading 54%, grade C-, #113 of 498 statewide, top 23%, 538 students, 26% FRL); Tahoe Truckee High (math 47% / reading 62%, grade C-, #256 of 1,170 statewide, top 24%, 890 students, 24% FRL).
- Market conditions: 3 active listings in the ZIP; 9 comparable units currently listed for rent nearby; rentals lingering (median 45d on market — plan ~5-8 weeks vacancy on turnover, expect pricing pressure); 89% of comp listings sitting > 30 days — soft ceiling on asking rent; 215 units permitted in Nevada County in 2024 (0 in 5+ unit buildings).
Forward outlook
- In year one you build about $70k of equity ($13k loan paydown + $57k appreciation (3.0% local appreciation)).
- Nevada County population projected at -14% by 2050 — secular population decline; favor cash flow + early exit over multi-decade hold.
- At projected returns (3.0% appreciation + 3.0% rent growth), your $531k cash investment doubles in ~6 years — after that, you're playing with house money.
- By year 2, paydown + projected appreciation supports a ~$114k cash-out refi (75% LTV) — recoverable capital for the next deal without selling this one.
Negotiation context
- It's been on market 60 days — a 3% lower offer ($1.84M) is reasonable based on typical stale-listing flexibility.
- Current owner paid $1.26M; list at $1.90M implies a 50% gain — meaningful room to come down on a strong offer.
Risks & watch-outs
- Watch-outs: flood insurance adds $66/mo; built in 1881 — expect roof / HVAC / electrical / plumbing capex.
- Climate carrying-cost: severe flood risk; major wildfire risk — expect insurance premiums to compound above CPI over the hold.
Questions for the listing agent
- It's been on market 60 days. Have you received any prior offers? Is the seller open to a 18% concession, seller financing, or rate buy-down credit?
- Built in 1881 — when were the roof, HVAC, electrical panel, plumbing, and water heater last replaced?
- What's the actual annual flood-insurance premium (NFIP or private), and is the property in a SFHA with mandatory coverage?
- Is there a deadline driving the sale (1031 exchange, divorce, estate, relocation)? That informs how much negotiation room exists.
- What's the average days-on-market for RENTAL listings here right now (not sales)? A rising rental-DOM trend means longer vacancies and softer asking-rent achievability than the comps imply.
- What's the recent tenant-quality profile in this submarket — average credit score on applications, eviction rate, late-payment / NSF rate, and stable-employment percentage? A property-management company in the area should have these aggregated.
- How much new apartment / multifamily construction is in the pipeline within 1–3 miles? Heavy new supply (>2% of stock underway) typically softens rents 12–24 months out; light construction supports rent growth.
Investment metrics
- 1% rule
- 0.82% ✗
- Cap rate
- 7.07%
- Cash-on-cash
- 2.77%
- DSCR
- 1.12
- GRM
- 10.1
CMA / ARV
- ARV (median comp)
- $1,219,917
- List price
- $1,895,000
- Delta
- 55.34%
- Verdict
- OVERPRICED
- Comps
- 20 within 1.0 mi
Projected returns pro-forma
3.0% appreciation · 3.0% rent growth · sell at horizon
- IRR
- 9.9%
- Equity multiple
- 1.57×
- Total profit
- $301,210
- Equity at exit
- $852,074
- IRR
- 12.2%
- Equity multiple
- 2.82×
- Total profit
- $967,725
- Equity at exit
- $1,313,148
Cash invested: $530,600 (down + closing). Projections, not guarantees.
Landlord ↔ Tenant lean methodology
- Overall (STATE)
- 18 Strongly Tenant-Friendly
- State California
- 18 Strongly Tenant-Friendly · D+13
- County
- — inherits STATE
- City
- — inherits STATE
ZIP-level market 96161-2152
- Active inventory
- 3
- Price-to-rent
- 20.2×
Monthly cashflow live
- Estimated rent
- $15,600 medium interval (Pro) →
- Mortgage (P&I)
- −$9,938
- Tax from tax record
- −$370 /mo · $4,444/yr
- Insurance
- −$790
- Flood insurance flood zone
- −$66 /mo · $798/yr
- HOA
- −$0
- Vacancy / Maint / Mgmt
- −$3,276
- Net cashflow
- $1,160
Break-even live
Sensitivity live
| Price | -10% $2,233 | -5% $1,696 | +0% $1,160 | +5% $624 | +10% $87 |
|---|---|---|---|---|---|
| Rent | -10% $-72 | -5% $544 | +0% $1,160 | +5% $1,776 | +10% $2,392 |
| Rate | -1.0pp $2,114 | -0.5pp $1,642 | base $1,160 | +0.5pp $669 | +1.0pp $169 |
2-unit breakdown (identical units grouped — click to expand)
| Units | Beds | Baths | Est. rent |
|---|---|---|---|
| 2× units | 2 | 1 | $15,600 |
| #1 | 2 | 1 | $7,800 |
| #2 | 2 | 1 | $7,800 |
| Total (2 units) | $15,600 | ||
UW: 25.0% down · 7.5% · 30yr · 1.5% tax · 5.0% vac · 8.0% maint · 8.0% mgmt
Financing live
Cash to close
- Down payment
- $473,750
- Closing costs
- $56,850
- Reserves months
- —
- Total cash needed
- —
Loan-product check · same deal, 3 products live
Conventional
25% down · 7.5% · 30yr
- Down + closing
- —
- Monthly P&I
- —
- Monthly cashflow
- —
- DSCR
- —
- Eligible?
- —
Personal DTI + credit; lowest rate.
DSCR
20% down · 8.5% · 30yr
- Down + closing
- —
- Monthly P&I
- —
- Monthly cashflow
- —
- DSCR
- —
- Eligible?
- —
No personal income docs; deal must DSCR.
Hard money
10% down · 12.0% · 12mo
- Down + closing
- —
- Monthly P&I
- —
- Monthly cashflow
- —
- DSCR
- —
- Eligible?
- —
Short-term bridge; refi at stabilization.
Rent comps 9 comps
| Address | Beds | Baths | Sqft | Rent | $/sqft | DOM | Units | Dist |
|---|---|---|---|---|---|---|---|---|
| 10192 Schaffer Dr Truckee, CA | 3.0 | 2.5 | 1532 | $4,495 | $2.93 | 45d | 1 | 0.34mi |
| 10085 Nicolas Dr Unit A Truckee, CA | 3.0 | 2.5 | 1871 | $5,500 | $2.94 | 45d | 1 | 0.75mi |
| 10283 White Fir Rd Unit 1251993P Truckee, CA | 3.0 | 2.0 | 1894 | $5,879 | $3.10 | 15d | 1 | 0.99mi |
| 11319 Brockway Rd Truckee, CA | 3.0 | 2.5 | 1800 | $4,200 | $2.33 | 45d | 1 | 1.16mi |
| 9244 Heartwood Dr Truckee, CA | 4.0 | 4.0 | 2830 | $15,000 | $5.30 | 45d | 1 | 1.17mi |
| 11357 Brockway Rd Truckee, CA | 3.0 | 2.5 | 1925 | $4,500 | $2.34 | 45d | 1 | 1.22mi |
| 10077 Jake S Way Truckee, CA | 3.0 | 3.5 | 2552 | $10,500 | $4.11 | 45d | 1 | 1.29mi |
| 10207 Shore Pine Rd Truckee, CA | 4.0 | 2.0 | 1908 | $4,600 | $2.41 | 45d | 1 | 1.30mi |
| 10175 Annies Loop Truckee, CA | 3.0 | 3.5 | 2194 | $7,500 | $3.42 | 45d | 1 | 1.38mi |
Listing history 21 events
-
2026-06-21days on market $1,895,000 Active 60 DOM
-
2026-06-18days on market $1,895,000 Active 57 DOM
-
2026-06-17days on market $1,895,000 Active 56 DOM
-
2026-06-16days on market $1,895,000 Active 55 DOM
-
2026-06-15days on market $1,895,000 Active 54 DOM
-
2026-06-14days on market $1,895,000 Active 52 DOM
-
2026-06-10days on market $1,895,000 Active 49 DOM
-
2026-06-09days on market $1,895,000 Active 48 DOM
-
2026-06-08days on market $1,895,000 Active 47 DOM
-
2026-06-07days on market $1,895,000 Active 46 DOM
-
2026-06-05days on market $1,895,000 Active 43 DOM
-
2026-06-03days on market $1,895,000 Active 42 DOM
-
2026-06-02days on market $1,895,000 Active 41 DOM
-
2026-06-01days on market $1,895,000 Active 40 DOM
-
2026-05-31days on market $1,895,000 Active 39 DOM
-
2026-05-30days on market $1,895,000 Active 38 DOM
-
2026-04-22$1,895,000 Active 2366-char remark
-
2019-12-10soldstatus $1,260,909
-
2014-12-19price $1,049,000
-
2014-12-19price $1,049,000
-
2014-12-19price $1,049,000
ⓘ Source: listings_history table (triggers on properties + properties_extension) + one-shot
backfill from property_details.listing_events for pre-trigger history.
Tax reassessment forecast CA · Resets to sale price
- Current annual tax
- $4,444 · $370/mo
- Projected year-2 tax
- $14,402 · $1,200/mo
- Expected delta
- +$9,958/yr (+$830/mo · 224.0%)
ⓘ Screening estimate from a state-policy table — verify with the county assessor before closing.
Climate risk First Street
- Flood 9/10 Extreme FEMA zone X (unshaded) · 99% chance over 30 yrs
- Wildfire 7/10 Severe
- Heat 2/10 Low 9 d/yr ≥87°F today · 24 d/yr by 30 yrs out
- Wind 1/10 Low
- Air quality 8/10 Severe 16 unhealthy d/yr today · 18 by 30 yrs out
Nearby sold comps map
Loading sold comps map…
Walkable amenities ~0.75 mi
Loading nearby amenities…
Taxation est. · year 1
- Rental income
- $187,200
- − Mortgage interest
- −$106,149
- − Property taxes
- −$4,444
- − Insurance
- −$10,272
- − Repairs & maintenance
- −$14,976
- − Management
- −$14,976
- − Depreciation
- −$55,127
- Taxable loss
- −$18,746
- Est. tax savings @ 24.0%
- +$4,499
- After-tax cash flow
- $18,419/yr
For passive investors: Depreciation is non-cash, so a rental often shows a tax loss while cash-flowing — sheltering income. Rental losses are passive: they offset passive income freely, and up to $25,000/yr can offset ordinary (W-2) income if you actively participate and your MAGI is under $100k (phasing out to $0 by $150k); unused losses carry forward. On sale, claimed depreciation is recaptured at up to 25%, and gains may owe capital-gains tax (a 1031 exchange can defer both). Figures are a year-1 estimate at your 24.0% rate — not tax advice; consult a CPA.
Schools (NCES district)
- District
- Tahoe-Truckee Unified
- NCES district ID
- 0638770
- Math proficiency
- 44% ▼ -9.00%
- Reading proficiency
- 56% ▼ -4.00%
- Median HH income
- $67,136
- Composite
- 44.38/100
- National rank
- #2816
- State rank
- #136 of 517 in CA
Livability — Truckee
- Score
- 58/100
- State rank
- #697
- US rank
- #21110
Category grades
Schools grade is shown separately in the Schools card above.
Census & demographics
- Census place
- Truckee, CA
Population outlook (Nevada County) Hauer SSP2
- Today (2025)
- 98,490 people
- By 2030
- 97,295 · -1.2%
- By 2040
- 92,041 · -6.5%
- By 2050
- 85,164 · -13.5%
- By 2075
- 68,436 · -30.5%
- By 2100
- 49,536 · -49.7%
Not yet ingested
- Political lean
- —
- Race & ethnicity
- —
- Common origin
- —
- Civics
- —
Market trends
- HPI YoY
- —
- Current HPI
- —
- Rent YoY
- —
- Metro
- —
- State GDP YoY
- ▲ 3.21%
- F500 in state
- 116
Industry mix (Fortune 500 HQ in CA)
| Industry | F500 HQs | Revenue |
|---|---|---|
| Technology | 27 | $1,492B |
|
||
| Financial Services | 3 | $174B |
|
||
| Retail | 3 | $44B |
|
||
| Insurance | 3 | $26B |
|
||
| Media / Entertainment | 2 | $115B |
|
||
| Pharmaceuticals / Biotech | 2 | $62B |
|
||
Price history
+80.6% since first listed5 events — show timeline
- 2026-04-22 Listed $1,895,000 TSMLS
- 2019-12-10 Sold (Public Records) $1,260,909 Public Records
- 2014-12-19 Price Changed $1,049,000 TSMLS
- 2014-12-19 Price Changed $1,049,000 TSMLS
- 2014-12-19 Price Changed $1,049,000 TSMLS
Property tax history
+18.0%/yrLatest (2025): $4,444 · +12.3% YoY. Source: county tax records.
Cash-flow waterfall
monthlySold comps — $/sqft
last 12 mo · ≤1 miLoading sold comps…