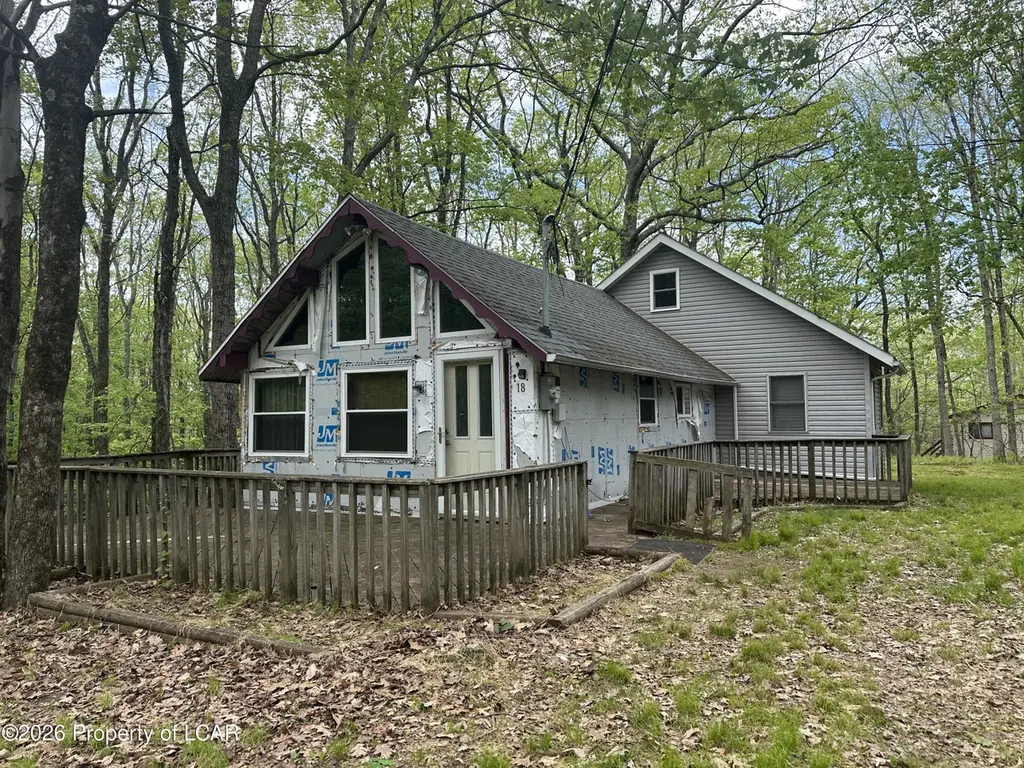
18 Prescott Rd · Hickory Hills, PA
Flood risk 1/10 · Minimal
- FEMA flood zone
- X (unshaded)
- Chance of flooding over 30 yrs
- 0.0%
- Est. flood insurance / yr
- $507 – $1,088
Fire risk 3/10 · Minor
- Est. fire insurance / yr
- $511 – $949
Heat risk 2/10 · Minimal
- Hot days now (above 91°F)
- 7 days/yr
- Hot days in 30 yrs
- 15 days/yr
Wind risk 3/10 · Minor
- Chance of severe wind over 30 yrs
- 7.0%
Air-quality risk 2/10 · Minimal
- Unhealthy air days now
- 1 days/yr
- Unhealthy air days in 30 yrs
- 2 days/yr
Risk factors via First Street. Map © Google.
Why this score? — see what drove the B grade
The composite is a weighted blend of 9 inputs, each scored 0–100. Each bar is that input's sub-score; the figure is the points it added to the 100-point composite (weight × sub-score).
- Cash flow +24.8/30.0
- ARV discount +15.0/15.0
- Appreciation +10.0/10.0
- DSCR +8.0/10.0
- 1% rule +7.2/10.0
- Livability +2.9/5.0
- Rent growth +2.5/5.0
- Condition / age +2.5/5.0
- Schools +2.0/10.0
$115,000
🖨 Deal sheet 📄 Offer letter ✓ Due diligence
Listing remarks
White Haven, PA- Fixer-upper with strong potential in the Hickory Hills gated subdivision! Home features: 3 bedrooms, 1 bathroom, 1st floor laundry, large yard for entertaining, and private driveway. Property needs updates and repairs but can offer great upside potential- all close to Pocono attractions, including whitewater rafting, hiking, ski resorts. .. and more!
Key facts
- Private driveway
- 0.28 acre lot
- Built 1980
Tags
Property features AI
Finance
- HOA & community: Homeowners association with annual fee of $1,000 (about $83.33/month)
Exterior
- Utilities: Private well water; Public sewer
- Home design: Single-family residence; Two levels
- Construction: Vinyl siding; Crawl space foundation
- Exterior features: Cleared, level lot; Lot approximately 0.28 acre; Subdivision: Hickory Hills; Directions: From Rte 940 — Enter Hickory Hills; turn right on Woodhaven Dr; follow to right on Lee Rd; follow to right on Prescott Rd; house on right
Interior
- Bathrooms: 1 full bathroom
- Heating & cooling: Ceiling fan(s); Electric heating; Propane heating; Baseboard heating; Space heater
- Interior features: Electric water heater; Fireplace (1)
Neighborhood map
What this means for you Summary
Snapshot
- This is a 3-bed/1.0-bath single-family listed at $115k.
Deal economics
- At list price, monthly cash flow is $242 ($3k/yr) — positive.
- The deal already cash-flows at list — no discount required.
- Meets the 1% rule at list price ($1k rent vs $115k).
- Recommended offer: $113k (1.5% below list) — sets the bar for market timing.
Location & tenants
- Location reads 57/100 on livability (#1,624 in PA) — a working-class tenant base; expect higher turnover. Strengths: cost of living A+, housing B; Watch: schools F, amenities F, commute F.
- Hazleton Area SD (suburban): math 18% / reading 30% proficiency, ranked #476 of 539 in PA (top 88%) — low school quality limits family demand, transient renter base, plan for 1-2y turnover.
- Market conditions: 70 active listings in the ZIP; 1 comparable units currently listed for rent nearby; 349 units permitted in Luzerne County in 2024 (16 in 5+ unit buildings).
Forward outlook
- In year one you build about $12k of equity ($795 loan paydown + $12k appreciation (10.0% local appreciation)).
- Luzerne County population projected at +4% by 2050 — modest demand growth; plan on rents tracking national, not racing it.
- At projected returns (10.0% appreciation + 3.0% rent growth), your $32k cash investment doubles in ~3 years — after that, you're playing with house money.
- By year 3, paydown + projected appreciation supports a ~$31k cash-out refi (75% LTV) — recoverable capital for the next deal without selling this one.
Negotiation context
- It's been on market 30 days — a 2% lower offer ($113k) is reasonable based on typical stale-listing flexibility.
- 2 sale attempts since 23y ago with the ask held roughly flat each time — persistent listings suggest the price (not the market) is what's stuck; bring a comps-based counter.
Questions for the listing agent
- What does the HOA fee cover, when was the last increase, and are there any pending special assessments or reserve-fund shortfalls?
- Is there a deadline driving the sale (1031 exchange, divorce, estate, relocation)? That informs how much negotiation room exists.
- Schools are F-rated, which usually means shorter tenancies and higher turnover. Who's the typical renter profile here, and what's been the actual vacancy rate?
- What's the average days-on-market for RENTAL listings here right now (not sales)? A rising rental-DOM trend means longer vacancies and softer asking-rent achievability than the comps imply.
- What's the recent tenant-quality profile in this submarket — average credit score on applications, eviction rate, late-payment / NSF rate, and stable-employment percentage? A property-management company in the area should have these aggregated.
- How much new for-sale + rental construction is in the pipeline within 1–3 miles? Heavy new supply typically softens prices + rents 12–24 months out; constrained supply supports both.
Investment metrics
- 1% rule
- 1.22% ✓
- Cap rate
- 8.82%
- Cash-on-cash
- 9.01%
- DSCR
- 1.40
- GRM
- 6.8
CMA / ARV
- ARV (on-the-fly)
- $162,378
- Comps found
- 10
Show comp detail 10 sales within ~0.75 mi
| Address | Dist | Beds/Ba | Sqft | Sold | Price | $/sf | Match |
|---|---|---|---|---|---|---|---|
| 26 Vacation Dr | 0.11mi | 3/1.0 | 828 (-1%) | 4mo | $162,000 | $196 | 89 |
| 21 Hillary Dr | 0.24mi | 3/1.0 | 816 (-2%) | 15mo | $130,000 | $159 | 72 |
| 60 Vacation Dr | 0.27mi | 2/1.0 (-1) | 900 (+8%) | 1mo | $172,500 | $192 | 69 |
| 68 Holiday Dr | 0.41mi | 3/1.5 | 905 (+8%) | 1mo | $235,000 | $260 | 65 |
| 68 Holiday Dr | 0.41mi | 3/1.5 | 896 (+7%) | 11mo | $210,000 | $234 | 58 |
| 38 Vacation Dr | 0.14mi | 3/1.0 | 960 (+15%) | 15mo | $147,000 | $153 | 56 |
| 57 Sunshine Dr | 0.41mi | 2/1.0 (-1) | 750 (-10%) | 7mo | $152,000 | $203 | 53 |
| 1252 Woodhaven Dr | 0.56mi | 2/1.0 (-1) | 816 (-2%) | 18mo | $113,000 | $138 | 49 |
| 17 Brookside Dr | 0.56mi | 2/1.5 (-1) | 800 (-4%) | 24mo | $136,000 | $170 | 39 |
| 1269 Woodhaven Dr | 0.60mi | 2/1.0 (-1) | 720 (-14%) | 22mo | $140,000 | $194 | 25 |
Match score weights: distance 35% · size 25% · config 20% · recency 20%. Top-matched comps best support the ARV.
Projected returns pro-forma
10.0% appreciation · 3.0% rent growth · sell at horizon
- IRR
- 30.9%
- Equity multiple
- 3.43×
- Total profit
- $78,102
- Equity at exit
- $103,601
- IRR
- 26.7%
- Equity multiple
- 7.77×
- Total profit
- $218,009
- Equity at exit
- $223,420
Cash invested: $32,200 (down + closing). Projections, not guarantees.
Landlord ↔ Tenant lean methodology
- Overall (STATE)
- 62 Landlord-Friendly
- State Pennsylvania
- 62 Landlord-Friendly · EVEN
- County
- — inherits STATE
- City
- — inherits STATE
ZIP-level market 18661
- Home prices YoY
- 15.0%
- Active inventory
- 70
- Price-to-rent
- 6.8×
Monthly cashflow live
- Estimated rent
- $1,400 medium interval (Pro) →
- Mortgage (P&I)
- −$603
- Tax from tax record
- −$130 /mo · $1,561/yr
- Insurance
- −$48
- HOA
- −$83
- Vacancy / Maint / Mgmt
- −$294
- Net cashflow
- $242
Break-even live
UW: 25.0% down · 7.5% · 30yr · 1.5% tax · 5.0% vac · 8.0% maint · 8.0% mgmt
Financing live
Cash to close
- Down payment
- $28,750
- Closing costs
- $3,450
- Reserves months
- —
- Total cash needed
- —
Loan-product check · same deal, 3 products live
Conventional
25% down · 7.5% · 30yr
- Down + closing
- —
- Monthly P&I
- —
- Monthly cashflow
- —
- DSCR
- —
- Eligible?
- —
Personal DTI + credit; lowest rate.
DSCR
20% down · 8.5% · 30yr
- Down + closing
- —
- Monthly P&I
- —
- Monthly cashflow
- —
- DSCR
- —
- Eligible?
- —
No personal income docs; deal must DSCR.
Hard money
10% down · 12.0% · 12mo
- Down + closing
- —
- Monthly P&I
- —
- Monthly cashflow
- —
- DSCR
- —
- Eligible?
- —
Short-term bridge; refi at stabilization.
Rent comps 1 comps
| Address | Beds | Baths | Sqft | Rent | $/sqft | DOM | Units | Dist |
|---|---|---|---|---|---|---|---|---|
| 16 Lee Rd White Haven, PA | 3.0 | 2.0 | 1000 | $1,400 | $1.40 | 43d | 1 | 0.11mi |
HOA detail
- Monthly dues
- $83 · $996/yr
- Likely covers
- watersecurity
Listing history 16 events
-
2026-06-19days on market $115,000 Active 30 DOM
-
2026-06-18days on market $115,000 Active 29 DOM
-
2026-06-17days on market $115,000 Active 28 DOM
-
2026-06-16days on market $115,000 Active 27 DOM
-
2026-06-15days on market $115,000 Active 26 DOM
-
2026-06-14days on market $115,000 Active 24 DOM
-
2026-06-12days on market $115,000 Active 23 DOM
-
2026-06-09days on market $115,000 Active 20 DOM
-
2026-06-08days on market $115,000 Active 19 DOM
-
2026-06-07days on market $115,000 Active 18 DOM
-
2026-06-02days on market $115,000 Active 13 DOM
-
2026-06-01days on market $115,000 Active 12 DOM
-
2026-05-31days on market $115,000 Active 11 DOM
-
2026-05-30days on market $115,000 Active 10 DOM
-
2026-05-20$115,000 Active
-
2003-09-16$69,900
ⓘ Source: listings_history table (triggers on properties + properties_extension) + one-shot
backfill from property_details.listing_events for pre-trigger history.
Tax reassessment forecast PA · Partial reset (capped growth)
- Current annual tax
- $1,561 · $130/mo
- Projected year-2 tax
- $1,689 · $141/mo
- Expected delta
- +$128/yr (+$11/mo · 8.2%)
ⓘ Screening estimate from a state-policy table — verify with the county assessor before closing.
Climate risk First Street
- Flood 1/10 Low FEMA zone X (unshaded) · 0% chance over 30 yrs
- Wildfire 3/10 Moderate
- Heat 2/10 Low 7 d/yr ≥91°F today · 15 d/yr by 30 yrs out
- Wind 3/10 Moderate 7% chance of damaging wind over 30 yrs
- Air quality 2/10 Low 1 unhealthy d/yr today · 2 by 30 yrs out
Nearby sold comps map
Loading sold comps map…
Walkable amenities ~0.75 mi
Loading nearby amenities…
Taxation est. · year 1
- Rental income
- $16,800
- − Mortgage interest
- −$6,442
- − Property taxes
- −$1,561
- − Insurance
- −$575
- − Repairs & maintenance
- −$1,344
- − Management
- −$1,344
- − HOA
- −$996
- − Depreciation
- −$3,345
- Taxable income
- $1,192
- Est. tax owed @ 24.0%
- −$286
- After-tax cash flow
- $2,617/yr
For passive investors: Depreciation is non-cash, so a rental often shows a tax loss while cash-flowing — sheltering income. Rental losses are passive: they offset passive income freely, and up to $25,000/yr can offset ordinary (W-2) income if you actively participate and your MAGI is under $100k (phasing out to $0 by $150k); unused losses carry forward. On sale, claimed depreciation is recaptured at up to 25%, and gains may owe capital-gains tax (a 1031 exchange can defer both). Figures are a year-1 estimate at your 24.0% rate — not tax advice; consult a CPA.
Schools (NCES district)
- District
- Hazleton Area SD
- NCES district ID
- 4211700
- Math proficiency
- 18% ▼ -3.00%
- Reading proficiency
- 30% ▼ -15.00%
- Median HH income
- $42,247
- Composite
- 20.44/100
- National rank
- #8582
- State rank
- #476 of 539 in PA
Livability — Hickory Hills
- Score
- 57/100
- State rank
- #1624
- US rank
- #22283
Category grades
Schools grade is shown separately in the Schools card above.
Census & demographics
- Census place
- Hickory Hills, PA
- Population (ZIP)
- 5,541
Population outlook (Luzerne County) Hauer SSP2
- Today (2025)
- 319,505 people
- By 2030
- 319,943 · +0.1%
- By 2040
- 322,643 · +1.0%
- By 2050
- 330,817 · +3.5%
- By 2075
- 379,145 · +18.7%
- By 2100
- 431,908 · +35.2%
Race, ethnicity, and origin ACS 2023
- Neighborhood character
- Predominantly White (92%)
- Race & ethnicity
- White 92% Two or more races 4% Hispanic / Latino 3%
- Common ancestry
- Romanian 16% Lithuanian 2% Polish 1%
- Foreign-born
- 3% · Canada
- Languages at home
- 96% English-only · Other Asian/Pacific 1% Russian/Polish/Slavic 1% Spanish 1%
Political lean MEDSL · Luzerne
- 2024 margin
- R (+19.2) · D 40.0% · R 59.2%
- 2008→2024 swing
- -27.6pp toward R · 2008: 8.4pp · 2024: -19.2pp
- All cycles
- 2024: R+19.2 2020: R+14.4 2016: R+19.6 2012: D+4.8 2008: D+8.4
Not yet ingested
- Civics
- —
Market trends
- HPI YoY
- ▲ 38.68%
- Current HPI
- 296.5596
- Rent YoY
- —
- Metro
- —
- State GDP YoY
- ▲ 1.68%
- F500 in state
- 34
Industry mix (Fortune 500 HQ in PA)
| Industry | F500 HQs | Revenue |
|---|---|---|
| Healthcare | 2 | $309B |
|
||
| Insurance | 2 | $27B |
|
||
| Telecommunications / Media | 1 | $124B |
|
||
| Industrial Distribution | 1 | $22B |
|
||
| Financial Services | 1 | $20B |
|
||
| Chemicals / Materials | 1 | $18B |
|
||
Price history
+64.5% since first listed2 events — show timeline
- 2026-05-20 Listed $115,000 LCAR
- 2003-09-16 Listed $69,900 PMAR
Property tax history
+2.8%/yrLatest (2026): $1,561 · +4.6% YoY. Source: county tax records.
Cash-flow waterfall
monthlySold comps — $/sqft
last 12 mo · ≤1 miLoading sold comps…