 🏷️ Likely Rental
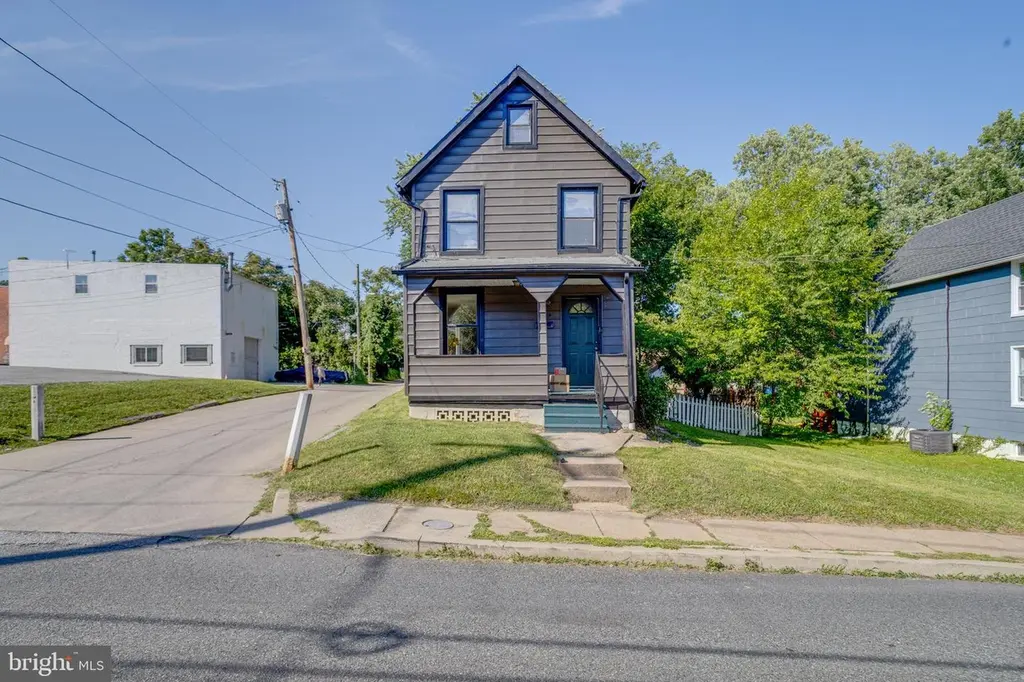
3004 Rosekemp Ave · Baltimore, MD
Flood risk 1/10 · Minimal
- FEMA flood zone
- X (unshaded)
- Chance of flooding over 30 yrs
- 0.0%
- Est. flood insurance / yr
- $473 – $860
Fire risk 1/10 · Minimal
- Est. fire insurance / yr
- $755 – $1,403
Heat risk 7/10 · Major
- Hot days now (above 103°F)
- 7 days/yr
- Hot days in 30 yrs
- 14 days/yr
Wind risk 6/10 · Moderate
- Chance of severe wind over 30 yrs
- 27.0%
Air-quality risk 4/10 · Minor
- Unhealthy air days now
- 6 days/yr
- Unhealthy air days in 30 yrs
- 7 days/yr
Risk factors via First Street. Map © Google.
Why this score? — see what drove the C- grade
The composite is a weighted blend of 9 inputs, each scored 0–100. Each bar is that input's sub-score; the figure is the points it added to the 100-point composite (weight × sub-score).
- Cash flow +16.6/30.0
- ARV discount +15.0/15.0
- DSCR +5.1/10.0
- 1% rule +4.9/10.0
- Livability +3.8/5.0
- Rent growth +2.5/5.0
- Condition / age +2.5/5.0
- Schools +1.0/10.0
- Appreciation +0.0/10.0
$199,900
🖨 Deal sheet (PDF) 📄 Offer letter ✓ Due diligence
Listing remarks MLS
3 BR, 1 BA Detached Colonial Home. Off street parking. Nice fenced in yard with mature trees. Deck off back. Well maintained with many updates. Hardwood Flooring in the LR, DR. Ceramic Tile in Kitchen, Laundry/Mud Room. Hook up for side by side washer and dryer. House is wired with state of the art Security System. Move in Ready. Also available for rent See BA9766740.
Key facts
- Sizable yard
- Functional layout
- 6,747 sq ft lot
Tags
Property features AI
Exterior
- Parking: Off-street parking
- Utilities: Public water; Public sewer; Hot water: natural gas
- Home design: Detached home; Single-family style (detached)
- Construction: Vinyl siding; Brick/mortar foundation; Built year per assessor
- Exterior features: Detached structure; Above- and below-grade other structures; Not located on tidal water
Interior
- Kitchen: Gas oven/range; Refrigerator; Exhaust fan
- Bedrooms: Three bedrooms on the upper level (3 total listed rooms identified as bedrooms)
- Flooring: Wood floors
- Bathrooms: One full bathroom (upper level); One half bathroom (lower level)
- Heating & cooling: Radiator heat (oil-fired); Central air conditioning (electric)
- Interior features: Combination dining and living area; Window treatments; Wood floors; Basement with connecting stairway, rear entrance, and sump pump
- Laundry & utility: Washer/dryer hookups only; Laundry room
Neighborhood map
What this means for you Summary
Snapshot
- This is a 3-bed/1.5-bath single-family listed at $200k.
Deal economics
- At list price, monthly cash flow is $120 ($1k/yr) — positive.
- The deal already cash-flows at list — no discount required.
- To meet the 1% rule (rent ≥ 1% of price), the offer needs to be $198k (1.1% below list).
- Recommended offer: $198k (1.1% below list) — sets the bar for 1% rule.
Location & tenants
- Location reads 76/100 on livability (#90 in MD, #3,396 nationally) — a middle-class / working-renter tenant base. Strengths: amenities A+, commute A+, housing A+; Watch: crime F.
- Baltimore City Public Schools (urban): math 7% / reading 16% proficiency, ranked #24 of 24 in MD (top 100%) — low school quality limits family demand, transient renter base, plan for 1-2y turnover; 79% free/reduced lunch — lower-income household profile, screen leases tightly.
- Zoned schools: Elmer A. Henderson: A Johns Hopkins Partnership (math 2% / reading 16%, grade F, #650 of 860 statewide, top 77%, 642 students, 80% FRL); Baltimore Polytechnic Institute (math 71% / reading 84%, grade A-, #22 of 222 statewide, top 10%, 1,555 students, 43% FRL) — zoned schools average 62% FRL vs 79% district-wide (17 pts lower); this property's tenant base skews higher-income than the district average.
- Zoned-school proficiency averages 43% at this address vs 12% district-wide (+32 pts) — the actual schools serving this property are materially stronger than the Baltimore City Public Schools average implies; a family-tenant draw the district grade alone would hide.
- Market conditions: 98 active listings in the ZIP; 40 comparable units currently listed for rent nearby; rentals at typical pace (median 26d on market — plan ~3-4 weeks tenant-placement turnaround); solid renter incomes; 1,273 units permitted in Baltimore city in 2024 (1,104 in 5+ unit buildings).
Forward outlook
- Local home prices are declining (-3.0%/yr); year-one equity from $1k of loan paydown is wiped out by about $6k of value loss. Plan a longer hold.
- Baltimore County population projected to shrink 4% by 2050 — rents likely to lag national; underwrite the cash flow, not the appreciation.
Negotiation context
- Only 11 days on market — expect competitive offers; lowballing is unlikely to land.
- 15 sale attempts since 33y ago with the ask held roughly flat each time — persistent listings suggest the price (not the market) is what's stuck; bring a comps-based counter.
- Current owner paid $115k; list at $200k implies a 74% gain — meaningful room to come down on a strong offer.
Risks & watch-outs
- Watch-outs: built in 1921 — expect roof / HVAC / electrical / plumbing capex.
- Climate carrying-cost: major wind risk, 27% chance of damaging wind over 30y; extreme-heat days projected 7→14/yr by 2055 (HVAC capex compounding) — expect insurance premiums to compound above CPI over the hold.
Questions for the listing agent
- Built in 1921 — when were the roof, HVAC, electrical panel, plumbing, and water heater last replaced?
- Is there a deadline driving the sale (1031 exchange, divorce, estate, relocation)? That informs how much negotiation room exists.
- Schools are D-rated, which usually means shorter tenancies and higher turnover. Who's the typical renter profile here, and what's been the actual vacancy rate?
- Crime grade is F in this area — have there been break-ins, vandalism, or insurance claims at this property in the last 3 years? What carrier currently insures it and at what premium?
- What's the average days-on-market for RENTAL listings here right now (not sales)? A rising rental-DOM trend means longer vacancies and softer asking-rent achievability than the comps imply.
- What's the recent tenant-quality profile in this submarket — average credit score on applications, eviction rate, late-payment / NSF rate, and stable-employment percentage? A property-management company in the area should have these aggregated.
- How much new for-sale + rental construction is in the pipeline within 1–3 miles? Heavy new supply typically softens prices + rents 12–24 months out; constrained supply supports both.
Investment metrics
- 1% rule
- 0.99% ✗
- Cap rate
- 7.02%
- Cash-on-cash
- 2.58%
- DSCR
- 1.11
- GRM
- 8.4
CMA / ARV
- ARV (on-the-fly)
- $288,880
- Comps found
- 12
Show comp detail 12 sales within ~0.75 mi
| Address | Dist | Beds/Ba | Sqft | Sold | Price | $/sf | Match |
|---|---|---|---|---|---|---|---|
| 3007 Grindon Ave | 0.19mi | 3/1.5 | 1,170 (-7%) | 3mo | $185,000 | $158 | 77 |
| 4525 Mainfield Ave | 0.39mi | 3/2.0 | 1,235 (-2%) | 6mo | $299,000 | $242 | 72 |
| 2303 E Cold Spring Ln | 0.51mi | 3/2.0 | 1,280 (+2%) | 2mo | $295,000 | $230 | 70 |
| 4902 Walther Ave | 0.29mi | 4/3.5 (+1) | 1,237 (-2%) | 2mo | $420,000 | $340 | 69 |
| 4801 Holder Ave | 0.25mi | 2/2.0 (-1) | 1,184 (-6%) | 5mo | $180,000 | $152 | 68 |
| 4308 Mainfield Ave | 0.63mi | 3/2.0 | 1,233 (-2%) | 3mo | $280,000 | $227 | 63 |
| 4512 Weitzel Ave | 0.42mi | 3/2.0 | 1,376 (+10%) | 3mo | $360,000 | $262 | 60 |
| 4406 Mainfield Ave | 0.54mi | 4/1.0 (+1) | 1,290 (+3%) | 5mo | $250,000 | $194 | 59 |
| 3105 Juneau Pl | 0.71mi | 4/2.5 (+1) | 1,300 (+4%) | 1mo | $335,000 | $258 | 52 |
| 5204 Catalpha Rd | 0.60mi | 2/1.5 (-1) | 1,096 (-13%) | 2mo | $250,000 | $228 | 44 |
| 2817 Hamilton Ave | 0.72mi | 3/2.5 | 1,120 (-11%) | 1mo | $295,000 | $263 | 44 |
| 4011 Woodlea Ave | 0.71mi | 3/2.0 | 1,104 (-12%) | 4mo | $172,100 | $156 | 42 |
Match score weights: distance 35% · size 25% · config 20% · recency 20%. Top-matched comps best support the ARV.
Projected returns pro-forma
-3.0% appreciation · 3.0% rent growth · sell at horizon
- IRR
- -12.2%
- Equity multiple
- 0.56×
- Total profit
- $-24,662
- Equity at exit
- $29,806
- IRR
- -3.0%
- Equity multiple
- 0.80×
- Total profit
- $-11,335
- Equity at exit
- $17,284
Cash invested: $55,972 (down + closing). Projections, not guarantees.
Landlord ↔ Tenant lean methodology
- Overall (CITY)
- 12 Strongly Tenant-Friendly
- State Maryland
- 27 Tenant-Leaning · D+14
- County
- — inherits STATE
- City Baltimore
- 12 Strongly Tenant-Friendly · D+58
ZIP-level market 21214
- Active inventory
- 98
- Price-to-rent
- 8.4×
Monthly cashflow live
- Estimated rent
- $1,978 high interval (Pro) →
- Mortgage (P&I)
- −$1,048
- Tax from tax record
- −$310 /mo · $3,726/yr
- Insurance
- −$83
- HOA
- −$0
- Vacancy / Maint / Mgmt
- −$415
- Net cashflow
- $120
Break-even live
Sensitivity live
| Price | -10% $233 | -5% $177 | +0% $120 | +5% $64 | +10% $7 |
|---|---|---|---|---|---|
| Rent | -10% $-36 | -5% $42 | +0% $120 | +5% $198 | +10% $277 |
| Rate | -1.0pp $221 | -0.5pp $171 | base $120 | +0.5pp $69 | +1.0pp $16 |
UW: 25.0% down · 7.5% · 30yr · 1.5% tax · 5.0% vac · 8.0% maint · 8.0% mgmt
Financing live
Cash to close
- Down payment
- $49,975
- Closing costs
- $5,997
- Reserves months
- —
- Total cash needed
- —
Loan-product check · same deal, 3 products live
Conventional
25% down · 7.5% · 30yr
- Down + closing
- —
- Monthly P&I
- —
- Monthly cashflow
- —
- DSCR
- —
- Eligible?
- —
Personal DTI + credit; lowest rate.
DSCR
20% down · 8.5% · 30yr
- Down + closing
- —
- Monthly P&I
- —
- Monthly cashflow
- —
- DSCR
- —
- Eligible?
- —
No personal income docs; deal must DSCR.
Hard money
10% down · 12.0% · 12mo
- Down + closing
- —
- Monthly P&I
- —
- Monthly cashflow
- —
- DSCR
- —
- Eligible?
- —
Short-term bridge; refi at stabilization.
Rent comps 40 comps
| Address | Beds | Baths | Sqft | Rent | $/sqft | DOM | Units | Dist |
|---|---|---|---|---|---|---|---|---|
| 3309 Southern Ave Unit 2 Baltimore, MD | 2.0 | 1.0 | 1200 | $1,500 | $1.25 | 0d | 1 | 0.18mi |
| 2911 Shirey Ave Baltimore, MD | 4.0 | 2.0 | 1680 | $2,500 | $1.49 | 22d | 1 | 0.21mi |
| 2807 Shirey Ave Baltimore, MD | 4.0 | 3.0 | 1190 | $2,500 | $2.10 | 17d | 1 | 0.25mi |
| 2900 Ailsa Ave Apt 2 Baltimore, MD | 3.0 | 1.0 | 1300 | $1,750 | $1.35 | 6d | 1 | 0.27mi |
| 3514 Ailsa Ave Baltimore, MD | 3.0 | 2.0 | 1800 | $2,200 | $1.22 | 45d | 1 | 0.39mi |
| 3802 Biddison Ln Baltimore, MD | 4.0 | 1.5 | 1443 | $2,024 | $1.40 | 13d | 1 | 0.62mi |
| 3721 Frankford Ave Baltimore, MD | 3.0 | 2.0 | 1600 | $2,050 | $1.28 | 45d | 1 | 0.68mi |
| 2805 Hamilton Ave Baltimore, MD | 4.0 | 2.0 | 1416 | $2,300 | $1.62 | 45d | 1 | 0.71mi |
| 5413 Pembroke Ave Baltimore, MD | 3.0 | 2.0 | 1350 | $1,895 | $1.40 | 0d | 1 | 0.73mi |
| 4007 Biddison Ln Apt 1 Baltimore, MD | 2.0 | 1.0 | 1000 | $1,279 | $1.28 | 20d | 1 | 0.79mi |
| 4023 Belwood Ave Baltimore, MD | 3.0 | 1.0 | 1080 | $1,995 | $1.85 | 45d | 1 | 0.80mi |
| 4104 Parkwood Ave Baltimore, MD | 3.0 | 1.0 | 1224 | $2,800 | $2.29 | 26d | 1 | 0.82mi |
| 5424 Belle Vista Ave Baltimore, MD | 2.0 | 1.0 | 932 | $1,300 | $1.39 | 45d | 1 | 0.85mi |
| 2077 Woodbourne Ave Baltimore, MD | 1.0–2.0 | 1.0 | 830 | $1,419 | $1.71 | 4d | 5 | 0.89mi |
| 3607 Bayonne Ave Unit 2 Baltimore, MD | 2.0 | 1.0 | 900 | $1,300 | $1.44 | 26d | 1 | 0.90mi |
| 2028 Hillenwood Rd Baltimore, MD | 4.0 | 2.0 | 1820 | $2,100 | $1.15 | 24d | 1 | 0.93mi |
| 4024 Eierman Ave Baltimore, MD | 3.0 | 2.0 | 1136 | $1,825 | $1.61 | 45d | 1 | 0.96mi |
| 4013 Eierman Ave Baltimore, MD | 3.0 | 1.0 | 1650 | $1,750 | $1.06 | 0d | 1 | 0.96mi |
| 4718 Blue Ridge Ave Baltimore, MD | 4.0 | 3.0 | 1744 | $2,400 | $1.38 | 13d | 1 | 1.03mi |
| 1804 Winford Rd Baltimore, MD | 3.0 | 1.5 | 1600 | $2,100 | $1.31 | 26d | 1 | 1.03mi |
| 4400 Asbury Ave Baltimore, MD | 3.0 | 2.0 | 1270 | $1,995 | $1.57 | 6d | 1 | 1.07mi |
| 5781 Edgepark Rd Baltimore, MD | 3.0 | 2.0 | 1568 | $1,975 | $1.26 | 18d | 1 | 1.09mi |
| 5632 Belair Rd Baltimore, MD | 3.0 | 1.5 | 1260 | $2,100 | $1.67 | 26d | 1 | 1.10mi |
| 1908 E Belvedere Ave Baltimore, MD | 4.0 | 2.0 | 1425 | $1,950 | $1.37 | 22d | 1 | 1.11mi |
| 2804 Christopher Ave Baltimore, MD | 3.0 | 2.5 | 1280 | $2,200 | $1.72 | 26d | 1 | 1.15mi |
| 1806 Ramblewood Rd Apt A Baltimore, MD | 2.0 | 2.0 | 903 | $1,847 | $2.05 | 45d | 1 | 1.16mi |
| 1575 Stonewood Rd Baltimore, MD | 3.0 | 1.5 | 1216 | $2,200 | $1.81 | 0d | 1 | 1.17mi |
| 4517 Woodlea Ave Baltimore, MD | 2.0 | 2.0 | 1326 | $1,900 | $1.43 | 5d | 1 | 1.18mi |
| 4320 Sheldon Ave Baltimore, MD | 3.0 | 1.5 | 1280 | $1,800 | $1.41 | 26d | 1 | 1.19mi |
| 1726 E Belvedere Ave Baltimore, MD | 3.0 | 2.0 | 1140 | $1,895 | $1.66 | 24d | 1 | 1.20mi |
| 1900 Ramblewood Rd Apt A Baltimore, MD | 2.0 | 2.0 | 903 | $1,847 | $2.05 | 45d | 1 | 1.20mi |
| 4409 Moravia Rd Baltimore, MD | 2.0 | 1.0 | 861 | $1,385 | $1.61 | 45d | 3 | 1.21mi |
| 1545 E Cold Spring Ln Baltimore, MD | 4.0 | 2.0 | 1240 | $2,000 | $1.61 | 45d | 1 | 1.23mi |
| 5926 Belle Vista Ave Baltimore, MD | 3.0 | 2.0 | 1248 | $2,250 | $1.80 | 0d | 1 | 1.23mi |
| 2735 Chesterfield Ave Baltimore, MD | 3.0 | 2.5 | 1536 | $2,000 | $1.30 | 13d | 1 | 1.23mi |
| 6212 Laurelton Ave Baltimore, MD | 2.0 | 1.0 | 960 | $1,325 | $1.38 | 45d | 1 | 1.23mi |
| 2106 Cloville Ave Baltimore, MD | 3.0 | 1.5 | 1080 | $1,700 | $1.57 | 45d | 1 | 1.23mi |
| 1543 Northwick Rd Unit 2 Baltimore, MD | 2.0 | 1.0 | 1160 | $1,100 | $0.95 | 0d | 1 | 1.24mi |
| 4308 Hamilton Ave Baltimore, MD | 2.0 | 1.0 | 1110 | $1,416 | $1.28 | 26d | 1 | 1.28mi |
| 1617 Argonne Dr Baltimore, MD | 4.0 | 2.0 | 1200 | $2,550 | $2.12 | 45d | 1 | 1.30mi |
Listing history 10 events
-
2026-06-13statusdays on market $199,900 Pending 11 DOM
-
2026-06-09days on market $199,900 Active 10 DOM
-
2026-06-08days on market $199,900 Active 9 DOM
-
2026-06-07days on market $199,900 Active 8 DOM
-
2026-06-04days on market $199,900 Active 5 DOM
-
2026-06-03days on market $199,900 Active 4 DOM
-
2026-06-02days on market $199,900 Active 3 DOM
-
2026-06-01days on market $199,900 Active 2 DOM
-
2026-05-31remarks 699-char remark
-
2026-05-31$199,900 Active 1 DOM
ⓘ Source: listings_history table (triggers on properties + properties_extension) + one-shot
backfill from property_details.listing_events for pre-trigger history.
Tax reassessment forecast MD · Partial reset (capped growth)
- Current annual tax
- $3,726 · $310/mo
- Projected year-2 tax
- $3,726 · $310/mo
- Expected delta
- $0/yr ($0/mo · 0.0%)
ⓘ Screening estimate from a state-policy table — verify with the county assessor before closing.
Climate risk First Street
- Flood 1/10 Low FEMA zone X (unshaded) · 0% chance over 30 yrs
- Wildfire 1/10 Low
- Heat 7/10 Severe 7 d/yr ≥103°F today · 14 d/yr by 30 yrs out
- Wind 6/10 Major 27% chance of damaging wind over 30 yrs
- Air quality 4/10 Moderate 6 unhealthy d/yr today · 7 by 30 yrs out
Nearby sold comps map
Loading sold comps map…
Walkable amenities ~0.75 mi
Loading nearby amenities…
Taxation est. · year 1
- Rental income
- $23,733
- − Mortgage interest
- −$11,198
- − Property taxes
- −$3,726
- − Insurance
- −$1,000
- − Repairs & maintenance
- −$1,899
- − Management
- −$1,899
- − Depreciation
- −$5,815
- Taxable loss
- −$1,803
- Est. tax savings @ 24.0%
- +$433
- After-tax cash flow
- $1,876/yr
For passive investors: Depreciation is non-cash, so a rental often shows a tax loss while cash-flowing — sheltering income. Rental losses are passive: they offset passive income freely, and up to $25,000/yr can offset ordinary (W-2) income if you actively participate and your MAGI is under $100k (phasing out to $0 by $150k); unused losses carry forward. On sale, claimed depreciation is recaptured at up to 25%, and gains may owe capital-gains tax (a 1031 exchange can defer both). Figures are a year-1 estimate at your 24.0% rate — not tax advice; consult a CPA.
Schools (NCES district)
- District
- Baltimore City Public Schools
- NCES district ID
- 2400090
- Math proficiency
- 7% ▼ -9.00%
- Reading proficiency
- 16% ▼ -5.00%
- Median HH income
- $42,108
- Composite
- 10.08/100
- National rank
- #9805
- State rank
- #24 of 24 in MD
Livability — Baltimore
- Score
- 76/100
- State rank
- #90
- US rank
- #3396
Category grades
Schools grade is shown separately in the Schools card above.
Census & demographics
- Census place
- Baltimore, MD
- County
- Baltimore City · 558,601 people
- City population
- 588,727
- Metro
- Baltimore-Columbia-Towson, MD
- Population (ZIP)
- 21,092
- Household income
- $86,366
- Rent vs Own
- Severe rent burden
- 432.0
Population outlook (Baltimore County) Hauer SSP2
- Today (2025)
- 624,249 people
- By 2030
- 621,541 · -0.4%
- By 2040
- 609,756 · -2.3%
- By 2050
- 597,249 · -4.3%
- By 2075
- 552,236 · -11.5%
- By 2100
- 513,934 · -17.7%
Race, ethnicity, and origin ACS 2023
- Neighborhood character
- Diverse neighborhood (Simpson 0.56)
- Race & ethnicity
- Black 58% White 33% Two or more races 6% Hispanic / Latino 3%
- Common ancestry
- Romanian 3% Italian 1% Lithuanian 1%
- Foreign-born
- 7% · Canada
- Languages at home
- 93% English-only · Spanish 3% French/Haitian/Cajun 1%
Political lean MEDSL · Baltimore
- 2024 margin
- Solid D (+73.0) · D 85.2% · R 12.2% · Other 2.6%
- 2008→2024 swing
- -2.5pp toward R · 2008: 75.5pp · 2024: 73.0pp
- All cycles
- 2024: D+73.0 2020: D+76.6 2016: D+74.6 2012: D+76.4 2008: D+75.5
Not yet ingested
- Civics
- —
Market trends
- HPI YoY
- ▼ -211.52%
- Current HPI
- 310.5637
- Rent YoY
- —
- Metro
- Baltimore-Columbia-Towson, MD
- State GDP YoY
- ▲ 2.97%
- F500 in state
- 12
Industry mix (Fortune 500 HQ in MD)
| Industry | F500 HQs | Revenue |
|---|---|---|
| Aerospace / Defense | 1 | $71B |
|
||
| Utilities | 1 | $25B |
|
||
| Hotels | 1 | $24B |
|
||
| Consumer Goods | 1 | $7B |
|
||
| Real Estate | 1 | $6B |
|
||
| Chemicals | 1 | $2B |
|
||
Price history
+303.8% since first listed40 events — show timeline
- 2026-05-30 Listed $199,900 BRIGHT MLS
- 2016-12-07 Sold (Public Records) $115,000 Public Records
- 2016-11-18 Sold (MLS) $115,000 MRIS
- 2016-11-18 Sold (MLS) $115,000 BRIGHT MLS
- 2016-09-25 Pending — MRIS
- 2016-07-12 Listed $119,000 MRIS
- 2016-05-01 Listing Removed — BRIGHT MLS
- 2016-05-01 Delisted — MRIS
- 2016-04-01 Relisted — MRIS
- 2016-04-01 Delisted — MRIS
- 2016-02-20 Price Changed — MRIS
- 2015-11-02 Relisted — MRIS
- 2015-10-19 Delisted — MRIS
- 2015-10-06 Relisted — MRIS
- 2015-10-04 Listed $119,000 BRIGHT MLS
- 2015-10-04 Listed — MRIS
- 2015-10-04 Delisted — MRIS
- 2012-02-28 Listing Removed — BRIGHT MLS
- 2012-02-28 Delisted — MRIS
- 2012-01-14 Price Changed — MRIS
- 2012-01-13 Relisted — MRIS
- 2012-01-11 Delisted — MRIS
- 2012-01-04 Price Changed — MRIS
- 2011-12-09 Price Changed — MRIS
- 2011-08-27 Listed — MRIS
- 2011-08-27 Listed $99,000 BRIGHT MLS
- 2005-03-01 Sold (MLS) $85,000 MRIS
- 2004-10-13 Delisted — MRIS
- 2004-05-21 Listed $85,000 MRIS
- 2003-11-30 Delisted — MRIS
- 2003-05-26 Listed — MRIS
- 1999-03-23 Sold (Public Records) $65,000 Public Records
- 1998-09-10 Sold (MLS) $65,000 MRIS
- 1998-07-09 Delisted — MRIS
- 1997-02-06 Listed $67,000 MRIS
- 1994-09-09 Delisted — MRIS
- 1994-09-09 Delisted — MRIS
- 1993-08-03 Listed — MRIS
- 1993-08-03 Listed — MRIS
- 1983-08-08 Sold (Public Records) $49,500 Public Records
Property tax history
+0.7%/yrLatest (2025): $3,726 · +8.1% YoY. Source: county tax records.
Cash-flow waterfall
monthlySold comps — $/sqft
last 12 mo · ≤1 miLoading sold comps…