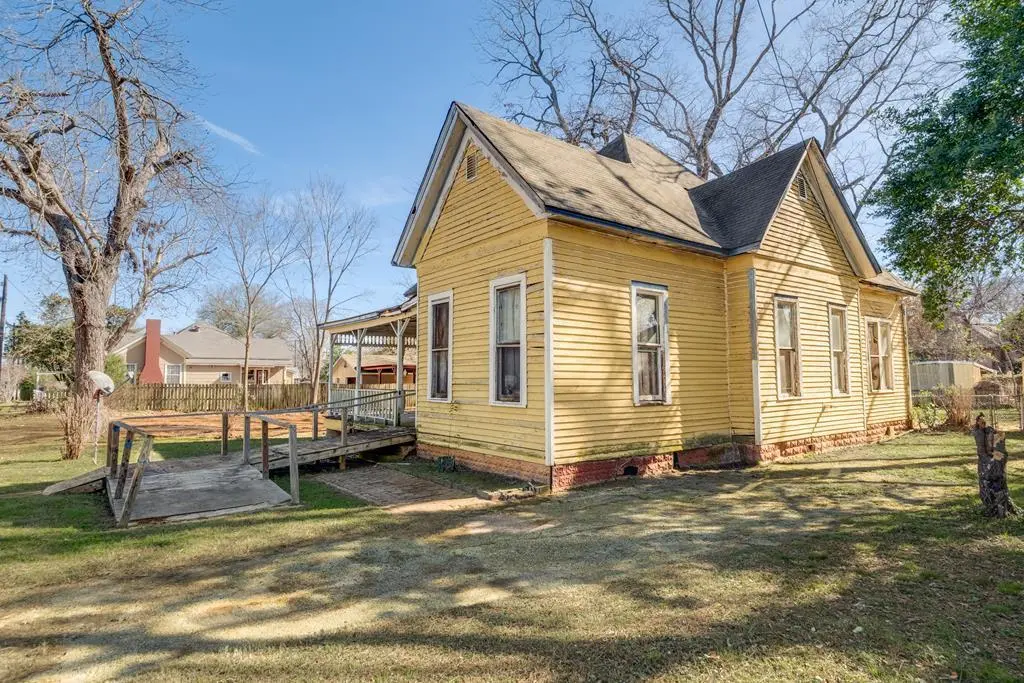
816 Louisiana St · Palestine, TX
Flood risk 1/10 · Minimal
- FEMA flood zone
- X (unshaded)
- Chance of flooding over 30 yrs
- 0.0%
- Est. flood insurance / yr
- $507 – $1,088
Fire risk 4/10 · Minor
- Est. fire insurance / yr
- $1,222 – $2,270
Heat risk 7/10 · Major
- Hot days now (above 111°F)
- 7 days/yr
- Hot days in 30 yrs
- 27 days/yr
Wind risk 6/10 · Moderate
- Chance of severe wind over 30 yrs
- 74.0%
Air-quality risk 1/10 · Minimal
- Unhealthy air days now
- 0 days/yr
- Unhealthy air days in 30 yrs
- 0 days/yr
Risk factors via First Street. Map © Google.
Why this score? — see what drove the B+ grade
The composite is a weighted blend of 9 inputs, each scored 0–100. Each bar is that input's sub-score; the figure is the points it added to the 100-point composite (weight × sub-score).
- Cash flow +30.0/30.0
- ARV discount +15.0/15.0
- 1% rule +10.0/10.0
- DSCR +10.0/10.0
- Livability +3.3/5.0
- Schools +3.0/10.0
- Rent growth +2.5/5.0
- Condition / age +2.5/5.0
- Appreciation +0.0/10.0
$75,000
🖨 Deal sheet 📄 Offer letter ✓ Due diligence
Listing remarks MLS
INVESTORS!!!!!!! Here is your opportunity to bring this diamond in the rough back to life. The home features hardwood floors, interior doorway molding, transom windows, tall ceilings and semi wrap around porch. A 2-bedroom, 1-bath, with formal living and dining room and utility area for a total of 1316 sqft. Located within walking distance to coffee shop, farmers market, dining and shopping all in downtown Palestine, Tx. Come put your skills to work and restore this beauty.
Key facts
- Transom windows
- Tall ceilings
- Hardwood floors
Tags
Neighborhood map
What this means for you Summary
Snapshot
- This is a 2-bed/1.0-bath single-family listed at $75k.
Deal economics
- At list price, monthly cash flow is $513 ($6k/yr) — positive.
- The deal already cash-flows at list — no discount required.
- Meets the 1% rule at list price ($1k rent vs $75k).
- Recommended offer: $66k (12.0% below list) — sets the bar for market timing.
- Cap rate 14.5% vs local median 3.9% in Palestine — top-decile yield for the area; either an underpriced asset or a hidden risk that comps aren't pricing in. Stress-test before assuming the spread holds.
Location & tenants
- Location reads 66/100 on livability (#657 in TX) — a middle-class / working-renter tenant base. Strengths: cost of living A+, housing A+; Watch: crime D+, schools D, employment D.
- Palestine ISD (town): math 36% / reading 37% proficiency, ranked #509 of 826 in TX (top 62%) — families likely to look elsewhere, expect single-tenant / working-renter base with shorter leases; 67% free/reduced lunch — lower-income household profile, screen leases tightly.
- Market conditions: 196 active listings in the ZIP; 29 units permitted in Anderson County in 2024 (0 in 5+ unit buildings).
Forward outlook
- Local home prices are declining (-3.0%/yr); year-one equity from $519 of loan paydown is wiped out by about $2k of value loss. Plan a longer hold.
- Anderson County population projected at +4% by 2050 — modest demand growth; plan on rents tracking national, not racing it.
- At projected returns (-3.0% appreciation + 3.0% rent growth), your $21k cash investment doubles in ~5 years — after that, you're playing with house money.
Negotiation context
- It's been on market 148 days — a 12% lower offer ($66k) is reasonable based on typical stale-listing flexibility.
- 2 sale attempts; this cycle's ask has dropped $5k (6%) from the opening price — seller is motivated, your offer sets the floor, not the list.
Risks & watch-outs
- Watch-outs: built in 1900 — expect roof / HVAC / electrical / plumbing capex.
- Climate carrying-cost: major wind risk, 74% chance of damaging wind over 30y; extreme-heat days projected 7→27/yr by 2055 (HVAC capex compounding) — expect insurance premiums to compound above CPI over the hold.
Questions for the listing agent
- It's been on market 148 days. Have you received any prior offers? Is the seller open to a 12% concession, seller financing, or rate buy-down credit?
- Built in 1900 — when were the roof, HVAC, electrical panel, plumbing, and water heater last replaced?
- Why hasn't it sold? Are there any deal-killer items the seller is aware of (foundation, flood, title, zoning, code violations)?
- Is there a deadline driving the sale (1031 exchange, divorce, estate, relocation)? That informs how much negotiation room exists.
- Schools are D-rated, which usually means shorter tenancies and higher turnover. Who's the typical renter profile here, and what's been the actual vacancy rate?
- Crime grade is D in this area — have there been break-ins, vandalism, or insurance claims at this property in the last 3 years? What carrier currently insures it and at what premium?
- What's the average days-on-market for RENTAL listings here right now (not sales)? A rising rental-DOM trend means longer vacancies and softer asking-rent achievability than the comps imply.
- What's the recent tenant-quality profile in this submarket — average credit score on applications, eviction rate, late-payment / NSF rate, and stable-employment percentage? A property-management company in the area should have these aggregated.
- How much new for-sale + rental construction is in the pipeline within 1–3 miles? Heavy new supply typically softens prices + rents 12–24 months out; constrained supply supports both.
Investment metrics
- 1% rule
- 1.72% ✓
- Cap rate
- 14.50%
- Cash-on-cash
- 29.30%
- DSCR
- 2.30
- GRM
- 4.8
CMA / ARV
- ARV (median comp)
- $139,943
- List price
- $75,000
- Delta
- -46.41%
- Verdict
- UNDERPRICED
- Comps
- 13 within 1.0 mi
Show comp detail 2 sales within ~0.75 mi
| Address | Dist | Beds/Ba | Sqft | Sold | Price | $/sf | Match |
|---|---|---|---|---|---|---|---|
| 1105 N Sycamore St | 0.49mi | 2/1.0 | 1,251 (-5%) | 8mo | $174,500 | $139 | 62 |
| 1019 N Cedar St | 0.59mi | 3/2.0 (+1) | 1,513 (+15%) | 19mo | $224,900 | $149 | 23 |
Match score weights: distance 35% · size 25% · config 20% · recency 20%. Top-matched comps best support the ARV.
Projected returns pro-forma
-3.0% appreciation · 3.0% rent growth · sell at horizon
- IRR
- 23.7%
- Equity multiple
- 1.98×
- Total profit
- $20,513
- Equity at exit
- $11,183
- IRR
- 31.6%
- Equity multiple
- 3.86×
- Total profit
- $59,960
- Equity at exit
- $6,485
Cash invested: $21,000 (down + closing). Projections, not guarantees.
Landlord ↔ Tenant lean methodology
- Overall (STATE)
- 87 Strongly Landlord-Friendly
- State Texas
- 87 Strongly Landlord-Friendly · R+5
- County
- — inherits STATE
- City
- — inherits STATE
ZIP-level market 75801
- Home prices YoY
- -35.0%
- Active inventory
- 196
- Price-to-rent
- 4.8×
Monthly cashflow live
- Estimated rent
- $1,291 medium interval (Pro) →
- Mortgage (P&I)
- −$393
- Tax from tax record
- −$83 /mo · $992/yr
- Insurance
- −$31
- HOA
- −$0
- Vacancy / Maint / Mgmt
- −$271
- Net cashflow
- $513
Break-even live
UW: 25.0% down · 7.5% · 30yr · 1.5% tax · 5.0% vac · 8.0% maint · 8.0% mgmt
Financing live
Cash to close
- Down payment
- $18,750
- Closing costs
- $2,250
- Reserves months
- —
- Total cash needed
- —
Loan-product check · same deal, 3 products live
Conventional
25% down · 7.5% · 30yr
- Down + closing
- —
- Monthly P&I
- —
- Monthly cashflow
- —
- DSCR
- —
- Eligible?
- —
Personal DTI + credit; lowest rate.
DSCR
20% down · 8.5% · 30yr
- Down + closing
- —
- Monthly P&I
- —
- Monthly cashflow
- —
- DSCR
- —
- Eligible?
- —
No personal income docs; deal must DSCR.
Hard money
10% down · 12.0% · 12mo
- Down + closing
- —
- Monthly P&I
- —
- Monthly cashflow
- —
- DSCR
- —
- Eligible?
- —
Short-term bridge; refi at stabilization.
Listing history 19 events
-
2026-06-19days on market $75,000 Active 148 DOM
-
2026-06-18days on market $75,000 Active 147 DOM
-
2026-06-17days on market $75,000 Active 146 DOM
-
2026-06-16days on market $75,000 Active 145 DOM
-
2026-06-15days on market $75,000 Active 144 DOM
-
2026-06-14days on market $75,000 Active 142 DOM
-
2026-06-12days on market $75,000 Active 141 DOM
-
2026-06-09days on market $75,000 Active 138 DOM
-
2026-06-09price $75,000 Active 137 DOM
-
2026-06-08days on market $80,000 Active 137 DOM
-
2026-06-07days on market $80,000 Active 136 DOM
-
2026-06-04days on market $80,000 Active 132 DOM
-
2026-06-02days on market $80,000 Active 131 DOM
-
2026-06-01days on market $80,000 Active 130 DOM
-
2026-05-31days on market $80,000 Active 129 DOM
-
2026-05-31days on market $80,000 Active 128 DOM
-
2026-02-20$80,000 Active 478-char remark
Show marketing remark (478 chars)
INVESTORS!!!!!!! Here is your opportunity to bring this diamond in the rough back to life. The home features hardwood floors, interior doorway molding, transom windows, tall ceilings and semi wrap around porch. A 2-bedroom, 1-bath, with formal living and dining room and utility area for a total of 1316 sqft. Located within walking distance to coffee shop, farmers market, dining and shopping all in downtown Palestine, Tx. Come put your skills to work and restore this beauty.
-
2026-01-22$80,000 Active 649-char remark
Show marketing remark (649 chars)
Investors, are you looking for your next project? Here is your opportunity to bring this charming historical beauty back to life. Fix and flip or keep and use for rental income. The home features hardwood floors, interior doorway molding, transom windows, tall ceilings and semi wrap around porch. A 2-bedroom, 1-bath, with formal living and dining room and utility area for a total of 1316 sqft. Located within walking distance to coffee shop, farmers market, dining and shopping all in downtown Palestine, Tx. Whether you're looking for income producing property or a flip, this is a must see. Come put your skills to work and restore this beauty.
-
1994-10-06soldstatus
ⓘ Source: listings_history table (triggers on properties + properties_extension) + one-shot
backfill from property_details.listing_events for pre-trigger history.
Tax reassessment forecast TX · Resets to sale price
- Current annual tax
- $992 · $83/mo
- Projected year-2 tax
- $1,372 · $114/mo
- Expected delta
- +$380/yr (+$32/mo · 38.4%)
ⓘ Screening estimate from a state-policy table — verify with the county assessor before closing.
Climate risk First Street
- Flood 1/10 Low FEMA zone X (unshaded) · 0% chance over 30 yrs
- Wildfire 4/10 Moderate
- Heat 7/10 Severe 7 d/yr ≥111°F today · 27 d/yr by 30 yrs out
- Wind 6/10 Major 74% chance of damaging wind over 30 yrs
- Air quality 1/10 Low 0 unhealthy d/yr today · 0 by 30 yrs out
Nearby sold comps map
Loading sold comps map…
Walkable amenities ~0.75 mi
Loading nearby amenities…
Taxation est. · year 1
- Rental income
- $15,492
- − Mortgage interest
- −$4,201
- − Property taxes
- −$992
- − Insurance
- −$375
- − Repairs & maintenance
- −$1,239
- − Management
- −$1,239
- − Depreciation
- −$2,182
- Taxable income
- $5,264
- Est. tax owed @ 24.0%
- −$1,263
- After-tax cash flow
- $4,889/yr
For passive investors: Depreciation is non-cash, so a rental often shows a tax loss while cash-flowing — sheltering income. Rental losses are passive: they offset passive income freely, and up to $25,000/yr can offset ordinary (W-2) income if you actively participate and your MAGI is under $100k (phasing out to $0 by $150k); unused losses carry forward. On sale, claimed depreciation is recaptured at up to 25%, and gains may owe capital-gains tax (a 1031 exchange can defer both). Figures are a year-1 estimate at your 24.0% rate — not tax advice; consult a CPA.
Schools (NCES district)
- District
- Palestine ISD
- NCES district ID
- 4834050
- Math proficiency
- 36% ▼ -12.00%
- Reading proficiency
- 37% ▼ -1.00%
- Median HH income
- $36,881
- Composite
- 30.34/100
- National rank
- #6267
- State rank
- #509 of 826 in TX
Livability — Palestine
- Score
- 66/100
- State rank
- #657
- US rank
- #12357
Category grades
Schools grade is shown separately in the Schools card above.
Census & demographics
- Census place
- Palestine, TX
- County
- Anderson County · 17,531 people
- City population
- 17,531
- Metro
- Palestine, TX
- Population (ZIP)
- 17,531
- Household income
- $56,787
- Rent vs Own
- Severe rent burden
- 609.0
Population outlook (Anderson County) Hauer SSP2
- Today (2025)
- 56,663 people
- By 2030
- 57,373 · +1.3%
- By 2040
- 58,960 · +4.1%
- By 2050
- 59,073 · +4.3%
- By 2075
- 53,737 · -5.2%
- By 2100
- 42,516 · -25.0%
Race, ethnicity, and origin ACS 2023
- Neighborhood character
- Diverse neighborhood (Simpson 0.67)
- Race & ethnicity
- White 48% Black 27% Hispanic / Latino 17% Two or more races 15% Native American 3%
- Hispanic origin (detail)
- Mexican 12%
- Common ancestry
- Lithuanian 2% Iranian 1% Slovak 1%
- Foreign-born
- 8% · Canada
- Languages at home
- 85% English-only · Spanish 12%
Political lean MEDSL · Anderson
- 2024 margin
- Solid R (+61.8) · D 18.8% · R 80.6%
- 2008→2024 swing
- -18.3pp toward R · 2008: -43.5pp · 2024: -61.8pp
- All cycles
- 2024: R+61.8 2020: R+58.0 2016: R+58.1 2012: R+52.2 2008: R+43.5
Not yet ingested
- Civics
- —
Market trends
- HPI YoY
- ▼ -83.17%
- Current HPI
- 154.6138
- Rent YoY
- —
- Metro
- Palestine, TX
- State GDP YoY
- ▲ 3.95%
- F500 in state
- 110
Industry mix (Fortune 500 HQ in TX)
| Industry | F500 HQs | Revenue |
|---|---|---|
| Energy | 16 | $1,198B |
|
||
| Technology | 5 | $198B |
|
||
| Engineering / Construction | 4 | $72B |
|
||
| Energy Services | 3 | $60B |
|
||
| Utilities | 3 | $41B |
|
||
| Healthcare | 2 | $330B |
|
||
Price history
+0.0% since first listed3 events — show timeline
- 2026-02-20 Listed $80,000 GTAR
- 2026-01-22 Listed $80,000 PAOR
- 1994-10-06 Sold (Public Records) — Public Records
Property tax history
+6.1%/yrLatest (2025): $992 · +45.8% YoY. Source: county tax records.
Cash-flow waterfall
monthlySold comps — $/sqft
last 12 mo · ≤1 miLoading sold comps…