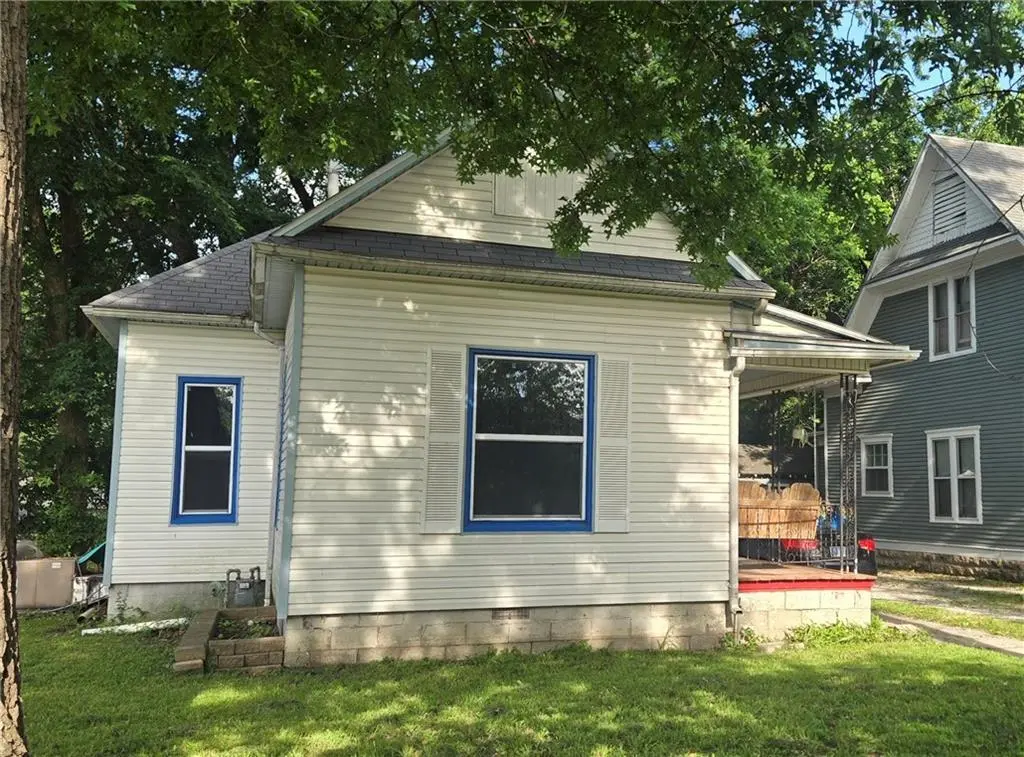
1704 N Elm St · Pittsburg, KS
Flood risk 1/10 · Minimal
- FEMA flood zone
- X (unshaded)
- Chance of flooding over 30 yrs
- 0.0%
- Est. flood insurance / yr
- $507 – $1,088
Fire risk 3/10 · Minor
- Est. fire insurance / yr
- $1,154 – $2,142
Heat risk 5/10 · Moderate
- Hot days now (above 108°F)
- 7 days/yr
- Hot days in 30 yrs
- 19 days/yr
Wind risk 2/10 · Minimal
- Chance of severe wind over 30 yrs
- 2.0%
Air-quality risk 2/10 · Minimal
- Unhealthy air days now
- 1 days/yr
- Unhealthy air days in 30 yrs
- 1 days/yr
Risk factors via First Street. Map © Google.
Why this score? — see what drove the C grade
The composite is a weighted blend of 9 inputs, each scored 0–100. Each bar is that input's sub-score; the figure is the points it added to the 100-point composite (weight × sub-score).
- Cash flow +24.7/30.0
- DSCR +8.0/10.0
- 1% rule +5.7/10.0
- Rent growth +5.0/5.0
- ARV discount +4.3/15.0
- Livability +3.3/5.0
- Schools +2.5/10.0
- Condition / age +2.5/5.0
- Appreciation +0.0/10.0
$99,900
🖨 Deal sheet 📄 Offer letter ✓ Due diligence
Key facts
- Central heat and air
- Front porch
- Insulated windows
Tags
Property features AI
Finance
- Other: Living area reported as 924 (above grade); Age: 101 years or more
- HOA & community: No association fees
Exterior
- Parking: Other parking
- Utilities: Public water; Public sewer
- Home design: Single-family residence (Residential); Bungalow style; Faces west; One story (main level living)
- Construction: Vinyl siding; Composition roof
- Exterior features: Lot approximately 50 x 170 (8,500 sq ft); Not in a flood plain; Directions: From 20th and Broadway go East to Elm and then turn South. Home will be 3 blocks down on the East side.
Interior
- Kitchen: Electric range; Dishwasher
- Bedrooms: 3 bedrooms (all on the main level)
- Flooring: Carpet in some rooms; Ceramic tile in bathroom; Vinyl in utility room
- Bathrooms: 1 full bathroom (main level)
- Heating & cooling: Natural gas heating; Electric cooling (has cooling)
- Interior features: Bungalow floor plan; Basement: Other
- Laundry & utility: Utility room on main level with vinyl flooring
Neighborhood map
What this means for you Summary
Snapshot
- This is a 3-bed/1.0-bath single-family listed at $100k.
Deal economics
- At list price, monthly cash flow is $208 ($2k/yr) — positive.
- The deal already cash-flows at list — no discount required.
- Meets the 1% rule at list price ($1k rent vs $100k).
- Recommended offer: $98k (1.5% below list) — sets the bar for market timing.
- Cap rate 8.8% vs local median 5.4% in Pittsburg — top-decile yield for the area; either an underpriced asset or a hidden risk that comps aren't pricing in. Stress-test before assuming the spread holds.
Location & tenants
- Location reads 66/100 on livability (#270 in KS) — a middle-class / working-renter tenant base. Strengths: cost of living A+, housing A, health & safety A; Watch: schools D, crime F, amenities F.
- Pittsburg (town): math 29% / reading 31% proficiency, ranked #111 of 169 in KS (top 66%) — families likely to look elsewhere, expect single-tenant / working-renter base with shorter leases.
- Market conditions: Rents rising fast (+13.8%/yr); 139 active listings in the ZIP; 1 comparable units currently listed for rent nearby; 65 units permitted in Crawford County in 2024 (0 in 5+ unit buildings).
Forward outlook
- Local home prices are declining (-3.0%/yr); year-one equity from $691 of loan paydown is wiped out by about $3k of value loss. Plan a longer hold.
- At projected returns (-3.0% appreciation + 8.0% rent growth), your $28k cash investment doubles in ~8 years — after that, you're playing with house money.
Negotiation context
- It's been on market 20 days — a 2% lower offer ($98k) is reasonable based on typical stale-listing flexibility.
- Current owner paid $28k; list at $100k implies a 257% gain — meaningful room to come down on a strong offer.
Risks & watch-outs
- Watch-outs: built in 1920 — expect roof / HVAC / electrical / plumbing capex.
- Climate carrying-cost: extreme-heat days projected 7→19/yr by 2055 (HVAC capex compounding) — expect insurance premiums to compound above CPI over the hold.
Questions for the listing agent
- Built in 1920 — when were the roof, HVAC, electrical panel, plumbing, and water heater last replaced?
- Is there a deadline driving the sale (1031 exchange, divorce, estate, relocation)? That informs how much negotiation room exists.
- Schools are D-rated, which usually means shorter tenancies and higher turnover. Who's the typical renter profile here, and what's been the actual vacancy rate?
- Crime grade is F in this area — have there been break-ins, vandalism, or insurance claims at this property in the last 3 years? What carrier currently insures it and at what premium?
- What's the average days-on-market for RENTAL listings here right now (not sales)? A rising rental-DOM trend means longer vacancies and softer asking-rent achievability than the comps imply.
- What's the recent tenant-quality profile in this submarket — average credit score on applications, eviction rate, late-payment / NSF rate, and stable-employment percentage? A property-management company in the area should have these aggregated.
- How much new for-sale + rental construction is in the pipeline within 1–3 miles? Heavy new supply typically softens prices + rents 12–24 months out; constrained supply supports both.
Investment metrics
- 1% rule
- 1.07% ✓
- Cap rate
- 8.79%
- Cash-on-cash
- 8.93%
- DSCR
- 1.40
- GRM
- 7.8
CMA / ARV
- ARV (on-the-fly)
- $93,324
- Comps found
- 12
Show comp detail 12 sales within ~0.75 mi
| Address | Dist | Beds/Ba | Sqft | Sold | Price | $/sf | Match |
|---|---|---|---|---|---|---|---|
| 1503 N Joplin St | 0.15mi | 2/1.0 (-1) | 912 (-1%) | 8mo | $93,000 | $102 | 79 |
| 210 W 18th St | 0.30mi | 2/1.0 (-1) | 924 (0%) | 10mo | $93,000 | $101 | 73 |
| 401 E 22 St | 0.32mi | 2/1.0 (-1) | 888 (-4%) | 7mo | $72,500 | $82 | 68 |
| 211 E 22nd St | 0.31mi | 2/1.0 (-1) | 896 (-3%) | 13mo | $105,000 | $117 | 65 |
| 611 E 21st St | 0.42mi | 3/1.0 | 984 (+6%) | 11mo | $35,000 | $36 | 60 |
| 109 W 22nd St | 0.38mi | 2/1.0 (-1) | 816 (-12%) | 0mo | $50,000 | $61 | 57 |
| 612 E 10th N/A | 0.52mi | 3/1.0 | 868 (-6%) | 12mo | $59,900 | $69 | 56 |
| 124 W 10th St | 0.49mi | 2/1.0 (-1) | 844 (-9%) | 4mo | $78,500 | $93 | 55 |
| 102 W 21st St | 0.33mi | 2/1.0 (-1) | 800 (-13%) | 11mo | $89,000 | $111 | 48 |
| 902 E 10th St | 0.75mi | 2/1.5 (-1) | 914 (-1%) | 14mo | $115,000 | $126 | 45 |
| 509 E 24th St | 0.50mi | 2/1.0 (-1) | 812 (-12%) | 14mo | $50,000 | $62 | 40 |
| 510 E 9th St | 0.55mi | 2/2.0 (-1) | 1,055 (+14%) | 10mo | $130,000 | $123 | 33 |
Match score weights: distance 35% · size 25% · config 20% · recency 20%. Top-matched comps best support the ARV.
Projected returns pro-forma
-3.0% appreciation · 8.0% rent growth · sell at horizon
- IRR
- 2.4%
- Equity multiple
- 1.10×
- Total profit
- $2,712
- Equity at exit
- $14,895
- IRR
- 16.1%
- Equity multiple
- 2.61×
- Total profit
- $45,120
- Equity at exit
- $8,638
Cash invested: $27,972 (down + closing). Projections, not guarantees.
Landlord ↔ Tenant lean methodology
- Overall (STATE)
- 83 Strongly Landlord-Friendly
- State Kansas
- 83 Strongly Landlord-Friendly · R+10
- County
- — inherits STATE
- City
- — inherits STATE
ZIP-level market 66762
- Rents YoY
- 13.8%
- Active inventory
- 139
- Price-to-rent
- 7.8×
Monthly cashflow live
- Estimated rent
- $1,071 medium interval (Pro) →
- Mortgage (P&I)
- −$524
- Tax from tax record
- −$72 /mo · $866/yr
- Insurance
- −$42
- HOA
- −$0
- Vacancy / Maint / Mgmt
- −$225
- Net cashflow
- $208
Break-even live
UW: 25.0% down · 7.5% · 30yr · 1.5% tax · 5.0% vac · 8.0% maint · 8.0% mgmt
Financing live
Cash to close
- Down payment
- $24,975
- Closing costs
- $2,997
- Reserves months
- —
- Total cash needed
- —
Loan-product check · same deal, 3 products live
Conventional
25% down · 7.5% · 30yr
- Down + closing
- —
- Monthly P&I
- —
- Monthly cashflow
- —
- DSCR
- —
- Eligible?
- —
Personal DTI + credit; lowest rate.
DSCR
20% down · 8.5% · 30yr
- Down + closing
- —
- Monthly P&I
- —
- Monthly cashflow
- —
- DSCR
- —
- Eligible?
- —
No personal income docs; deal must DSCR.
Hard money
10% down · 12.0% · 12mo
- Down + closing
- —
- Monthly P&I
- —
- Monthly cashflow
- —
- DSCR
- —
- Eligible?
- —
Short-term bridge; refi at stabilization.
Rent comps 1 comps
| Address | Beds | Baths | Sqft | Rent | $/sqft | DOM | Units | Dist |
|---|---|---|---|---|---|---|---|---|
| 511 W 2nd St Pittsburg, KS | 2.0 | 1.0 | 846 | $850 | $1.00 | 43d | 1 | 1.12mi |
Listing history 21 events
-
2026-06-17status $99,900 Pending 20 DOM
-
2026-06-17days on market $99,900 Active 20 DOM
-
2026-06-16days on market $99,900 Active 19 DOM
-
2026-06-15days on market $99,900 Active 18 DOM
-
2026-06-14days on market $99,900 Active 16 DOM
-
2026-06-13days on market $99,900 Active 15 DOM
-
2026-06-10days on market $99,900 Active 13 DOM
-
2026-06-09days on market $99,900 Active 12 DOM
-
2026-06-08days on market $99,900 Active 11 DOM
-
2026-06-07days on market $99,900 Active 10 DOM
-
2026-06-05days on market $99,900 Active 7 DOM
-
2026-06-03days on market $99,900 Active 6 DOM
-
2026-06-02days on market $99,900 Active 5 DOM
-
2026-06-01days on market $99,900 Active 4 DOM
-
2026-05-31days on market $99,900 Active 3 DOM
-
2026-05-30days on market $99,900 Active 2 DOM
-
2026-05-28$99,900 Active
-
2022-03-18soldstatus
-
1999-04-01soldstatus $28,000
-
1993-09-01soldstatus $20,000
-
1986-04-01soldstatus
ⓘ Source: listings_history table (triggers on properties + properties_extension) + one-shot
backfill from property_details.listing_events for pre-trigger history.
Tax reassessment forecast KS · Resets to sale price
- Current annual tax
- $866 · $72/mo
- Projected year-2 tax
- $1,409 · $117/mo
- Expected delta
- +$543/yr (+$45/mo · 62.7%)
ⓘ Screening estimate from a state-policy table — verify with the county assessor before closing.
Climate risk First Street
- Flood 1/10 Low FEMA zone X (unshaded) · 0% chance over 30 yrs
- Wildfire 3/10 Moderate
- Heat 5/10 Major 7 d/yr ≥108°F today · 19 d/yr by 30 yrs out
- Wind 2/10 Low 2% chance of damaging wind over 30 yrs
- Air quality 2/10 Low 1 unhealthy d/yr today · 1 by 30 yrs out
Nearby sold comps map
Loading sold comps map…
Walkable amenities ~0.75 mi
Loading nearby amenities…
Taxation est. · year 1
- Rental income
- $12,848
- − Mortgage interest
- −$5,596
- − Property taxes
- −$866
- − Insurance
- −$500
- − Repairs & maintenance
- −$1,028
- − Management
- −$1,028
- − Depreciation
- −$2,906
- Taxable income
- $925
- Est. tax owed @ 24.0%
- −$222
- After-tax cash flow
- $2,276/yr
For passive investors: Depreciation is non-cash, so a rental often shows a tax loss while cash-flowing — sheltering income. Rental losses are passive: they offset passive income freely, and up to $25,000/yr can offset ordinary (W-2) income if you actively participate and your MAGI is under $100k (phasing out to $0 by $150k); unused losses carry forward. On sale, claimed depreciation is recaptured at up to 25%, and gains may owe capital-gains tax (a 1031 exchange can defer both). Figures are a year-1 estimate at your 24.0% rate — not tax advice; consult a CPA.
Schools (NCES district)
- District
- Pittsburg
- NCES district ID
- 2010710
- Math proficiency
- 29% ▼ -5.00%
- Reading proficiency
- 31% ▼ -4.00%
- Median HH income
- $33,608
- Composite
- 24.63/100
- National rank
- #7629
- State rank
- #111 of 169 in KS
Livability — Pittsburg
- Score
- 66/100
- State rank
- #270
- US rank
- #12149
Category grades
Schools grade is shown separately in the Schools card above.
Census & demographics
- Census place
- Pittsburg, KS
- County
- Crawford County · 24,907 people
- City population
- 24,907
- Metro
- Pittsburg, KS
- Population (ZIP)
- 24,907
- Household income
- $50,511
- Rent vs Own
- Severe rent burden
- 1186.0
Population outlook (Crawford County) Hauer SSP2
- Today (2025)
- 39,393 people
- By 2030
- 39,540 · +0.4%
- By 2040
- 39,452 · +0.1%
- By 2050
- 39,188 · -0.5%
- By 2075
- 39,038 · -0.9%
- By 2100
- 38,219 · -3.0%
Race, ethnicity, and origin ACS 2023
- Neighborhood character
- Predominantly White (80%)
- Race & ethnicity
- White 80% Hispanic / Latino 10% Two or more races 5% Asian 2% Black 2%
- Hispanic origin (detail)
- Mexican 7%
- Common ancestry
- Slovak 2% Lithuanian 2% Italian 2%
- Foreign-born
- 5% · Canada, China
- Languages at home
- 92% English-only · Spanish 6% Other Asian/Pacific 1%
Political lean MEDSL · Crawford
- 2024 margin
- Strong R (+25.3) · D 36.5% · R 61.7% · Other 1.8%
- 2008→2024 swing
- -26.7pp toward R · 2008: 1.4pp · 2024: -25.3pp
- All cycles
- 2024: R+25.3 2020: R+23.1 2016: R+23.1 2012: R+6.5 2008: D+1.4
Not yet ingested
- Civics
- —
Market trends
- HPI YoY
- ▼ -171.14%
- Current HPI
- 158.7878
- Rent YoY
- ▲ 13.80%
- Metro
- Pittsburg, KS
- State GDP YoY
- —
- F500 in state
- 0
Price history
+399.5% since first listed5 events — show timeline
- 2026-05-28 Listed $99,900 Heartland MLS as Distributed by MLS Grid
- 2022-03-18 Sold (Public Records) — Public Records
- 1999-04-01 Sold (Public Records) $28,000 Public Records
- 1993-09-01 Sold (Public Records) $20,000 Public Records
- 1986-04-01 Sold (Public Records) — Public Records
Property tax history
+2.4%/yrLatest (2025): $866 · +6.5% YoY. Source: county tax records.
Cash-flow waterfall
monthlySold comps — $/sqft
last 12 mo · ≤1 miLoading sold comps…