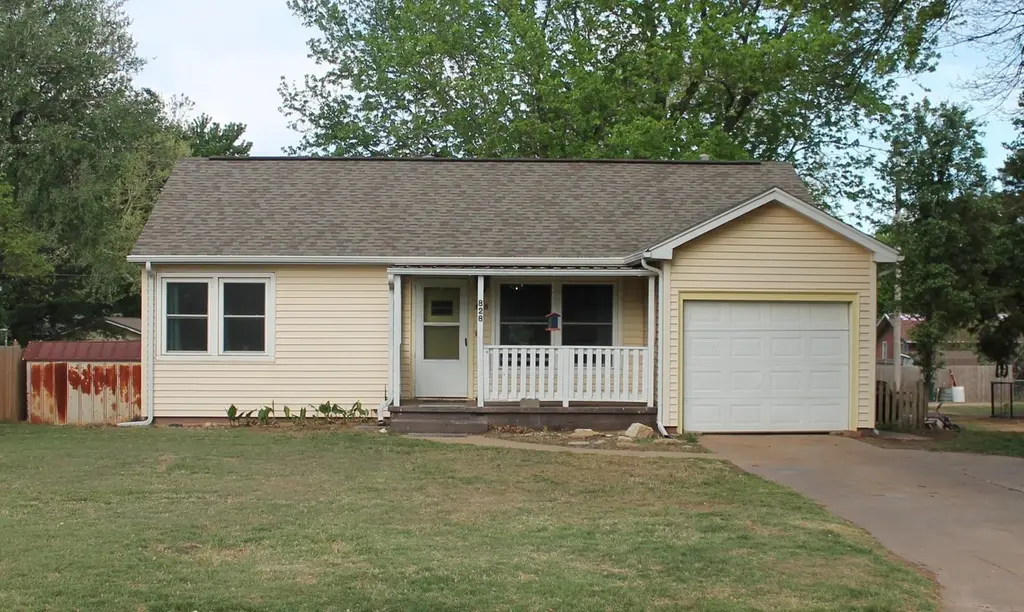
828 N Anthony Ave · Anthony, KS
Flood risk 1/10 · Minimal
- FEMA flood zone
- —
- Chance of flooding over 30 yrs
- 0.0%
- Est. flood insurance / yr
- —
Fire risk 5/10 · Moderate
- Est. fire insurance / yr
- $1,154 – $2,142
Heat risk 5/10 · Moderate
- Hot days now (above 107°F)
- 6 days/yr
- Hot days in 30 yrs
- 16 days/yr
Wind risk 2/10 · Minimal
- Chance of severe wind over 30 yrs
- 1.0%
Air-quality risk 1/10 · Minimal
- Unhealthy air days now
- 0 days/yr
- Unhealthy air days in 30 yrs
- 0 days/yr
Risk factors via First Street. Map © Google.
Why this score? — see what drove the D grade
The composite is a weighted blend of 9 inputs, each scored 0–100. Each bar is that input's sub-score; the figure is the points it added to the 100-point composite (weight × sub-score).
- Cash flow +10.5/30.0
- ARV discount +7.5/15.0
- Appreciation +6.9/10.0
- Livability +3.4/5.0
- 1% rule +3.2/10.0
- DSCR +3.0/10.0
- Rent growth +2.5/5.0
- Schools +2.5/10.0
- Condition / age +2.5/5.0
$120,000
🖨 Deal sheet 📄 Offer letter ✓ Due diligence
Key facts
- Bonus family room
- Finished basement
- Formal dining area
Tags
Property features AI
Exterior
- Parking: 1-car garage
- Utilities: Public water; Sewer available; Natural gas available
- Home design: Single-family onsite-built home; One level
- Construction: Composition roof; Full daylight foundation
- Exterior features: One-story; Chain link fencing
Interior
- Kitchen: Dishwasher; Range
- Bathrooms: One full bathroom; One half bathroom
- Heating & cooling: Central air conditioning (electric); Forced air heating (natural gas)
- Interior features: Finished basement
- Laundry & utility: Laundry in basement; 220V outlet for laundry/large appliances
Neighborhood map
What this means for you Summary
Snapshot
- This is a 4-bed/1.5-bath single-family listed at $120k.
Deal economics
- At list price, monthly cash flow is $-62 ($-741/yr) — negative.
- To cash-flow at today's rent, offer at most $109k (9.1% below list).
- To meet the 1% rule (rent ≥ 1% of price), the offer needs to be $98k (18.1% below list).
- Recommended offer: $98k (18.1% below list) — sets the bar for 1% rule.
Location & tenants
- Location reads 68/100 on livability (#228 in KS) — a middle-class / working-renter tenant base. Strengths: cost of living A+, housing A+, health & safety A+; Watch: crime D+, amenities F, commute F.
- Chaparral Schools (rural): math 29% / reading 29% proficiency, ranked #110 of 169 in KS (top 65%) — low school quality limits family demand, transient renter base, plan for 1-2y turnover.
- Zoned schools: Anthony Elem (math 42% / reading 42%, grade F, #273 of 684 statewide, top 45%, 210 students, 71% FRL); Chaparral Jr/Sr High (math 12% / reading 17%, grade F, #267 of 327 statewide, top 84%, 350 students, 64% FRL) — zoned schools average 68% FRL vs 52% district-wide (16 pts higher); higher-poverty schools than district average — tighter screening recommended.
- Market conditions: 16 active listings in the ZIP; 6 units permitted in Harper County in 2024 (0 in 5+ unit buildings).
Forward outlook
- In year one you build about $5k of equity ($830 loan paydown + $5k appreciation (3.8% local appreciation)).
- Harper County population projected at -14% by 2050 — secular population decline; favor cash flow + early exit over multi-decade hold.
- At projected returns (3.8% appreciation + 3.0% rent growth), your $34k cash investment doubles in ~6 years — after that, you're playing with house money.
- By year 7, paydown + projected appreciation supports a ~$34k cash-out refi (75% LTV) — recoverable capital for the next deal without selling this one.
Negotiation context
- It's been on market 63 days — a 6% lower offer ($113k) is reasonable based on typical stale-listing flexibility.
- 5 sale attempts since 5y ago with the ask held roughly flat each time — persistent listings suggest the price (not the market) is what's stuck; bring a comps-based counter.
- Current owner paid $39k; list at $120k implies a 208% gain — meaningful room to come down on a strong offer.
Risks & watch-outs
- Watch-outs: built in 1953 — expect roof / HVAC / electrical / plumbing capex.
- Climate carrying-cost: moderate wildfire risk; extreme-heat days projected 6→16/yr by 2055 (HVAC capex compounding) — expect insurance premiums to compound above CPI over the hold.
Questions for the listing agent
- What do current leases actually rent for vs. the listed asking? Can we see a recent rent roll and the last 12 months of T-12 income?
- It's been on market 63 days. Have you received any prior offers? Is the seller open to a 18% concession, seller financing, or rate buy-down credit?
- Built in 1953 — when were the roof, HVAC, electrical panel, plumbing, and water heater last replaced?
- Why hasn't it sold? Are there any deal-killer items the seller is aware of (foundation, flood, title, zoning, code violations)?
- Is there a deadline driving the sale (1031 exchange, divorce, estate, relocation)? That informs how much negotiation room exists.
- Schools are F-rated, which usually means shorter tenancies and higher turnover. Who's the typical renter profile here, and what's been the actual vacancy rate?
- Crime grade is D in this area — have there been break-ins, vandalism, or insurance claims at this property in the last 3 years? What carrier currently insures it and at what premium?
- The area grade is low — what's the realistic commute time and amenity access for the typical tenant pool here? Any planned neighborhood developments (good or bad) we should know about?
- What's the average days-on-market for RENTAL listings here right now (not sales)? A rising rental-DOM trend means longer vacancies and softer asking-rent achievability than the comps imply.
- What's the recent tenant-quality profile in this submarket — average credit score on applications, eviction rate, late-payment / NSF rate, and stable-employment percentage? A property-management company in the area should have these aggregated.
- How much new for-sale + rental construction is in the pipeline within 1–3 miles? Heavy new supply typically softens prices + rents 12–24 months out; constrained supply supports both.
Investment metrics
- 1% rule
- 0.82% ✗
- Cap rate
- 5.68%
- Cash-on-cash
- -2.21%
- DSCR
- 0.90
- GRM
- 10.2
CMA / ARV
No comps found within radius.
Projected returns pro-forma
3.84% appreciation · 3.0% rent growth · sell at horizon
- IRR
- 7.9%
- Equity multiple
- 1.47×
- Total profit
- $15,940
- Equity at exit
- $59,701
- IRR
- 10.1%
- Equity multiple
- 2.66×
- Total profit
- $55,863
- Equity at exit
- $96,748
Cash invested: $33,600 (down + closing). Projections, not guarantees.
Landlord ↔ Tenant lean methodology
- Overall (STATE)
- 83 Strongly Landlord-Friendly
- State Kansas
- 83 Strongly Landlord-Friendly · R+10
- County
- — inherits STATE
- City
- — inherits STATE
ZIP-level market 67003
- Home prices YoY
- 2.4%
- Active inventory
- 16
- Price-to-rent
- 10.2×
Monthly cashflow live
- Estimated rent
- $983 medium interval (Pro) →
- Mortgage (P&I)
- −$629
- Tax from tax record
- −$159 /mo · $1,904/yr
- Insurance
- −$50
- HOA
- −$0
- Vacancy / Maint / Mgmt
- −$206
- Net cashflow
- $-62
Break-even live
UW: 25.0% down · 7.5% · 30yr · 1.5% tax · 5.0% vac · 8.0% maint · 8.0% mgmt
Financing live
Cash to close
- Down payment
- $30,000
- Closing costs
- $3,600
- Reserves months
- —
- Total cash needed
- —
Loan-product check · same deal, 3 products live
Conventional
25% down · 7.5% · 30yr
- Down + closing
- —
- Monthly P&I
- —
- Monthly cashflow
- —
- DSCR
- —
- Eligible?
- —
Personal DTI + credit; lowest rate.
DSCR
20% down · 8.5% · 30yr
- Down + closing
- —
- Monthly P&I
- —
- Monthly cashflow
- —
- DSCR
- —
- Eligible?
- —
No personal income docs; deal must DSCR.
Hard money
10% down · 12.0% · 12mo
- Down + closing
- —
- Monthly P&I
- —
- Monthly cashflow
- —
- DSCR
- —
- Eligible?
- —
Short-term bridge; refi at stabilization.
Listing history 25 events
-
2026-06-18days on market $120,000 Active 63 DOM
-
2026-06-17days on market $120,000 Active 62 DOM
-
2026-06-16days on market $120,000 Active 61 DOM
-
2026-06-15days on market $120,000 Active 60 DOM
-
2026-06-13days on market $120,000 Active 58 DOM
-
2026-06-12days on market $120,000 Active 57 DOM
-
2026-06-09days on market $120,000 Active 54 DOM
-
2026-06-08days on market $120,000 Active 53 DOM
-
2026-06-07days on market $120,000 Active 52 DOM
-
2026-06-05days on market $120,000 Active 50 DOM
-
2026-06-04days on market $120,000 Active 48 DOM
-
2026-06-02days on market $120,000 Active 47 DOM
-
2026-06-01days on market $120,000 Active 46 DOM
-
2026-05-31days on market $120,000 Active 45 DOM
-
2026-05-31days on market $120,000 Active 44 DOM
-
2026-04-16$120,000 Active
-
2022-04-18soldstatus
-
2022-01-15soldstatus
-
2022-01-04$94,900
-
2022-01-04$94,900
-
2022-01-03$94,900
-
2021-02-16$80,000
-
2005-11-01soldstatus $39,000
-
2003-12-01soldstatus $37,000
-
1990-08-01soldstatus $34,000
ⓘ Source: listings_history table (triggers on properties + properties_extension) + one-shot
backfill from property_details.listing_events for pre-trigger history.
Tax reassessment forecast KS · Resets to sale price
- Current annual tax
- $1,904 · $159/mo
- Projected year-2 tax
- $1,904 · $159/mo
- Expected delta
- $0/yr ($0/mo · 0.0%)
ⓘ Screening estimate from a state-policy table — verify with the county assessor before closing.
Climate risk First Street
- Flood 1/10 Low 0% chance over 30 yrs
- Wildfire 5/10 Major
- Heat 5/10 Major 6 d/yr ≥107°F today · 16 d/yr by 30 yrs out
- Wind 2/10 Low 100% chance of damaging wind over 30 yrs
- Air quality 1/10 Low 0 unhealthy d/yr today · 0 by 30 yrs out
Nearby sold comps map
Loading sold comps map…
Walkable amenities ~0.75 mi
Loading nearby amenities…
Taxation est. · year 1
- Rental income
- $11,790
- − Mortgage interest
- −$6,722
- − Property taxes
- −$1,904
- − Insurance
- −$600
- − Repairs & maintenance
- −$943
- − Management
- −$943
- − Depreciation
- −$3,491
- Taxable loss
- −$2,813
- Est. tax savings @ 24.0%
- +$675
- After-tax cash flow
- $-66/yr
For passive investors: Depreciation is non-cash, so a rental often shows a tax loss while cash-flowing — sheltering income. Rental losses are passive: they offset passive income freely, and up to $25,000/yr can offset ordinary (W-2) income if you actively participate and your MAGI is under $100k (phasing out to $0 by $150k); unused losses carry forward. On sale, claimed depreciation is recaptured at up to 25%, and gains may owe capital-gains tax (a 1031 exchange can defer both). Figures are a year-1 estimate at your 24.0% rate — not tax advice; consult a CPA.
Schools (NCES district)
- District
- Chaparral Schools
- NCES district ID
- 2003390
- Math proficiency
- 29% ▼ -2.00%
- Reading proficiency
- 29% ▼ -3.00%
- Median HH income
- $42,329
- Composite
- 24.65/100
- National rank
- #7624
- State rank
- #110 of 169 in KS
Livability — Anthony
- Score
- 68/100
- State rank
- #228
- US rank
- #10031
Category grades
Schools grade is shown separately in the Schools card above.
Census & demographics
- Census place
- Anthony, KS
- Population (ZIP)
- 2,529
Population outlook (Harper County) Hauer SSP2
- Today (2025)
- 5,360 people
- By 2030
- 5,133 · -4.2%
- By 2040
- 4,802 · -10.4%
- By 2050
- 4,589 · -14.4%
- By 2075
- 4,239 · -20.9%
- By 2100
- 3,881 · -27.6%
Race, ethnicity, and origin ACS 2023
- Neighborhood character
- Predominantly White (90%)
- Race & ethnicity
- White 90% Hispanic / Latino 6% Two or more races 4% Black 1%
- Hispanic origin (detail)
- Mexican 6%
- Common ancestry
- Lithuanian 3% Slovak 1% Iranian 1%
- Foreign-born
- 1%
- Languages at home
- 99% English-only · Spanish 1%
Political lean MEDSL · Harper
- 2024 margin
- Solid R (+64.0) · D 17.1% · R 81.1% · Other 1.8%
- 2008→2024 swing
- -18.8pp toward R · 2008: -45.2pp · 2024: -64.0pp
- All cycles
- 2024: R+64.0 2020: R+63.8 2016: R+62.2 2012: R+50.8 2008: R+45.2
Not yet ingested
- Civics
- —
Market trends
- HPI YoY
- ▲ 3.84%
- Current HPI
- 167.175
- Rent YoY
- —
- Metro
- —
- State GDP YoY
- —
- F500 in state
- 0
Price history
+252.9% since first listed10 events — show timeline
- 2026-04-16 Listed $120,000 SCKMLS as Distributed by MLS Grid
- 2022-04-18 Sold (MLS) — MKMLS as distributed by MLS GRID
- 2022-01-15 Sold (MLS) — MKMLS as distributed by MLS GRID
- 2022-01-04 Listed $94,900 MKMLS as distributed by MLS GRID
- 2022-01-04 Listed $94,900 MKMLS as distributed by MLS GRID
- 2022-01-03 Listed $94,900 SCKMLS as Distributed by MLS Grid
- 2021-02-16 Listed $80,000 SCKMLS as Distributed by MLS Grid
- 2005-11-01 Sold (Public Records) $39,000 Public Records
- 2003-12-01 Sold (Public Records) $37,000 Public Records
- 1990-08-01 Sold (Public Records) $34,000 Public Records
Property tax history
+2.0%/yrLatest (2025): $1,904 · -2.0% YoY. Source: county tax records.
Cash-flow waterfall
monthlySold comps — $/sqft
last 12 mo · ≤1 miLoading sold comps…