 🔨 Auction
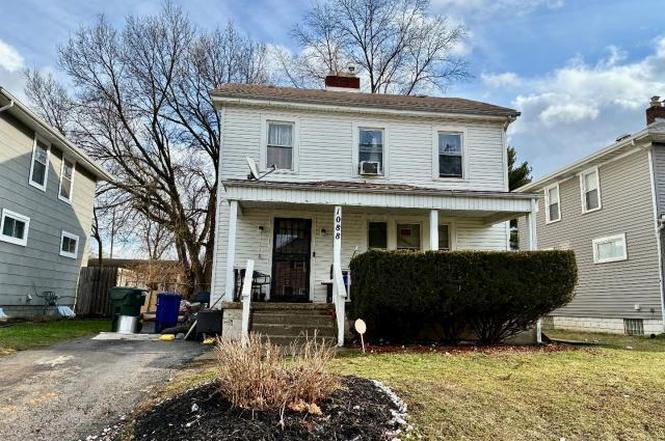
1088 S Champion Ave · Columbus, OH
Flood risk 1/10 · Minimal
- FEMA flood zone
- X (unshaded)
- Chance of flooding over 30 yrs
- 0.0%
- Est. flood insurance / yr
- $473 – $860
Fire risk 1/10 · Minimal
- Est. fire insurance / yr
- $713 – $1,323
Heat risk 4/10 · Minor
- Hot days now (above 100°F)
- 7 days/yr
- Hot days in 30 yrs
- 18 days/yr
Wind risk 2/10 · Minimal
- Chance of severe wind over 30 yrs
- 1.0%
Air-quality risk 3/10 · Minor
- Unhealthy air days now
- 2 days/yr
- Unhealthy air days in 30 yrs
- 3 days/yr
Risk factors via First Street. Map © Google.
Why this score? — see what drove the F grade
The composite is a weighted blend of 9 inputs, each scored 0–100. Each bar is that input's sub-score; the figure is the points it added to the 100-point composite (weight × sub-score).
- ARV discount +7.5/15.0
- Cash flow +6.0/30.0
- Livability +4.0/5.0
- Rent growth +3.4/5.0
- Condition / age +2.5/5.0
- Schools +1.7/10.0
- 1% rule +1.3/10.0
- DSCR +0.3/10.0
- Appreciation +0.0/10.0
$1
🖨 Deal sheet (PDF) 📄 Offer letter ✓ Due diligence
Listing remarks
Court Ordered Sale by Private Selling Officer. All information we have on the property is included. We have no additional information, property condition is unknown. NO SHOWINGS, NO trespassing for any reason. Auction ends on February 10, 2026. Information is thought to be correct but not guaranteed. 5% Buyer Premium added to the high bid, $5,000 deposit is due within 24 hours of bidding end.
Key facts
- 4,356 sq ft lot
- Built 1922
Neighborhood map
What this means for you Summary
Snapshot
- This is a 3-bed/1.0-bath single-family listed at $1.
Deal economics
- At list price, monthly cash flow is $-536 ($-6k/yr) — negative.
- The deal already cash-flows at list — no discount required.
- Meets the 1% rule at list price ($2k rent vs $1).
Location & tenants
- Location reads 81/100 on livability (#97 in OH, #1,491 nationally) — a professional / high-income tenant draw. Strengths: commute A+, cost of living A+, housing A+; Watch: employment C-, crime F.
- Columbus City School District (urban): math 15% / reading 26% proficiency, ranked #626 of 656 in OH (top 95%) — low school quality limits family demand, transient renter base, plan for 1-2y turnover; 72% free/reduced lunch — lower-income household profile, screen leases tightly.
- Market conditions: Rents rising (+3.5%/yr); 198 active listings in the ZIP; 40 comparable units currently listed for rent nearby; rentals at typical pace (median 25d on market — plan ~3-4 weeks tenant-placement turnaround); 48% of comp listings sitting > 30 days — soft ceiling on asking rent; solid renter incomes; 8,139 units permitted in Franklin County in 2024 (5,940 in 5+ unit buildings).
Forward outlook
- Local home prices are declining (-3.0%/yr); year-one equity from $2k of loan paydown is wiped out by about $8k of value loss. Plan a longer hold.
- Franklin County population projected at +34% by 2050 — long-run rental-demand tailwind backs the buy-and-hold thesis.
Negotiation context
- Only 0 days on market — expect competitive offers; lowballing is unlikely to land.
Risks & watch-outs
- Watch-outs: property tax is 418554.0% of price; built in 1922 — expect roof / HVAC / electrical / plumbing capex.
Questions for the listing agent
- What do current leases actually rent for vs. the listed asking? Can we see a recent rent roll and the last 12 months of T-12 income?
- Built in 1922 — when were the roof, HVAC, electrical panel, plumbing, and water heater last replaced?
- Property tax is high relative to price — has the assessment been appealed recently, and will the sale trigger a re-assessment?
- Is there a deadline driving the sale (1031 exchange, divorce, estate, relocation)? That informs how much negotiation room exists.
- Crime grade is F in this area — have there been break-ins, vandalism, or insurance claims at this property in the last 3 years? What carrier currently insures it and at what premium?
- The area grade is low — what's the realistic commute time and amenity access for the typical tenant pool here? Any planned neighborhood developments (good or bad) we should know about?
- What's the average days-on-market for RENTAL listings here right now (not sales)? A rising rental-DOM trend means longer vacancies and softer asking-rent achievability than the comps imply.
- What's the recent tenant-quality profile in this submarket — average credit score on applications, eviction rate, late-payment / NSF rate, and stable-employment percentage? A property-management company in the area should have these aggregated.
- How much new for-sale + rental construction is in the pipeline within 1–3 miles? Heavy new supply typically softens prices + rents 12–24 months out; constrained supply supports both.
Investment metrics
- 1% rule
- 0.63% ✗
- Cap rate
- 3.99%
- Cash-on-cash
- -8.23%
- DSCR
- 0.63
- GRM
- 13.2
CMA / ARV
- ARV (on-the-fly)
- $279,036
- Comps found
- 12
Show comp detail 12 sales within ~0.75 mi
| Address | Dist | Beds/Ba | Sqft | Sold | Price | $/sf | Match |
|---|---|---|---|---|---|---|---|
| 997 Oakwood Ave | 0.15mi | 3/1.5 | 1,260 (-6%) | 1mo | $242,500 | $192 | 79 |
| 792 Thurman Ave | 0.35mi | 3/1.5 | 1,307 (-3%) | 1mo | $280,000 | $214 | 76 |
| 1079 Ellsworth Ave | 0.49mi | 4/1.0 (+1) | 1,336 (-1%) | 1mo | $82,500 | $62 | 70 |
| 882 S Gilbert St | 0.33mi | 2/1.0 (-1) | 1,198 (-11%) | 0mo | $195,000 | $163 | 61 |
| 667 E Columbus St | 0.54mi | 3/1.0 | 1,232 (-9%) | 1mo | $268,000 | $218 | 60 |
| 1329 Studer Ave | 0.39mi | 3/1.5 | 1,191 (-12%) | 1mo | $212,000 | $178 | 60 |
| 1343 Linwood Ave | 0.38mi | 3/1.5 | 1,520 (+13%) | 0mo | $315,000 | $207 | 59 |
| 1576 Linwood Ave | 0.69mi | 3/1.5 | 1,272 (-6%) | 2mo | $245,000 | $193 | 55 |
| 1005 Studer Ave | 0.33mi | 3/2.5 | 1,544 (+14%) | 2mo | $272,900 | $177 | 53 |
| 959 Heyl Ave | 0.38mi | 2/2.5 (-1) | 1,176 (-13%) | 1mo | $260,000 | $221 | 49 |
| 605 Frebis Ave | 0.73mi | 3/2.5 | 1,459 (+8%) | 1mo | $345,000 | $236 | 45 |
| 601 Frebis Ave | 0.73mi | 3/2.5 | 1,459 (+8%) | 2mo | $349,000 | $239 | 45 |
Match score weights: distance 35% · size 25% · config 20% · recency 20%. Top-matched comps best support the ARV.
Projected returns pro-forma
-3.0% appreciation · 3.51% rent growth · sell at horizon
- IRR
- -30.2%
- Equity multiple
- -0.00×
- Total profit
- $-78,389
- Equity at exit
- $41,605
- IRR
- -29.7%
- Equity multiple
- -0.39×
- Total profit
- $-108,303
- Equity at exit
- $24,126
Cash invested: $78,130 (down + closing). Projections, not guarantees.
Landlord ↔ Tenant lean methodology
- Overall (STATE)
- 73 Landlord-Friendly
- State Ohio
- 73 Landlord-Friendly · R+6
- County
- — inherits STATE
- City
- — inherits STATE
ZIP-level market 43206
- Rents YoY
- 3.5%
- Active inventory
- 198
Monthly cashflow live
- Estimated rent
- $1,763 high interval (Pro) →
- Mortgage (P&I)
- −$1,463
- Tax est. 1.5%
- −$349 /mo · $4,186/yr
- Insurance
- −$116
- HOA
- −$0
- Vacancy / Maint / Mgmt
- −$370
- Net cashflow
- $-536
Break-even live
Sensitivity live
| Price | -10% $-343 | -5% $-439 | +0% $-536 | +5% $-632 | +10% $-728 |
|---|---|---|---|---|---|
| Rent | -10% $-675 | -5% $-605 | +0% $-536 | +5% $-466 | +10% $-396 |
| Rate | -1.0pp $-395 | -0.5pp $-465 | base $-536 | +0.5pp $-608 | +1.0pp $-681 |
UW: 25.0% down · 7.5% · 30yr · 1.5% tax · 5.0% vac · 8.0% maint · 8.0% mgmt
Financing live
Cash to close
- Down payment
- $69,759
- Closing costs
- $8,371
- Reserves months
- —
- Total cash needed
- —
Loan-product check · same deal, 3 products live
Conventional
25% down · 7.5% · 30yr
- Down + closing
- —
- Monthly P&I
- —
- Monthly cashflow
- —
- DSCR
- —
- Eligible?
- —
Personal DTI + credit; lowest rate.
DSCR
20% down · 8.5% · 30yr
- Down + closing
- —
- Monthly P&I
- —
- Monthly cashflow
- —
- DSCR
- —
- Eligible?
- —
No personal income docs; deal must DSCR.
Hard money
10% down · 12.0% · 12mo
- Down + closing
- —
- Monthly P&I
- —
- Monthly cashflow
- —
- DSCR
- —
- Eligible?
- —
Short-term bridge; refi at stabilization.
Rent comps 40 comps
| Address | Beds | Baths | Sqft | Rent | $/sqft | DOM | Units | Dist |
|---|---|---|---|---|---|---|---|---|
| 1118 S Ohio Ave Columbus, OH | 3.0 | 1.5 | 1232 | $1,750 | $1.42 | 45d | 1 | 0.11mi |
| 997 Oakwood Ave Columbus, OH | 3.0 | 1.5 | 1260 | $1,800 | $1.43 | 13d | 1 | 0.13mi |
| 1056 Wilson Ave Unit A Columbus, OH | 2.0 | 1.0 | 1100 | $1,225 | $1.11 | 45d | 1 | 0.15mi |
| 1056 Wilson Ave Unit B Columbus, OH | 2.0 | 1.0 | 1100 | $1,195 | $1.09 | 18d | 1 | 0.15mi |
| 880 E Whittier St Columbus, OH | 2.0 | 1.5 | 1064 | $1,100 | $1.03 | 45d | 1 | 0.17mi |
| 977 S Ohio Ave Columbus, OH | 3.0 | 2.5 | 1650 | $2,500 | $1.52 | 45d | 1 | 0.18mi |
| 1225 S Champion Ave Unit 1225 Columbus, OH | 3.0 | 1.0 | 1110 | $1,095 | $0.99 | 4d | 1 | 0.22mi |
| 1227 S Champion Ave Unit 1227 Columbus, OH | 3.0 | 1.0 | 1110 | $1,195 | $1.08 | 4d | 1 | 0.22mi |
| 850 E Whittier St Columbus, OH | 3.0 | 2.0 | 1200 | $1,949 | $1.62 | 25d | 1 | 0.22mi |
| 963 S 22nd St Columbus, OH | 3.0 | 2.0 | 1188 | $3,200 | $2.69 | 8d | 1 | 0.23mi |
| 968 Wilson Ave Unit 970 Columbus, OH | 2.0 | 1.0 | 900 | $1,225 | $1.36 | 25d | 1 | 0.23mi |
| 1239-1241 S Champion Ave Columbus, OH | 3.0 | 1.0 | 1134 | $1,275 | $1.12 | 17d | 1 | 0.24mi |
| 1167 E Whittier St Columbus, OH | 3.0 | 1.5 | 1300 | $1,950 | $1.50 | 45d | 1 | 0.25mi |
| 1165-1167 E Whittier St Columbus, OH | 3.0 | 1.5 | 1300 | $1,950 | $1.50 | 45d | 1 | 0.25mi |
| 936 Wagner St Columbus, OH | 3.0 | 3.0 | 1560 | $2,750 | $1.76 | 25d | 1 | 0.27mi |
| 988 Linwood Ave Columbus, OH | 4.0 | 3.0 | 1800 | $2,750 | $1.53 | 18d | 1 | 0.28mi |
| 1210 E Whittier St Columbus, OH | 2.0 | 1.0 | 973 | $1,950 | $2.00 | 45d | 1 | 0.31mi |
| 761 Siebert St Columbus, OH | 2.0 | 2.0 | 1050 | $2,350 | $2.24 | 4d | 1 | 0.33mi |
| 1288 Linwood Ave Columbus, OH | 3.0 | 1.0 | 1344 | $1,900 | $1.41 | 45d | 1 | 0.33mi |
| 932 Linwood Ave Columbus, OH | 4.0 | 1.5 | 1663 | $2,045 | $1.23 | 45d | 1 | 0.34mi |
| 857 Wilson Ave #859 Columbus, OH | 3.0 | 2.5 | 1527 | $1,650 | $1.08 | 45d | 1 | 0.37mi |
| 814 S Ohio Ave Columbus, OH | 3.0 | 1.0 | 1380 | $1,600 | $1.16 | 45d | 1 | 0.38mi |
| 1275-1279 E Kossuth St Columbus, OH | 2.0 | 2.0 | 1160 | $1,350 | $1.16 | 45d | 1 | 0.41mi |
| 966 S 18th St Columbus, OH | 3.0 | 1.5 | 1428 | $2,400 | $1.68 | 45d | 1 | 0.42mi |
| 904 Studer Ave Columbus, OH | 3.0 | 1.5 | 1364 | $1,780 | $1.30 | 25d | 1 | 0.43mi |
| 1154 Miller Ave Columbus, OH | 3.0 | 1.0 | 1012 | $1,350 | $1.33 | 16d | 1 | 0.43mi |
| 815 Wilson Ave Columbus, OH | 3.0 | 1.5 | 1400 | $1,500 | $1.07 | 8d | 1 | 0.43mi |
| 813 Wilson Ave Unit 1 Columbus, OH | 3.0 | 1.5 | 1400 | $1,500 | $1.07 | 8d | 1 | 0.43mi |
| 928 S 18th St Columbus, OH | 3.0 | 2.0 | 1216 | $1,995 | $1.64 | 45d | 1 | 0.44mi |
| 877 Heyl Ave Columbus, OH | 2.0 | 1.0 | 1200 | $1,750 | $1.46 | 45d | 1 | 0.44mi |
| 975-977 Miller Ave Unit 977 Columbus, OH | 2.0 | 1.5 | 930 | $1,100 | $1.18 | 45d | 1 | 0.45mi |
| 1106 Ellsworth Ave Columbus, OH | 3.0 | 1.0 | 1150 | $1,495 | $1.30 | 8d | 1 | 0.48mi |
| 705 E Columbus St Columbus, OH | 3.0 | 1.0 | 1436 | $2,300 | $1.60 | 45d | 1 | 0.50mi |
| 1416 S Ohio Ave Columbus, OH | 3.0 | 1.5 | 1056 | $1,595 | $1.51 | 22d | 1 | 0.51mi |
| 1026 Ellsworth Ave Columbus, OH | 3.0 | 1.0 | 1100 | $1,295 | $1.18 | 21d | 1 | 0.52mi |
| 824 Studer Ave Columbus, OH | 2.0 | 1.0 | 980 | $925 | $0.94 | 18d | 1 | 0.52mi |
| 1257 E Livingston Ave Columbus, OH | 2.0 | 1.0 | 975 | $925 | $0.95 | 21d | 1 | 0.52mi |
| 730-732 Oakwood Ave Unit 732 Columbus, OH | 3.0 | 1.0 | 1232 | $1,425 | $1.16 | 45d | 1 | 0.53mi |
| 1267 E Livingston Ave Columbus, OH | 2.0 | 1.0 | 1000 | $925 | $0.93 | 25d | 1 | 0.54mi |
| 1460 Oakwood Ave Columbus, OH | 2.0 | 1.0 | 901 | $900 | $1.00 | 45d | 1 | 0.54mi |
Listing history 3 events
-
2026-02-10status Pending
-
2026-02-02$1
-
2026-02-02historical
ⓘ Source: listings_history table (triggers on properties + properties_extension) + one-shot
backfill from property_details.listing_events for pre-trigger history.
Climate risk First Street
- Flood 1/10 Low FEMA zone X (unshaded) · 0% chance over 30 yrs
- Wildfire 1/10 Low
- Heat 4/10 Moderate 7 d/yr ≥100°F today · 18 d/yr by 30 yrs out
- Wind 2/10 Low 100% chance of damaging wind over 30 yrs
- Air quality 3/10 Moderate 2 unhealthy d/yr today · 3 by 30 yrs out
Nearby sold comps map
Loading sold comps map…
Walkable amenities ~0.75 mi
Loading nearby amenities…
Taxation est. · year 1
- Rental income
- $21,157
- − Mortgage interest
- −$15,630
- − Property taxes
- −$4,186
- − Insurance
- −$1,395
- − Repairs & maintenance
- −$1,693
- − Management
- −$1,693
- − Depreciation
- −$8,117
- Taxable loss
- −$11,557
- Est. tax savings @ 24.0%
- +$2,774
- After-tax cash flow
- $-3,653/yr
For passive investors: Depreciation is non-cash, so a rental often shows a tax loss while cash-flowing — sheltering income. Rental losses are passive: they offset passive income freely, and up to $25,000/yr can offset ordinary (W-2) income if you actively participate and your MAGI is under $100k (phasing out to $0 by $150k); unused losses carry forward. On sale, claimed depreciation is recaptured at up to 25%, and gains may owe capital-gains tax (a 1031 exchange can defer both). Figures are a year-1 estimate at your 24.0% rate — not tax advice; consult a CPA.
Schools (NCES district)
- District
- Columbus City School District
- NCES district ID
- 3904380
- Math proficiency
- 15% ▼ -17.00%
- Reading proficiency
- 26% ▼ -12.00%
- Median HH income
- $38,483
- Composite
- 17.19/100
- National rank
- #9105
- State rank
- #626 of 656 in OH
Livability — Columbus
- Score
- 81/100
- State rank
- #97
- US rank
- #1491
Category grades
Schools grade is shown separately in the Schools card above.
Census & demographics
- Census place
- Columbus, OH
- County
- Franklin County · 1,351,780 people
- City population
- 612,189
- Metro
- Columbus, OH
- Population (ZIP)
- 21,996
- Household income
- $75,806
- Rent vs Own
- Severe rent burden
- 846.0
Population outlook (Franklin County) Hauer SSP2
- Today (2025)
- 1,456,139 people
- By 2030
- 1,556,890 · +6.9%
- By 2040
- 1,757,349 · +20.7%
- By 2050
- 1,950,539 · +34.0%
- By 2075
- 2,376,171 · +63.2%
- By 2100
- 2,636,796 · +81.1%
Race, ethnicity, and origin ACS 2023
- Neighborhood character
- Diverse neighborhood (Simpson 0.59)
- Race & ethnicity
- White 56% Black 31% Two or more races 9% Hispanic / Latino 4% Asian 1% Native American 1%
- Common ancestry
- Romanian 3% Slovak 2% Lithuanian 1%
- Foreign-born
- 4% · Canada
- Languages at home
- 96% English-only · Spanish 2% Other Indo-European 1%
Political lean MEDSL · Franklin
- 2024 margin
- Strong D (+28.4) · D 63.7% · R 35.3% · Other 1.0%
- 2008→2024 swing
- +7.7pp toward D · 2008: 20.7pp · 2024: 28.4pp
- All cycles
- 2024: D+28.4 2020: D+31.4 2016: D+25.9 2012: D+21.7 2008: D+20.7
Not yet ingested
- Civics
- —
Market trends
- HPI YoY
- ▼ -576.73%
- Current HPI
- 173.8569
- Rent YoY
- ▲ 3.51%
- Metro
- Columbus, OH
- State GDP YoY
- ▲ 1.98%
- F500 in state
- 48
Industry mix (Fortune 500 HQ in OH)
| Industry | F500 HQs | Revenue |
|---|---|---|
| Insurance | 3 | $145B |
|
||
| Industrial Machinery | 3 | $49B |
|
||
| Financial Services | 3 | $24B |
|
||
| Consumer Goods | 2 | $93B |
|
||
| Aerospace / Defense | 2 | $47B |
|
||
| Utilities | 2 | $33B |
|
||
Property tax history
+20.5%/yrLatest (2024): $4,379 · +8.4% YoY. Source: county tax records.
Cash-flow waterfall
monthlySold comps — $/sqft
last 12 mo · ≤1 miLoading sold comps…