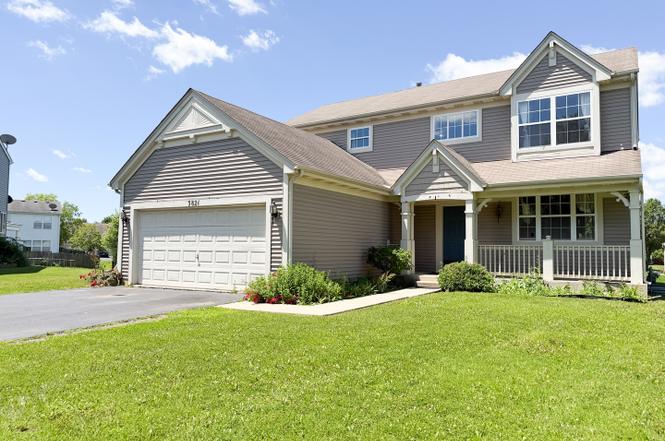
3821 Spring Lake Ct · Joliet, IL
Flood risk 1/10 · Minimal
- FEMA flood zone
- X (unshaded)
- Chance of flooding over 30 yrs
- 0.0%
- Est. flood insurance / yr
- $473 – $860
Fire risk 1/10 · Minimal
- Est. fire insurance / yr
- $804 – $1,492
Heat risk 3/10 · Minor
- Hot days now (above 102°F)
- 7 days/yr
- Hot days in 30 yrs
- 15 days/yr
Wind risk 2/10 · Minimal
- Chance of severe wind over 30 yrs
- 1.0%
Air-quality risk 2/10 · Minimal
- Unhealthy air days now
- 1 days/yr
- Unhealthy air days in 30 yrs
- 2 days/yr
Risk factors via First Street. Map © Google.
Why this score? — see what drove the C- grade
The composite is a weighted blend of 9 inputs, each scored 0–100. Each bar is that input's sub-score; the figure is the points it added to the 100-point composite (weight × sub-score).
- ARV discount +15.0/15.0
- Cash flow +12.7/30.0
- 1% rule +5.0/10.0
- Rent growth +4.4/5.0
- Livability +3.9/5.0
- DSCR +3.8/10.0
- Schools +2.9/10.0
- Condition / age +2.5/5.0
- Appreciation +0.0/10.0
$279,900
🖨 Deal sheet (PDF) 📄 Offer letter ✓ Due diligence
Listing remarks MLS
Wonderful 4 bedroom 2 story in Plainfield school district!One owner home! This Home is immaculate!!! Hurry on this one before its gone! 2 story foyer with hardwood flooring, Eat-in kitchen open to family room is great for entertaining! Living room and formal dining room, new 26 x 15 deck in 2015 and Hot water heater in 2016! All appliances stay! Master suite with dual sink vanity, ceramic flooring, soaker tub and walk in closet. Good sized bedrooms, neutral carpet and decor! Partial unfinished basement. 2 car garage... on quiet cu de sac! Great buy for the money! Seller will entertain all offers. Hurry!!!!
Key facts
- Formal dining room
- Quiet cul-de-sac
- Family room
Tags
Property features AI
Finance
- HOA & community: Annual association fee of $300 (covers other items)
Exterior
- Parking: Attached garage with 2 spaces and garage door opener (garage owned)
- Utilities: Public water; Public sewer
- Home design: Detached single-family home; 2-story layout; Fee simple ownership
- Construction: Built approximately 16–20 years ago; Vinyl siding; Asphalt roof
- Exterior features: Deck
Interior
- Kitchen: Kitchen on main level
- Bedrooms: 4 bedrooms (plus space for a 5th); One bedroom located in the basement
- Flooring: Carpet in several rooms (living room, dining room, master bedroom, multiple upstairs bedrooms)
- Bathrooms: 2 full bathrooms; 1 half bathroom; Bathrooms feature separate shower, double sinks, and a soaking tub
- Heating & cooling: Natural gas heating; Central air conditioning
- Interior features: Walk-in closet(s); Partially finished basement; Total of 9 rooms
- Laundry & utility: Main-level laundry with gas dryer hookup
Neighborhood map
What this means for you Summary
Snapshot
- This is a 4-bed/2.5-bath single-family listed at $280k.
Deal economics
- At list price, monthly cash flow is $-29 ($-343/yr) — negative.
- To cash-flow at today's rent, offer at most $275k (1.8% below list).
- To meet the 1% rule (rent ≥ 1% of price), the offer needs to be $279k (0.3% below list).
- Recommended offer: $275k (1.8% below list) — sets the bar for cash-flow.
- Cap rate 6.2% vs local median 4.8% in Joliet — meaningfully above typical; check what's discounted (condition, days-on-market, listing class) to confirm the premium yield is real.
Location & tenants
- Location reads 78/100 on livability (#153 in IL, #2,772 nationally) — a middle-class / working-renter tenant base. Strengths: commute A+, housing A+, cost of living A; Watch: amenities C-, health & safety C-.
- Plainfield SD 202 (suburban): math 25% / reading 32% proficiency, ranked #213 of 620 in IL (top 34%) — low school quality limits family demand, transient renter base, plan for 1-2y turnover; only 17% free/reduced lunch — higher-income household profile.
- Zoned schools: Central Elem School (math 24% / reading 35%, grade F, #658 of 2,056 statewide, top 35%, 533 students, 0% FRL); Indian Trail Middle School (math 25% / reading 34%, grade F, #256 of 665 statewide, top 41%, 593 students, 0% FRL); Plainfield High School (math 25% / reading 29%, grade F, #218 of 693 statewide, top 35%, 1,986 students, 0% FRL) — zoned schools average 0% FRL vs 17% district-wide (17 pts lower); this property's tenant base skews higher-income than the district average.
- Market conditions: Rents rising fast (+7.7%/yr); 38 active listings in the ZIP; 2 comparable units currently listed for rent nearby; solid renter incomes; 2,028 units permitted in Will County in 2024 (530 in 5+ unit buildings).
- This rent runs 44% of the median local income ($76k/yr) — at the standard rent-burdened threshold; future hikes will face affordability resistance.
Forward outlook
- Local home prices are declining (-3.0%/yr); year-one equity from $2k of loan paydown is wiped out by about $8k of value loss. Plan a longer hold.
- Will County population projected to shrink 4% by 2050 — rents likely to lag national; underwrite the cash flow, not the appreciation.
Negotiation context
- Only 1 days on market — expect competitive offers; lowballing is unlikely to land.
- 9 sale attempts since 20y ago with the ask held roughly flat each time — persistent listings suggest the price (not the market) is what's stuck; bring a comps-based counter.
- Current owner paid $228k; 22% above their basis — modest negotiation headroom, anchor on the comps not their cost.
Risks & watch-outs
- Watch-outs: property tax is 2.7% of price.
Questions for the listing agent
- What do current leases actually rent for vs. the listed asking? Can we see a recent rent roll and the last 12 months of T-12 income?
- Property tax is high relative to price — has the assessment been appealed recently, and will the sale trigger a re-assessment?
- What does the HOA fee cover, when was the last increase, and are there any pending special assessments or reserve-fund shortfalls?
- Is there a deadline driving the sale (1031 exchange, divorce, estate, relocation)? That informs how much negotiation room exists.
- Schools are F-rated, which usually means shorter tenancies and higher turnover. Who's the typical renter profile here, and what's been the actual vacancy rate?
- What's the average days-on-market for RENTAL listings here right now (not sales)? A rising rental-DOM trend means longer vacancies and softer asking-rent achievability than the comps imply.
- What's the recent tenant-quality profile in this submarket — average credit score on applications, eviction rate, late-payment / NSF rate, and stable-employment percentage? A property-management company in the area should have these aggregated.
- How much new for-sale + rental construction is in the pipeline within 1–3 miles? Heavy new supply typically softens prices + rents 12–24 months out; constrained supply supports both.
Investment metrics
- 1% rule
- 1.00% ✗
- Cap rate
- 6.17%
- Cash-on-cash
- -0.44%
- DSCR
- 0.98
- GRM
- 8.4
CMA / ARV
- ARV (on-the-fly)
- $420,624
- Comps found
- 12
Show comp detail 12 sales within ~0.75 mi
| Address | Dist | Beds/Ba | Sqft | Sold | Price | $/sf | Match |
|---|---|---|---|---|---|---|---|
| 3808 Thoroughbred Ln | 0.23mi | 4/2.5 | 2,460 (+8%) | 9mo | $345,000 | $140 | 70 |
| 2902 Grass Lake Dr | 0.70mi | 4/2.5 | 2,359 (+3%) | 10mo | $422,000 | $179 | 54 |
| 727 Pentwater Rd | 0.54mi | 3/2.5 (-1) | 2,189 (-4%) | 12mo | $385,000 | $176 | 53 |
| 21207 Prince Lake Ct | 0.64mi | 3/2.5 (-1) | 2,143 (-6%) | 3mo | $424,900 | $198 | 52 |
| 1761 William Dr | 0.71mi | 4/2.5 | 2,452 (+7%) | 9mo | $425,000 | $173 | 47 |
| 21533 Cormorant St | 0.43mi | 3/2.5 (-1) | 1,980 (-13%) | 6mo | $364,000 | $184 | 47 |
| 16139 Seneca Lake Cir | 0.62mi | 3/2.5 (-1) | 2,547 (+11%) | 1mo | $385,000 | $151 | 46 |
| 16122 Seneca Lake Cir | 0.57mi | 3/2.0 (-1) | 1,969 (-14%) | 1mo | $365,000 | $185 | 43 |
| 21316 Brush Lake Dr | 0.61mi | 3/3.0 (-1) | 1,977 (-14%) | 4mo | $449,900 | $228 | 39 |
| 16163 Seneca Lake Cir | 0.56mi | 3/3.0 (-1) | 1,950 (-15%) | 8mo | $400,000 | $205 | 36 |
| 16306 Windsor Lake Ct | 0.55mi | 3/3.5 (-1) | 2,578 (+13%) | 11mo | $425,000 | $165 | 35 |
| 608 Bridgeman Ln | 0.75mi | 3/3.0 (-1) | 2,089 (-9%) | 11mo | $410,000 | $196 | 34 |
Match score weights: distance 35% · size 25% · config 20% · recency 20%. Top-matched comps best support the ARV.
Projected returns pro-forma
-3.0% appreciation · 7.65% rent growth · sell at horizon
- IRR
- -11.1%
- Equity multiple
- 0.58×
- Total profit
- $-33,284
- Equity at exit
- $41,734
- IRR
- 4.4%
- Equity multiple
- 1.40×
- Total profit
- $31,339
- Equity at exit
- $24,201
Cash invested: $78,372 (down + closing). Projections, not guarantees.
Landlord ↔ Tenant lean methodology
- Overall (STATE)
- 43 Moderately Tenant-Leaning
- State Illinois
- 43 Moderately Tenant-Leaning · D+7
- County
- — inherits STATE
- City
- — inherits STATE
ZIP-level market 60435
- Rents YoY
- 7.7%
- Active inventory
- 38
- Price-to-rent
- 8.4×
Monthly cashflow live
- Estimated rent
- $2,791 medium interval (Pro) →
- Mortgage (P&I)
- −$1,468
- Tax from tax record
- −$624 /mo · $7,485/yr
- Insurance
- −$117
- HOA
- −$25
- Vacancy / Maint / Mgmt
- −$586
- Net cashflow
- $-29
Break-even live
Sensitivity live
| Price | -10% $130 | -5% $51 | +0% $-29 | +5% $-108 | +10% $-187 |
|---|---|---|---|---|---|
| Rent | -10% $-249 | -5% $-139 | +0% $-29 | +5% $82 | +10% $192 |
| Rate | -1.0pp $112 | -0.5pp $43 | base $-29 | +0.5pp $-101 | +1.0pp $-175 |
UW: 25.0% down · 7.5% · 30yr · 1.5% tax · 5.0% vac · 8.0% maint · 8.0% mgmt
Financing live
Cash to close
- Down payment
- $69,975
- Closing costs
- $8,397
- Reserves months
- —
- Total cash needed
- —
Loan-product check · same deal, 3 products live
Conventional
25% down · 7.5% · 30yr
- Down + closing
- —
- Monthly P&I
- —
- Monthly cashflow
- —
- DSCR
- —
- Eligible?
- —
Personal DTI + credit; lowest rate.
DSCR
20% down · 8.5% · 30yr
- Down + closing
- —
- Monthly P&I
- —
- Monthly cashflow
- —
- DSCR
- —
- Eligible?
- —
No personal income docs; deal must DSCR.
Hard money
10% down · 12.0% · 12mo
- Down + closing
- —
- Monthly P&I
- —
- Monthly cashflow
- —
- DSCR
- —
- Eligible?
- —
Short-term bridge; refi at stabilization.
Rent comps 2 comps
| Address | Beds | Baths | Sqft | Rent | $/sqft | DOM | Units | Dist |
|---|---|---|---|---|---|---|---|---|
| 1716 William Dr Romeoville, IL | 3.0 | 3.5 | 1700 | $3,800 | $2.24 | 3d | 1 | 0.74mi |
| 315 Richmond Dr Romeoville, IL | 3.0 | 2.5 | 1668 | $2,700 | $1.62 | 0d | 1 | 1.39mi |
HOA detail
- Monthly dues
- $25 · $300/yr
- Likely covers
- water
Listing history 2 events
-
2026-06-21remarks 699-char remark
-
2026-06-21$279,900 Active 1 DOM
ⓘ Source: listings_history table (triggers on properties + properties_extension) + one-shot
backfill from property_details.listing_events for pre-trigger history.
Tax reassessment forecast IL · Partial reset (capped growth)
- Current annual tax
- $7,485 · $624/mo
- Projected year-2 tax
- $7,485 · $624/mo
- Expected delta
- $0/yr ($0/mo · 0.0%)
ⓘ Screening estimate from a state-policy table — verify with the county assessor before closing.
Climate risk First Street
- Flood 1/10 Low FEMA zone X (unshaded) · 0% chance over 30 yrs
- Wildfire 1/10 Low
- Heat 3/10 Moderate 7 d/yr ≥102°F today · 15 d/yr by 30 yrs out
- Wind 2/10 Low 100% chance of damaging wind over 30 yrs
- Air quality 2/10 Low 1 unhealthy d/yr today · 2 by 30 yrs out
Nearby sold comps map
Loading sold comps map…
Walkable amenities ~0.75 mi
Loading nearby amenities…
Taxation est. · year 1
- Rental income
- $33,487
- − Mortgage interest
- −$15,679
- − Property taxes
- −$7,485
- − Insurance
- −$1,400
- − Repairs & maintenance
- −$2,679
- − Management
- −$2,679
- − HOA
- −$300
- − Depreciation
- −$8,143
- Taxable loss
- −$4,876
- Est. tax savings @ 24.0%
- +$1,170
- After-tax cash flow
- $827/yr
For passive investors: Depreciation is non-cash, so a rental often shows a tax loss while cash-flowing — sheltering income. Rental losses are passive: they offset passive income freely, and up to $25,000/yr can offset ordinary (W-2) income if you actively participate and your MAGI is under $100k (phasing out to $0 by $150k); unused losses carry forward. On sale, claimed depreciation is recaptured at up to 25%, and gains may owe capital-gains tax (a 1031 exchange can defer both). Figures are a year-1 estimate at your 24.0% rate — not tax advice; consult a CPA.
Schools (NCES district)
- District
- Plainfield SD 202
- NCES district ID
- 1731740
- Math proficiency
- 25% ▼ -16.00%
- Reading proficiency
- 32% ▼ -14.00%
- Median HH income
- $90,706
- Composite
- 28.83/100
- National rank
- #6653
- State rank
- #213 of 620 in IL
Livability — Joliet
- Score
- 78/100
- State rank
- #153
- US rank
- #2772
Category grades
Schools grade is shown separately in the Schools card above.
Census & demographics
- Census place
- Joliet, IL
- County
- Will County · 412,448 people
- City population
- 68,632
- Metro
- Chicago-Naperville-Elgin, IL-IN-WI
- Population (ZIP)
- 48,167
- Household income
- $76,369
- Rent vs Own
- Severe rent burden
- 1720.0
Population outlook (Will County) Hauer SSP2
- Today (2025)
- 705,368 people
- By 2030
- 708,154 · +0.4%
- By 2040
- 702,692 · -0.4%
- By 2050
- 680,249 · -3.6%
- By 2075
- 611,990 · -13.2%
- By 2100
- 516,215 · -26.8%
Race, ethnicity, and origin ACS 2023
- Neighborhood character
- Diverse neighborhood (Simpson 0.65)
- Race & ethnicity
- White 44% Hispanic / Latino 37% Black 15% Two or more races 14% Asian 1%
- Hispanic origin (detail)
- Mexican 33% Puerto Rican 2%
- Common ancestry
- Romanian 6% Lithuanian 1% Slovak 1%
- Foreign-born
- 16% · Canada
- Languages at home
- 71% English-only · Spanish 26% Russian/Polish/Slavic 1%
Political lean MEDSL · Will
- 2024 margin
- Toss-up / Even · D 50.1% · R 48.5% · Other 1.4%
- 2008→2024 swing
- -11.6pp toward R · 2008: 13.2pp · 2024: 1.6pp
- All cycles
- 2024: D+1.6 2020: D+8.3 2016: D+5.7 2012: D+3.7 2008: D+13.2
Not yet ingested
- Civics
- —
Market trends
- HPI YoY
- ▼ -171.52%
- Current HPI
- 210.278
- Rent YoY
- ▲ 7.65%
- Metro
- Chicago-Naperville-Elgin, IL-IN-WI
- State GDP YoY
- ▲ 1.59%
- F500 in state
- 60
Industry mix (Fortune 500 HQ in IL)
| Industry | F500 HQs | Revenue |
|---|---|---|
| Insurance | 4 | $201B |
|
||
| Consumer Goods | 4 | $87B |
|
||
| Industrial Machinery | 3 | $64B |
|
||
| Healthcare | 2 | $55B |
|
||
| Retail / Pharmacy | 1 | $148B |
|
||
| Agriculture / Food | 1 | $86B |
|
||
Price history
+12.5% since first listed24 events — show timeline
- 2026-06-20 Listed $279,900 MRED as Distributed by MLS Grid
- 2018-10-15 Listing Removed — MRED as Distributed by MLS Grid
- 2018-10-02 Price Changed — MRED as Distributed by MLS Grid
- 2018-09-25 Price Changed — MRED as Distributed by MLS Grid
- 2018-09-14 Listed — MRED as Distributed by MLS Grid
- 2017-10-19 Sold (Public Records) $228,500 Public Records
- 2017-09-25 Sold (MLS) $228,500 MRED as Distributed by MLS Grid
- 2017-08-30 Contingent — MRED as Distributed by MLS Grid
- 2017-08-16 Price Changed $229,900 MRED as Distributed by MLS Grid
- 2017-07-25 Price Changed $239,900 MRED as Distributed by MLS Grid
- 2017-07-07 Listed $248,900 MRED as Distributed by MLS Grid
- 2017-06-30 Listing Removed — MRED as Distributed by MLS Grid
- 2017-06-15 Price Changed — MRED as Distributed by MLS Grid
- 2017-06-15 Listed — MRED as Distributed by MLS Grid
- 2017-06-14 Listing Removed — MRED as Distributed by MLS Grid
- 2017-05-29 Listed — MRED as Distributed by MLS Grid
- 2017-05-29 Listing Removed — MRED as Distributed by MLS Grid
- 2017-04-11 Listed — MRED as Distributed by MLS Grid
- 2007-12-04 Listing Removed — MRED as Distributed by MLS Grid
- 2007-08-29 Listed — MRED as Distributed by MLS Grid
- 2007-08-22 Listing Removed — MRED as Distributed by MLS Grid
- 2007-04-21 Listed — MRED as Distributed by MLS Grid
- 2007-03-26 Listing Removed — MRED as Distributed by MLS Grid
- 2006-12-19 Listed — MRED as Distributed by MLS Grid
Property tax history
+2.3%/yrLatest (2024): $7,485 · +4.6% YoY. Source: county tax records.
Cash-flow waterfall
monthlySold comps — $/sqft
last 12 mo · ≤1 miLoading sold comps…