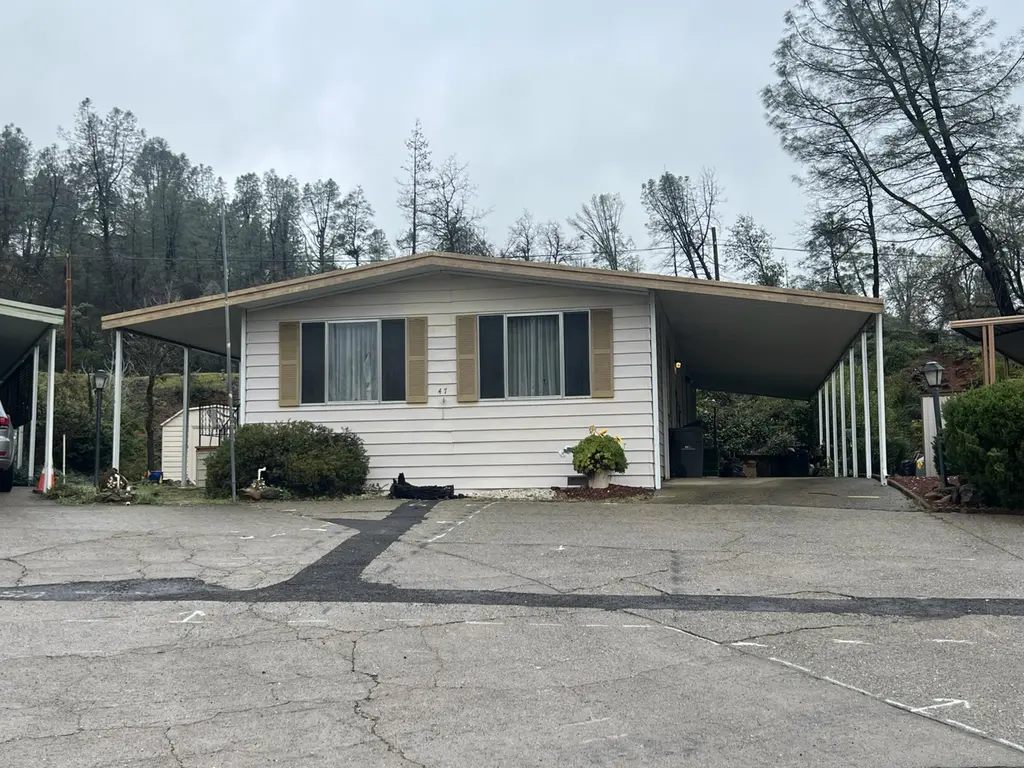
3304 Shasta Dam Blvd #47 · Shasta Lake, CA
Flood risk 1/10 · Minimal
- FEMA flood zone
- X (unshaded)
- Chance of flooding over 30 yrs
- 0.0%
- Est. flood insurance / yr
- $507 – $1,088
Fire risk 7/10 · Major
- Est. fire insurance / yr
- $659 – $1,223
Heat risk 8/10 · Major
- Hot days now (above 105°F)
- 7 days/yr
- Hot days in 30 yrs
- 17 days/yr
Wind risk 1/10 · Minimal
- Chance of severe wind over 30 yrs
- —
Air-quality risk 10/10 · Severe
- Unhealthy air days now
- 44 days/yr
- Unhealthy air days in 30 yrs
- 46 days/yr
Risk factors via First Street. Map © Google.
Why this score? — see what drove the B grade
The composite is a weighted blend of 9 inputs, each scored 0–100. Each bar is that input's sub-score; the figure is the points it added to the 100-point composite (weight × sub-score).
- Cash flow +30.0/30.0
- ARV discount +13.4/15.0
- 1% rule +10.0/10.0
- DSCR +10.0/10.0
- Livability +3.2/5.0
- Rent growth +2.5/5.0
- Schools +2.5/10.0
- Condition / age +2.2/5.0
- Appreciation +0.0/10.0
$61,000
🖨 Deal sheet 📄 Offer letter ✓ Due diligence
Listing remarks MLS
Perched at the top of the hill, this home is one of the most sought-after locations in the park. Enjoy added privacy with no neighbors behind or in front, along with a generously sized side yard offering plenty of outdoor space. The covered patio is a wonderful addition--perfect for relaxing or entertaining year-round. With 1,536 square feet of living space, this home provides a comfortable and spacious layout designed for easy living. Located in Twin Lake Estate, a beautifully maintained 55+ community, residents enjoy access to a clubhouse, scenic walking trails, and a peaceful pond setting
Key facts
- Added privacy
- Covered patio
- Access to clubhouse
Tags
Neighborhood map
What this means for you Summary
Snapshot
- This is a 2-bed/2.0-bath manufactured listed at $61k. Condition is rated fair.
Deal economics
- At list price, monthly cash flow is $829 ($10k/yr) — positive.
- The deal already cash-flows at list — no discount required.
- Meets the 1% rule at list price ($2k rent vs $61k).
- Recommended offer: $56k (9.0% below list) — sets the bar for market timing.
- Cap rate 22.6% vs local median 3.8% in Shasta Lake — top-decile yield for the area; either an underpriced asset or a hidden risk that comps aren't pricing in. Stress-test before assuming the spread holds.
Location & tenants
- Location reads 65/100 on livability (#399 in CA) — a middle-class / working-renter tenant base. Strengths: housing A+, health & safety A+, commute A; Watch: employment C-, schools D-, crime F.
- Gateway Unified (suburban): math 25% / reading 35% proficiency, ranked #355 of 517 in CA (top 69%) — families likely to look elsewhere, expect single-tenant / working-renter base with shorter leases.
- Market conditions: 93 active listings in the ZIP; 1 comparable units currently listed for rent nearby; 246 units permitted in Shasta County in 2024 (0 in 5+ unit buildings).
Forward outlook
- Local home prices are declining (-3.0%/yr); year-one equity from $422 of loan paydown is wiped out by about $2k of value loss. Plan a longer hold.
- Shasta County population projected to shrink 9% by 2050 — rents likely to lag national; underwrite the cash flow, not the appreciation.
- At projected returns (-3.0% appreciation + 3.0% rent growth), your $17k cash investment doubles in ~2 years — after that, you're playing with house money.
Negotiation context
- It's been on market 113 days — a 9% lower offer ($56k) is reasonable based on typical stale-listing flexibility.
Risks & watch-outs
- Climate carrying-cost: major wildfire risk; extreme-heat days projected 7→17/yr by 2055 (HVAC capex compounding) — expect insurance premiums to compound above CPI over the hold.
Questions for the listing agent
- It's been on market 113 days. Have you received any prior offers? Is the seller open to a 9% concession, seller financing, or rate buy-down credit?
- Have any recent inspections been done? Can we get a copy of the seller's disclosures and any deferred-maintenance estimates?
- Built in 1977 — when were the roof, HVAC, electrical panel, plumbing, and water heater last replaced?
- Why hasn't it sold? Are there any deal-killer items the seller is aware of (foundation, flood, title, zoning, code violations)?
- Is there a deadline driving the sale (1031 exchange, divorce, estate, relocation)? That informs how much negotiation room exists.
- Schools are D-rated, which usually means shorter tenancies and higher turnover. Who's the typical renter profile here, and what's been the actual vacancy rate?
- Crime grade is F in this area — have there been break-ins, vandalism, or insurance claims at this property in the last 3 years? What carrier currently insures it and at what premium?
- What's the average days-on-market for RENTAL listings here right now (not sales)? A rising rental-DOM trend means longer vacancies and softer asking-rent achievability than the comps imply.
- What's the recent tenant-quality profile in this submarket — average credit score on applications, eviction rate, late-payment / NSF rate, and stable-employment percentage? A property-management company in the area should have these aggregated.
- How much new for-sale + rental construction is in the pipeline within 1–3 miles? Heavy new supply typically softens prices + rents 12–24 months out; constrained supply supports both.
Investment metrics
- 1% rule
- 2.60% ✓
- Cap rate
- 22.61%
- Cash-on-cash
- 58.26%
- DSCR
- 3.59
- GRM
- 3.2
CMA / ARV
- ARV (median comp)
- $70,214
- List price
- $61,000
- Delta
- -13.12%
- Verdict
- UNDERPRICED
- Comps
- 12 within 1.0 mi
Show comp detail 12 sales within ~0.75 mi
| Address | Dist | Beds/Ba | Sqft | Sold | Price | $/sf | Match |
|---|---|---|---|---|---|---|---|
| 3304 Shasta Dam Blvd #96 | 0.30mi | 2/2.0 | 1,536 (0%) | 3mo | $69,000 | $45 | 83 |
| 3304 Shasta Dam Blvd Spc 39 | 0.08mi | 2/2.0 | 1,440 (-6%) | 7mo | $72,500 | $50 | 80 |
| 3304 Shasta Dam Blvd #131 | 0.23mi | 3/2.0 (+1) | 1,560 (+2%) | 7mo | $94,000 | $60 | 76 |
| 3304 Shasta Dam Blvd #29 | 0.18mi | 2/2.0 | 1,440 (-6%) | 8mo | $40,000 | $28 | 75 |
| 3304 Shasta Dam Blvd Spc 60 | 0.22mi | 3/2.0 (+1) | 1,440 (-6%) | 2mo | $76,500 | $53 | 72 |
| 3304 Shasta Dam Blvd Spc 124 | 0.47mi | 3/2.0 (+1) | 1,508 (-2%) | 2mo | $148,000 | $98 | 68 |
| 3304 Shasta Dam Blvd #3 | 0.07mi | 2/2.0 | 1,344 (-12%) | 12mo | $25,000 | $19 | 66 |
| 3304 Shasta Dam Blvd #65 | 0.46mi | 2/2.0 | 1,400 (-9%) | 3mo | $46,000 | $33 | 62 |
| 3304 Shasta Dam Blvd #136 | 0.26mi | 3/2.0 (+1) | 1,326 (-14%) | 1mo | $97,000 | $73 | 60 |
| 3304 Shasta Dam Blvd #147 | 0.31mi | 3/2.0 (+1) | 1,368 (-11%) | 8mo | $103,500 | $76 | 56 |
| 3304 Shasta Dam Blvd #67 | 0.29mi | 3/2.0 (+1) | 1,344 (-12%) | 6mo | $44,000 | $33 | 55 |
| 3304 Shasta Dam Blvd #181 | 0.48mi | 3/2.0 (+1) | 1,716 (+12%) | 16mo | $72,500 | $42 | 40 |
Match score weights: distance 35% · size 25% · config 20% · recency 20%. Top-matched comps best support the ARV.
Projected returns pro-forma
-3.0% appreciation · 3.0% rent growth · sell at horizon
- IRR
- 56.8%
- Equity multiple
- 3.51×
- Total profit
- $42,954
- Equity at exit
- $9,095
- IRR
- 61.8%
- Equity multiple
- 7.18×
- Total profit
- $105,507
- Equity at exit
- $5,274
Cash invested: $17,080 (down + closing). Projections, not guarantees.
Landlord ↔ Tenant lean methodology
- Overall (STATE)
- 18 Strongly Tenant-Friendly
- State California
- 18 Strongly Tenant-Friendly · D+13
- County
- — inherits STATE
- City
- — inherits STATE
ZIP-level market 96019
- Active inventory
- 93
- Price-to-rent
- 3.2×
Monthly cashflow live
- Estimated rent
- $1,583 medium interval (Pro) →
- Mortgage (P&I)
- −$320
- Tax est. 1.5%
- −$76 /mo · $915/yr
- Insurance
- −$25
- HOA
- −$0
- Vacancy / Maint / Mgmt
- −$332
- Net cashflow
- $829
Break-even live
UW: 25.0% down · 7.5% · 30yr · 1.5% tax · 5.0% vac · 8.0% maint · 8.0% mgmt
Financing live
Cash to close
- Down payment
- $15,250
- Closing costs
- $1,830
- Reserves months
- —
- Total cash needed
- —
Loan-product check · same deal, 3 products live
Conventional
25% down · 7.5% · 30yr
- Down + closing
- —
- Monthly P&I
- —
- Monthly cashflow
- —
- DSCR
- —
- Eligible?
- —
Personal DTI + credit; lowest rate.
DSCR
20% down · 8.5% · 30yr
- Down + closing
- —
- Monthly P&I
- —
- Monthly cashflow
- —
- DSCR
- —
- Eligible?
- —
No personal income docs; deal must DSCR.
Hard money
10% down · 12.0% · 12mo
- Down + closing
- —
- Monthly P&I
- —
- Monthly cashflow
- —
- DSCR
- —
- Eligible?
- —
Short-term bridge; refi at stabilization.
Rent comps 1 comps
| Address | Beds | Baths | Sqft | Rent | $/sqft | DOM | Units | Dist |
|---|---|---|---|---|---|---|---|---|
| 13710 Pit St Shasta Lake, CA | 2.0 | 1.0 | 1165 | $1,475 | $1.27 | 43d | 1 | 0.46mi |
Listing history 19 events
-
2026-06-19days on market $61,000 Active 113 DOM
-
2026-06-18days on market $61,000 Active 112 DOM
-
2026-06-17days on market $61,000 Active 111 DOM
-
2026-06-16days on market $61,000 Active 110 DOM
-
2026-06-15days on market $61,000 Active 109 DOM
-
2026-06-14days on market $61,000 Active 107 DOM
-
2026-06-13days on market $61,000 Active 106 DOM
-
2026-06-10days on market $61,000 Active 104 DOM
-
2026-06-09days on market $61,000 Active 103 DOM
-
2026-06-08days on market $61,000 Active 102 DOM
-
2026-06-07days on market $61,000 Active 101 DOM
-
2026-06-03pricedays on market $61,000 Active 97 DOM
-
2026-06-02days on market $71,000 Active 96 DOM
-
2026-06-01days on market $71,000 Active 95 DOM
-
2026-05-31days on market $71,000 Active 94 DOM
-
2026-05-30days on market $71,000 Active 93 DOM
-
2026-05-11price $71,000 598-char remark
Show marketing remark (598 chars)
Perched at the top of the hill, this home is one of the most sought-after locations in the park. Enjoy added privacy with no neighbors behind or in front, along with a generously sized side yard offering plenty of outdoor space. The covered patio is a wonderful addition--perfect for relaxing or entertaining year-round. With 1,536 square feet of living space, this home provides a comfortable and spacious layout designed for easy living. Located in Twin Lake Estate, a beautifully maintained 55+ community, residents enjoy access to a clubhouse, scenic walking trails, and a peaceful pond setting
-
2026-04-06price $76,000 598-char remark
Show marketing remark (598 chars)
Perched at the top of the hill, this home is one of the most sought-after locations in the park. Enjoy added privacy with no neighbors behind or in front, along with a generously sized side yard offering plenty of outdoor space. The covered patio is a wonderful addition--perfect for relaxing or entertaining year-round. With 1,536 square feet of living space, this home provides a comfortable and spacious layout designed for easy living. Located in Twin Lake Estate, a beautifully maintained 55+ community, residents enjoy access to a clubhouse, scenic walking trails, and a peaceful pond setting
-
2026-02-25$81,000 Active 598-char remark
Show marketing remark (598 chars)
Perched at the top of the hill, this home is one of the most sought-after locations in the park. Enjoy added privacy with no neighbors behind or in front, along with a generously sized side yard offering plenty of outdoor space. The covered patio is a wonderful addition--perfect for relaxing or entertaining year-round. With 1,536 square feet of living space, this home provides a comfortable and spacious layout designed for easy living. Located in Twin Lake Estate, a beautifully maintained 55+ community, residents enjoy access to a clubhouse, scenic walking trails, and a peaceful pond setting
ⓘ Source: listings_history table (triggers on properties + properties_extension) + one-shot
backfill from property_details.listing_events for pre-trigger history.
Climate risk First Street
- Flood 1/10 Low FEMA zone X (unshaded) · 0% chance over 30 yrs
- Wildfire 7/10 Severe
- Heat 8/10 Severe 7 d/yr ≥105°F today · 17 d/yr by 30 yrs out
- Wind 1/10 Low
- Air quality 10/10 Extreme 44 unhealthy d/yr today · 46 by 30 yrs out
Nearby sold comps map
Loading sold comps map…
Walkable amenities ~0.75 mi
Loading nearby amenities…
Taxation est. · year 1
- Rental income
- $18,999
- − Mortgage interest
- −$3,417
- − Property taxes
- −$915
- − Insurance
- −$305
- − Repairs & maintenance
- −$1,520
- − Management
- −$1,520
- − Depreciation
- −$1,775
- Taxable income
- $9,548
- Est. tax owed @ 24.0%
- −$2,292
- After-tax cash flow
- $7,659/yr
For passive investors: Depreciation is non-cash, so a rental often shows a tax loss while cash-flowing — sheltering income. Rental losses are passive: they offset passive income freely, and up to $25,000/yr can offset ordinary (W-2) income if you actively participate and your MAGI is under $100k (phasing out to $0 by $150k); unused losses carry forward. On sale, claimed depreciation is recaptured at up to 25%, and gains may owe capital-gains tax (a 1031 exchange can defer both). Figures are a year-1 estimate at your 24.0% rate — not tax advice; consult a CPA.
Condition & rehab AI · 12 photos
This manufactured home requires moderate renovations to update the kitchen and bathroom, and to improve the interior and exterior aesthetics. With updates, it has the potential to become a move-in-ready property with increased resale and rental value.
Repairs flagged
- Moderate kitchen cabinets — dated and in need of updating
- Moderate bathroom fixtures — dated and in need of updating
Value-add opportunities
- Both update kitchen cabinets and fixtures — modernizing the kitchen would appeal to both buyers and renters
- Both paint interior walls — fresh paint would improve the home's curb appeal and interior aesthetics
- Both replace carpeting with hardwood or tile — new flooring would improve the home's overall appearance and increase its value
Renovation cost estimate screening
| Repair item | Severity | Est. cost |
|---|---|---|
| kitchen cabinets · dated and in need of updating | Moderate | $3,000–15,000 |
| bathroom fixtures · dated and in need of updating | Moderate | $3,000–15,000 |
| Total estimated repair cost · 2 items | $6,000–30,000 |
Value-add ROI direction
- Both update kitchen cabinets and fixtures — modernizing the kitchen would appeal to both buyers and renters ↑
- Both paint interior walls — fresh paint would improve the home's curb appeal and interior aesthetics ↑
- Both replace carpeting with hardwood or tile — new flooring would improve the home's overall appearance and increase its value ↑
ⓘ Cost ranges are severity-bucket heuristics (US national rule-of-thumb). Get contractor quotes + a written scope before underwriting a rehab budget.
Schools (NCES district)
- District
- Gateway Unified
- NCES district ID
- 0614950
- Math proficiency
- 25% ▼ -5.00%
- Reading proficiency
- 35% ▲ 2.00%
- Median HH income
- $41,888
- Composite
- 25.39/100
- National rank
- #7465
- State rank
- #355 of 517 in CA
Livability — Shasta Lake
- Score
- 65/100
- State rank
- #399
- US rank
- #13546
Category grades
Schools grade is shown separately in the Schools card above.
Census & demographics
- Census place
- Shasta Lake, CA
- County
- Shasta County · 147,641 people
- City population
- 10,350
- Metro
- Redding, CA
- Population (ZIP)
- 10,350
- Household income
- $67,446
- Rent vs Own
- Severe rent burden
- 260.0
Population outlook (Shasta County) Hauer SSP2
- Today (2025)
- 179,231 people
- By 2030
- 176,953 · -1.3%
- By 2040
- 169,982 · -5.2%
- By 2050
- 162,547 · -9.3%
- By 2075
- 145,649 · -18.7%
- By 2100
- 123,025 · -31.4%
Race, ethnicity, and origin ACS 2023
- Neighborhood character
- Predominantly White (77%)
- Race & ethnicity
- White 77% Two or more races 12% Hispanic / Latino 9% Asian 4% Native American 2%
- Hispanic origin (detail)
- Mexican 8%
- Common ancestry
- Russian 4% Romanian 4% Italian 4%
- Foreign-born
- 2% · Canada
- Languages at home
- 94% English-only · Spanish 4% Other Asian/Pacific 1%
Political lean MEDSL · Shasta
- 2024 margin
- Solid R (+36.5) · D 30.5% · R 67.0% · Other 2.5%
- 2008→2024 swing
- -10.7pp toward R · 2008: -25.8pp · 2024: -36.5pp
- All cycles
- 2024: R+36.5 2020: R+33.1 2016: R+37.4 2012: R+30.3 2008: R+25.8
Not yet ingested
- Civics
- —
Market trends
- HPI YoY
- ▼ -194.66%
- Current HPI
- 170.6085
- Rent YoY
- —
- Metro
- Redding, CA
- State GDP YoY
- ▲ 3.21%
- F500 in state
- 116
Industry mix (Fortune 500 HQ in CA)
| Industry | F500 HQs | Revenue |
|---|---|---|
| Technology | 27 | $1,492B |
|
||
| Financial Services | 3 | $174B |
|
||
| Retail | 3 | $44B |
|
||
| Insurance | 3 | $26B |
|
||
| Media / Entertainment | 2 | $115B |
|
||
| Pharmaceuticals / Biotech | 2 | $62B |
|
||
Price history
-12.3% since first listed3 events — show timeline
- 2026-05-11 Price Changed $71,000 SAOR
- 2026-04-06 Price Changed $76,000 SAOR
- 2026-02-25 Listed $81,000 SAOR
Cash-flow waterfall
monthlySold comps — $/sqft
last 12 mo · ≤1 miLoading sold comps…